Label Applicators Market
Label Applicators Market by Product Type (Integrated Automated, Stand Alone, Semi-automated), Process Type (Wipe-on, Air Blow, Tamp Blow), Application (Bottles, Vials, Pouches, Boxes & Carton, Trays), End Use (Chemicals, Personal Care & Cosmetics, Food & Beverages, Pharmaceuticals, Electrical & Electronics, Logistics & Warehousing), & Region- Forecast to 2022-2028
Market Insights on Label Applicators covering sales outlook, demand forecast & up-to-date key trends
Label Applicators Market Snapshot
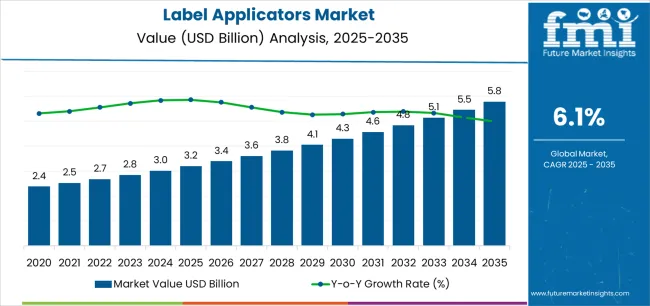
[203 Pages Report] The global label applicators market is estimated at ~US$ 2.6 Bn in 2022 and is projected to reach ~US$ 3.5 Bn by 2028, at a CAGR of 5.4% from 2022 to 2028.
Label Applicators Market Size 2022 |
US$ 2.6 Bn |
Label Applicators Market Size 2028 |
US$ 3.5 Bn |
Value CAGR (2022-2028) |
5.4% |
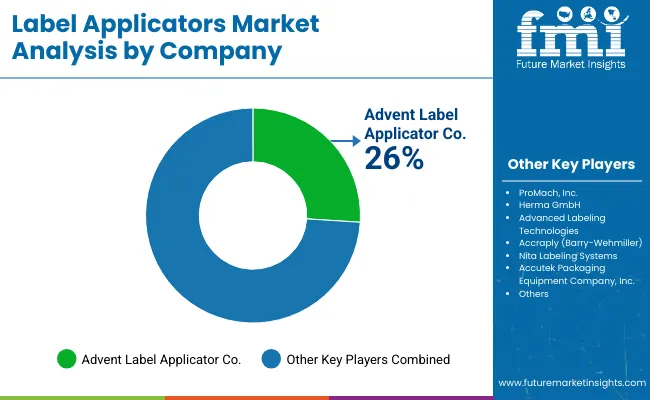
Collective Value Share: Top 5 Companies (2022E) |
14% |
The global sales of label applicators are anticipated to grow at 5.1% y-o-y in 2021 with sales of more than 233 Thousand units. While FMI still estimates the label applicators market to grow significantly, Due to significant growth recorded in end use industries for high-speed labelling solutions across the globe.
According to FMI, Asia-Pacific accounts for 34% of sales of label applicators in 2022 and is anticipated to account for 39% of sales in 2028.
Global label applicators market forms around 4-5% of the global packaging machinery market worth ~US$ 58 billion in 2021.
Historic and Forecast Market Outlook for Label Applicators
The global label applicators market is anticipated to exhibit growth at 5.4% between 2022-2028, on the backdrop of rising demand for products with proper labelling and marking. Moreover increased awareness regarding appropriate labelling among various end-use industries and brand owners such as food & beverages and pharmaceutical industries is expected to fuel the demand for label applicators over the forecasted period.
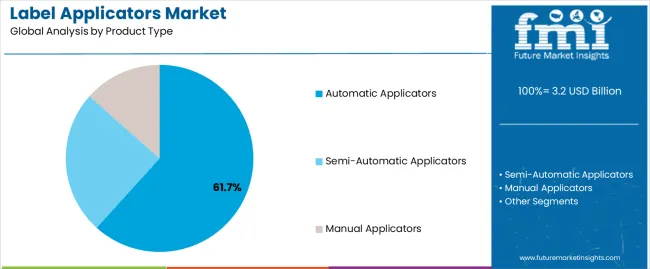
Transporting products faster and efficiently can save both time and money, along with that it increases the productivity and customer satisfaction at the same time. Using traditional way of manual labelling, manufacturers are facing challenges in terms of next level production and dispatch process delay. Also, manual labelling leads to time consumption and mismatch in label positioning in case of mass production. As per FMI analysis, automated label applicators are the best suitable solution for establishing high speed supply chain process.
Manufacturers aiming at increased production capacity that enables them to produce, and they switch to label applicators that can help in achieving cost savings and high productivity. Label applicators provide various benefits, such as labelling accuracy and reduced downtime. These factors are expected to drive the demand for global label applicators.
As per the Fair Packaging and Labelling Act (FLPA Act), which directs Food and Drug Administration (FDA) to make sure that all consumer commodities to be labelled disclosing, contents, identity of commodity and name & place of manufacturer. Above mentioned government regulations are anticipated to boost the sales of labelling equipment over the next decade.
Let us know your requirement to get
100% FREE customization
How Emerging Economies in Asia Pacific Offer Lucrative Growth Opportunities over the Upcoming Decade?
The label applicator market in the Asia Pacific is expected to expand at the fastest rate, with major contributions coming from developing countries, such as China and India. China alone is estimated to account for around 17% of the global packaging demand.
Similarly, the other countries of the Asia Pacific are also projected to witness fast growth. Labelling of products is necessary to keep a product’s integrity and sharing must know information with the consumers.
The fact that the GDP of the Asian countries is rising at a rapid pace indicates growing output and an increasing number of manufacturers requiring label applicators for labelling their products for branding and promotional purposes.
This opportunity has been observed by various European and North American labelling machine manufacturers and they are, therefore, targeting the Asia Pacific through various expansion activities, such as mergers with prominent regional players and acquisition of small players. These developments will present significant opportunities in the label applicator market in the Asia Pacific.
Why Stringent Packaging Regulations and Growing Demand for Packaged Food & Beverages Propelling The Sales of Labelling Equipment Across The Regions?
According to the latest food labelling requirements stated by Food and Drug Administration (FDA), makes it mandatory for brand owners to provide nutrient labelling, product code, instruction to use and declaration against any type of food allergens used. Thus, stringent regulations by authorities governing food & beverages are bolstering the sales of labelling machines.
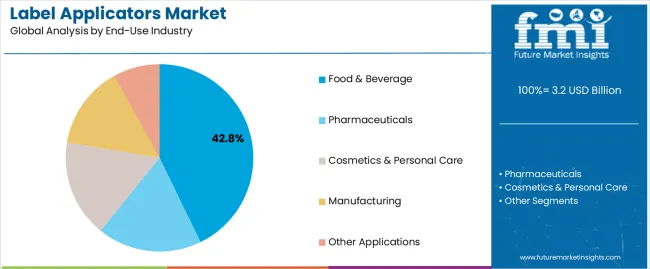
The global label applicator market is segmented into various end-use industries, such as chemicals, food & beverages, pharmaceuticals, consumer goods and others. Among these, the food & beverages segment is expected to hold a significant position in the label applicator market.
Growth in the food & beverage industry will drive the demand for label applicators. The food & beverage industry presents various challenges for labelling. For many food & beverage manufacturers, labelling is a must end of the line packaging process to deliver the product in an efficient and eye-catching manner.
Effective labelling enhances a product’s appeal to customers. Once the packaging steps, such as filling, sealing, capping and others are done, labelling is done to make the product stand out from the rest. Within the beverage industry, after the filling process, labels are applied to the bottles.
Almost all manufacturing units have begun to adopt conveyor systems and hence the process of labelling has become faster and efficient. Label applicators are installed in such industries to enhance productivity.
Find your sweet spots for generating winning opportunities in this market.
Talk to AnalystHow Covid-19 Impacted Global Label Applicators Market?
Due to the outbreak of covid-19, the provincial government bodies and regulatory authorities enforced strict lockdown, to further curb the spread of the virus among humans. Only manufacturing and supplying of medicinal supplies along with food & beverages was allowed under strict restrictions by governing authorities. People were preferring to use online shopping over visiting physical stores.
Global demand for label applicators witnessed a negative impact in the year 2020, as major end-user industries including chemicals, personal care & cosmetics and many others were forced to temporarily shut down all their operations due to restrictions and disruptions in supply chains. Moreover, in the subsequent year after the pandemic, the market is expected to register burgeoning growth over the forecasted period.
Country-wise Insights
How China’s Sky Rocketing Manufacturing Industry Fuels the Demand for Labelling Machines?
According to the World Economic Forum (WEF), China accounts for more than 1/4th of global manufacturing output and contributes almost 1/3rd to the country’s total economic output, making China a manufacturing powerhouse for almost all manufacturing industries. Escalating demand for goods manufactured in China, along with growth witnessed in a number of global manufacturers setting up their manufacturing facilities in the country makes it the largest market for coding & marking equipment across the globe.
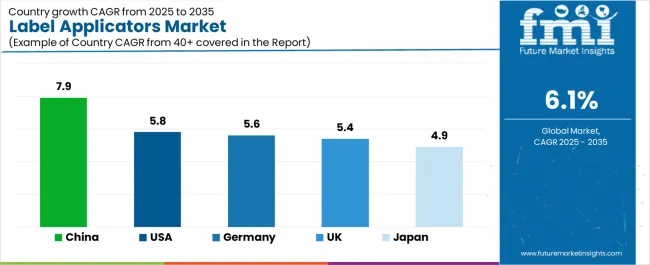
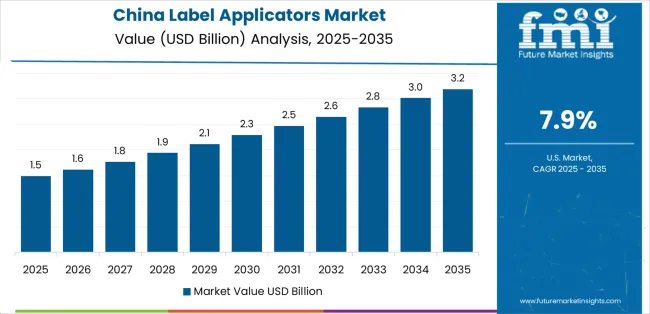
The sales of label applicators in China is expected to exhibit growth at 8.0% CAGR between 2022 and 2028, as a result of the exponential rise in demand for label applicator machines across various end-use industries. As a result that China is expected to offer a lucrative growth opportunity of more than US$ 270 Mn to manufacturers engaged in the production of label applicators in China over the next six years.
Why Growing Machinery & Equipment Industry In Germany Will Contribute To Increase in Sales of Label Applicators?
As per the Germany Trade & Invest (GTAI), Germany caters to 16% of the global demands for machinery trade and supplies, also 79% of total machinery solutions produced in Germany are exported across the globe. The growth in demand witnessed for machinery & equipment produced in Germany ensures a positive growth in overall sales of labelling equipment over the forecasted period.
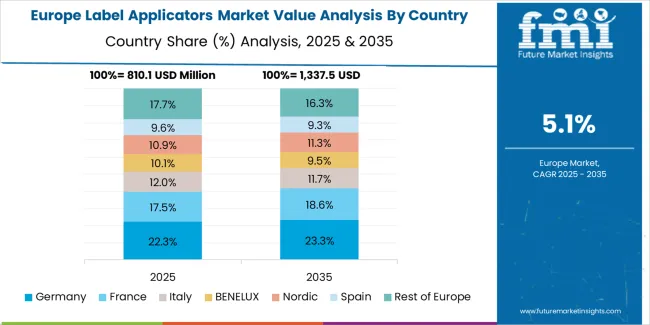
Strict government regulations of making it mandatory for various end-user industries including personal care & cosmetics along with others to provide proper marking & labelling of each product. Therefore, Germany is expected to hold almost 1/3rd market share of the Western Europe label applicators market in the year 2022.

An unified Market Research Subscription Platform, built for today’s disparate research needs.
Category-wise Insights
Which is the Most Widely Used Application of Labelling Machines across the Globe?
The labelling machines are the most preferred labelling solution for proper labelling in a wide range of applications, out of which bottles are expected to hold the highest market share due to sharp rise in consumption as well as demand for bottled foods & beverages.
More than 46% of labelling equipment sold across the globe are used for labelling bottles, which also makes it the most profitable application with a total incremental opportunity of US$ 235.3 Mn over the forecasted period.
What Makes Food & Beverage Industry The Largest End-Use Industry for Labelling Equipment?
Rising consumer awareness regarding proper marking and labelling on all types of packed edibles and strict regulations by regulating authorities makes food & beverage industry the largest end-use industry for label applicators. Total sales of label applicators used in the food & beverage industry is valued at US$ 436.1 Mn in 2022 and is expected to increase exponentially in next five years.
Competitive Landscape
The key players operating in the label applicators market are eyeing expanding their presence by investing in operational facilities along with increasing their output capacity. Also, the players are launching innovative packaging and labelling technologies:-
- In November 2021, Gernep Worldwide partnered with Herma GmbH for integrating Herma 500 Rotary in their production line to apply labels at ketchup bottles.
- In October 2021, ProMach won the 2021 Technology Excellence Award at Pack Expo for its new rotary roll-fed labeller.
Scope of Report
Attribute |
Details |
Forecast Period |
2022-2028 |
Historical Data Available for |
2013-2021 |
Market Analysis |
US$ Million for Value and Units for Volume |
Key Regions Covered |
North America, Latin America, Western Europe, Eastern Europe, Asia Pacific excluding Japan, Middle East & Africa, and Japan |
Key Countries Covered |
US, Canada, Brazil, Mexico, Germany, Spain, Italy, France, U.K., Russia, China, India, Australia & New Zealand, GCC Countries, and South Africa |
Key Segments Covered |
Automation, Speed, Application, End Use, and Region |
Key Companies Profiled |
|
Report Coverage |
Market Forecast, Company Share Analysis, Competition Intelligence, DROT Analysis, Market Dynamics and Challenges, and Strategic Growth Initiatives |
Customization & Pricing |
Available upon Request |
Label Applicators Market by Category
By Automation:
- Semi-Automatic
- Automatic
By Speed:
- Less Than 1,000 IPM
- 1001 – 2,500 IPM
- Above 2,500 IPM
*IPM- Inches per Minute
By Application:
- Bottles
- Vials
- Pouches
- Boxes & Carton
- Trays
- Others
By End-Use:
- Chemicals
- Personal Care & Cosmetics
- Food & Beverages
- Pharmaceuticals
- Electrical & Electronics
- Logistics & Warehousing
- Others
By Region:
- North America
- Latin America
- Western Europe
- Eastern Europe
- Asia Pacific Excluding Japan (APEJ)
- Middle East and Africa (MEA)
- Japan
Frequently Asked Questions
The global label applicators market is valued at US$ 2.6 Bn in the year 2022.
The global label applicators market is anticipated to reach a valuation of US$ 3.5 Bn by the year 2028.
Stringent regulatory requirements for labelling and features such as time & cost reduction for end-user industries are expected to boost the sales of label applicators.
Manufacturers adopting machinery solutions offering reduced changeover time are prevailing across the global applicators market.
The sales of Asia Pacific is estimated to account for 1/3rd of global sales of label applicators in 2022.
Key players in the automatic labelling machine market are ProMach, Inc., Herma GmbH, Quadrel Labeling Systems and Label-Aire, Inc.
Automatic labelling machine is estimated to record 5.4% CAGR between 2022-2028.
1. Executive Summary
1.1. Global Market Overview
1.2. Market Analysis
1.3. Analysis and Recommendations
2. Market Overview
2.1. Market Definition
2.2. Market Coverage
3. Key Market Trends
3.1. Key Trends Impacting the Market
3.2. Product Innovation / Development Trends
4. Key Success Factors
4.1. Product Adoption / Usage Analysis
4.2. Product USPs / Features
5. Global Label Applicators Market Demand Analysis 2013-2021 and Forecast, 2022-2028
5.1. Historical Market Volume (Units) Analysis, 2013-2021
5.2. Current and Future Market Volume (Units) Projections, 2022-2028
5.3. Y-o-Y Growth Trend Analysis
6. Global Label Applicators Market - Pricing Analysis
6.1. Regional Pricing Analysis, By Automation
6.2. Pricing Break-up
6.3. Global Average Pricing Analysis Benchmark
7. Global Label Applicators Market Demand (US$ Mn) Analysis 2013-2021 and Forecast, 2022-2028
7.1. Historical Market Value (US$ Mn) Analysis, 2013-2021
7.2. Current and Future Market Value (US$ Mn) Projections, 2022-2028
7.2.1. Y-o-Y Growth Trend Analysis
7.2.2. Absolute $ Opportunity Analysis
8. Market Background
8.1. Global Packaging Market Overview
8.2. Global Packaging Machinery Market Overview
8.3. Global Labels Market Overview
8.4. Macro-Economic Factors & Co-relation Analysis
8.4.1. Global Packaging Industry Growth
8.4.2. Global Packaging Machine Market Overview
8.4.3. Global Labels Market
8.4.4. COVID-19 Pandemic
8.5. Forecast Factors - Relevance & Impact
8.5.1. Global Packaging Market Growth
8.5.2. Global Rigid Packaging Market Outlook
8.5.3. Global Plastic Industry Growth
8.5.4. Global Food Service Market Growth
8.5.5. Global Beverage Market Growth
8.5.6. Segmental Revenue Growth of Key Players
8.5.7. Per Capita Expenditure on Food Services
8.6. Value Chain Analysis
8.6.1. Key Participants
8.6.1.1. Raw Material Suppliers
8.6.1.2. Label Applicators Manufacturers
8.6.1.3. End Use Industry
8.6.2. Profitability Margin
8.7. Market Dynamics
8.7.1. Drivers
8.7.2. Restraints
8.7.3. Opportunity Analysis
9. Impact of COVID-19
9.1. Current Statistics and Probable Future Impact
9.2. Impact of COVID-19 on Label Applicators Market
10. Global Label Applicators Market Analysis 2013-2021 and Forecast 2022-2028, By Automation
10.1. Introduction
10.2. Historical Market Size (US$ Mn) and Volume (Units) Analysis, By Automation, 2013-2021
10.3. Current and Future Market Size (US$ Mn) and Volume (Units) Analysis and Forecast, By Automation, 2022-2028
10.3.1. Semi-automatic
10.3.2. Automatic
10.4. Market Attractiveness Analysis, By Automation
11. Global Label Applicators Market Analysis 2013-2021 and Forecast 2022-2028, By Speed
11.1. Introduction
11.2. Historical Market Size (US$ Mn) and Volume (Units) Analysis, By Speed, 2013-2021
11.3. Current and Future Market Size (US$ Mn) and Volume (Units) Analysis and Forecast, By Speed, 2022-2028
11.3.1. Less Than 1,000 IPM
11.3.2. 1,001 to 2,500 IPM
11.3.3. Above 2,500 IPM (Inches Per Minute)
11.4. Market Attractiveness Analysis, By Speed
12. Global Label Applicators Market Analysis 2013-2021 and Forecast 2022-2028, By Application
12.1. Introduction
12.2. Historical Market Size (US$ Mn) and Volume (Units) Analysis, By Application, 2013-2021
12.3. Current and Future Market Size (US$ Mn) and Volume (Units) Analysis and Forecast, By Application, 2022-2028
12.3.1. Bottles
12.3.2. Vials
12.3.3. Pouches
12.3.4. Boxes & Cartons
12.3.5. Trays
12.3.6. Others
12.4. Market Attractiveness Analysis, By Application
13. Global Label Applicators Market Analysis 2013-2021 and Forecast 2022-2028, By End Use
13.1. Introduction
13.2. Historical Market Size (US$ Mn) and Volume (Units) Analysis, By End Use, 2013-2021
13.3. Current and Future Market Size (US$ Mn) and Volume (Units) Analysis and Forecast, By End Use, 2022-2028
13.3.1. Chemicals
13.3.2. Personal Care & Cosmetics
13.3.3. Food & Beverages
13.3.4. Pharmaceuticals
13.3.5. Electrical & Electronics
13.3.6. Logistics & Warehousing
13.3.7. Others
13.4. Market Attractiveness Analysis, By End Use
14. Global Label Applicators Market Analysis 2013-2021 and Forecast 2022-2028, By Region
14.1. Introduction
14.2. Historical Market Size (US$ Mn) and Volume (Units) Analysis, by Region, 2013-2021
14.3. Current Market Size (US$ Mn) and Volume (Units) Analysis and Forecast, by Region, 2022-2028
14.3.1. North America
14.3.2. Asia Pacific Ex. Japan (APEJ)
14.3.3. Western Europe
14.3.4. Eastern Europe
14.3.5. Latin America
14.3.6. Middle East & Africa (MEA)
14.3.7. Japan
14.4. Market Attractiveness Analysis, by Region
15. North America Label Applicators Market Analysis 2013-2021 and Forecast 2022-2028
15.1. Introduction
15.2. Historical Market Size (US$ Mn) and Volume (Units) Trend Analysis, by Market Taxonomy, 2013-2021
15.3. Market Size (US$ Mn) and Volume (Units) Forecast, by Market Taxonomy, 2022-2028
15.3.1.By Country
15.3.1.1. U.S.
15.3.1.2. Canada
15.3.2. By Automation
15.3.3. By Speed
15.3.4. By Application
15.3.5. By End Use
15.4. Market Attractiveness Analysis
15.4.1. By Country
15.4.2. By Automation
15.4.3. By Speed
15.4.4. By Application
15.4.5. By End Use
16. Latin America Label Applicators Market Analysis 2013-2021 and Forecast 2022-2028
16.1. Introduction
16.2. Historical Market Size (US$ Mn) and Volume (Units) Trend Analysis, by Market Taxonomy, 2013-2021
16.3. Market Size (US$ Mn) and Volume (Units) Forecast, by Market Taxonomy, 2022-2028
16.3.1.By Country
16.3.1.1. Brazil
16.3.1.2. Mexico
16.3.1.3. Argentina
16.3.1.4. Rest of Latin America
16.3.2. By Automation
16.3.3. By Speed
16.3.4. By Application
16.3.5. By End Use
16.4. Market Attractiveness Analysis
16.4.1. By Country
16.4.2. By Automation
16.4.3. By Speed
16.4.4. By Application
16.4.5. By End Use
17. Western Europe Label Applicators Market Analysis 2013-2021 and Forecast 2022-2028
17.1. Introduction
17.2. Historical Market Size (US$ Mn) and Volume (Units) Trend Analysis, by Market Taxonomy, 2013-2021
17.3. Market Size (US$ Mn) and Volume (Units) Forecast, by Market Taxonomy, 2022-2028
17.3.1.By Country
17.3.1.1. Germany
17.3.1.2. Italy
17.3.1.3. France
17.3.1.4. U.K.
17.3.1.5. Spain
17.3.1.6. BENELUX
17.3.1.7. Nordics
17.3.1.8. Rest of Western Europe
17.3.2. By Automation
17.3.3. By Speed
17.3.4. By Application
17.3.5. By End Use
17.4. Market Attractiveness Analysis
17.4.1. By Country
17.4.2. By Automation
17.4.3. By Speed
17.4.4. By Application
17.4.5. By End Use
18. Eastern Europe Label Applicators Market Analysis 2013-2021 and Forecast 2022-2028
18.1. Introduction
18.2. Historical Market Size (US$ Mn) and Volume (Units) Trend Analysis, by Market Taxonomy, 2013-2021
18.3. Market Size (US$ Mn) and Volume (Units) Forecast, by Market Taxonomy, 2022-2028
18.3.1.By Country
18.3.1.1. Russia
18.3.1.2. Poland
18.3.1.3. Rest of Eastern Europe
18.3.2. By Automation
18.3.3. By Speed
18.3.4. By Application
18.3.5. By End Use
18.4. Market Attractiveness Analysis
18.4.1. By Country
18.4.2. By Automation
18.4.3. By Speed
18.4.4. By Application
18.4.5. By End Use
19. Asia Pacific excluding Japan (APEJ) Label Applicators Market Analysis 2013-2021 and Forecast 2022-2028
19.1. Introduction
19.2. Historical Market Size (US$ Mn) and Volume (Units) Trend Analysis, by Market Taxonomy, 2013-2021
19.3. Market Size (US$ Mn) and Volume (Units) Forecast, by Market Taxonomy, 2022-2028
19.3.1.By Country
19.3.1.1. China
19.3.1.2. India
19.3.1.3. Australia & New Zealand
19.3.1.4. ASEAN
19.3.1.5. Rest of Asia Pacific excluding Japan (APEJ)
19.3.2. By Automation
19.3.3. By Speed
19.3.4. By Application
19.3.5. By End Use
19.4. Market Attractiveness Analysis
19.4.1. By Country
19.4.2. By Automation
19.4.3. By Speed
19.4.4. By Application
19.4.5. By End Use
20. Japan Label Applicators Market Analysis 2013-2021 and Forecast 2022-2028
20.1. Introduction
20.2. Historical Market Size (US$ Mn) and Volume (Units) Trend Analysis, by Market Taxonomy, 2013-2021
20.3. Market Size (US$ Mn) and Volume (Units) Forecast, by Market Taxonomy, 2022-2028
20.3.1. By Automation
20.3.2. By Speed
20.3.3. By Application
20.3.4. By End Use
20.4. Market Attractiveness Analysis
20.4.1. By Automation
20.4.2. By Speed
20.4.3. By Application
20.4.4. By End Use
21. Middle East and Africa Label Applicators Market Analysis 2013-2021 and Forecast 2022-2028
21.1. Introduction
21.2. Historical Market Size (US$ Mn) and Volume (Units) Trend Analysis, by Market Taxonomy, 2013-2021
21.3. Market Size (US$ Mn) and Volume (Units) Forecast, by Market Taxonomy, 2022-2028
21.3.1.By Country
21.3.1.1. GCC Countries
21.3.1.2. South Africa
21.3.1.3. Northern Africa
21.3.1.4. Rest of Middle East and Africa
21.3.2. By Automation
21.3.3. By Speed
21.3.4. By Application
21.3.5. By End Use
21.4. Market Attractiveness Analysis
21.4.1. By Country
21.4.2. By Automation
21.4.3. By Speed
21.4.4. By Application
21.4.5. By End Use
22. Label Applicators Market Country wise Analysis, 2022 & 2028
22.1. U.S. Label Applicators Market Analysis
22.1.1. Market Volume (Units) and Value (US$ Mn) Analysis and Forecast, by Market Taxonomy
22.1.1.1. By Automation
22.1.1.2. By Speed
22.1.1.3. By Application
22.1.1.4. By End Use
22.1.2. Canada Label Applicators Market Analysis
22.1.3. Market Volume (Units) and Value (US$ Mn) Analysis and Forecast, by Market Taxonomy
22.1.3.1. By Automation
22.1.3.2. By Speed
22.1.3.3. By Application
22.1.3.4. By End Use
22.2. Brazil Label Applicators Market Analysis
22.2.1. Market Volume (Units) and Value (US$ Mn) Analysis and Forecast, by Market Taxonomy
22.2.1.1. By Automation
22.2.1.2. By Speed
22.2.1.3. By Application
22.2.1.4. By End Use
22.3. Mexico Label Applicators Market Analysis
22.3.1. Market Volume (Units) and Value (US$ Mn) Analysis and Forecast, by Market Taxonomy
22.3.1.1. By Automation
22.3.1.2. By Speed
22.3.1.3. By Application
22.3.1.4. By End Use
22.4. Germany Label Applicators Market Analysis
22.4.1. Market Volume (Units) and Value (US$ Mn) Analysis and Forecast, by Market Taxonomy
22.4.1.1. By Automation
22.4.1.2. By Speed
22.4.1.3. By Application
22.4.1.4. By End Use
22.5. Spain Label Applicators Market Analysis
22.5.1. Market Volume (Units) and Value (US$ Mn) Analysis and Forecast, by Market Taxonomy
22.5.1.1. By Automation
22.5.1.2. By Speed
22.5.1.3. By Application
22.5.1.4. By End Use
22.6. Italy Label Applicators Market Analysis
22.6.1. Market Volume (Units) and Value (US$ Mn) Analysis and Forecast, by Market Taxonomy
22.6.1.1. By Automation
22.6.1.2. By Speed
22.6.1.3. By Application
22.6.1.4. By End Use
22.7. France Label Applicators Market Analysis
22.7.1. Market Volume (Units) and Value (US$ Mn) Analysis and Forecast, by Market Taxonomy
22.7.1.1. By Automation
22.7.1.2. By Speed
22.7.1.3. By Application
22.7.1.4. By End Use
22.8. U.K. Label Applicators Market Analysis
22.8.1. Market Volume (Units) and Value (US$ Mn) Analysis and Forecast, by Market Taxonomy
22.8.1.1. By Automation
22.8.1.2. By Speed
22.8.1.3. By Application
22.8.1.4. By End Use
22.9. Russia Label Applicators Market Analysis
22.9.1. Market Volume (Units) and Value (US$ Mn) Analysis and Forecast, by Market Taxonomy
22.9.1.1. By Automation
22.9.1.2. By Speed
22.9.1.3. By Application
22.9.1.4. By End Use
22.10. China Label Applicators Market Analysis
22.10.1. Market Volume (Units) and Value (US$ Mn) Analysis and Forecast, by Market Taxonomy
22.10.1.1. By Automation
22.10.1.2. By Speed
22.10.1.3. By Application
22.10.1.4. By End Use
22.11. India Label Applicators Market Analysis
22.11.1. Market Volume (Units) and Value (US$ Mn) Analysis and Forecast, by Market Taxonomy
22.11.1.1. By Automation
22.11.1.2. By Speed
22.11.1.3. By Application
22.11.1.4. By End Use
22.12. Australia & New Zealand Label Applicators Market Analysis
22.12.1. Market Volume (Units) and Value (US$ Mn) Analysis and Forecast, by Market Taxonomy
22.12.1.1. By Automation
22.12.1.2. By Speed
22.12.1.3. By Application
22.12.1.4. By End Use
22.13. GCC Countries Label Applicators Market Analysis
22.13.1. Market Volume (Units) and Value (US$ Mn) Analysis and Forecast, by Market Taxonomy
22.13.1.1. By Automation
22.13.1.2. By Speed
22.13.1.3. By Application
22.13.1.4. By End Use
22.14. South Africa Label Applicators Market Analysis
22.14.1. Market Volume (Units) and Value (US$ Mn) Analysis and Forecast, by Market Taxonomy
22.14.1.1. By Automation
22.14.1.2. By Speed
22.14.1.3. By Application
22.14.1.4. By End Use
23. Market Structure Analysis
23.1. Market Analysis, by Tier of Label Applicators Companies
23.2. Market Share Analysis of Top Players
23.3. Market Presence Analysis
23.3.1. By Regions
23.3.2. By Product Portfolio
24. Competition Analysis
24.1. Competition Dashboard
24.2. Competition Benchmarking
24.3. Competition Deep Dive
24.3.1. ProMach, Inc.
24.3.1.1.Overview
24.3.1.2. Product Portfolio
24.3.1.3. Profitability by Market Segments
24.3.1.4. Sales Footprint
24.3.1.5. Strategy Overview
24.3.1.5.1. Marketing Strategy
24.3.1.5.2. Product Strategy
24.3.1.5.3. Channel Strategy
24.3.2. Herma GmbH
24.3.2.1. Overview
24.3.2.2. Product Portfolio
24.3.2.3. Profitability by Market Segments
24.3.2.4. Sales Footprint
24.3.2.5. Strategy Overview
24.3.2.5.1. Marketing Strategy
24.3.2.5.2. Product Strategy
24.3.2.5.3. Channel Strategy
24.3.3. Quadrel Labeling Systems
24.3.3.1. Overview
24.3.3.2. Product Portfolio
24.3.3.3. Profitability by Market Segments
24.3.3.4. Sales Footprint
24.3.3.5. Strategy Overview
24.3.3.5.1. Marketing Strategy
24.3.3.5.2. Product Strategy
24.3.3.5.3. Channel Strategy
24.3.4. Label-Aire, Inc.
24.3.4.1. Overview
24.3.4.2. Product Portfolio
24.3.4.3. Profitability by Market Segments
24.3.4.4. Sales Footprint
24.3.4.5. Strategy Overview
24.3.4.5.1. Marketing Strategy
24.3.4.5.2. Product Strategy
24.3.4.5.3. Channel Strategy
24.3.5. In-Line Labeling Equipment, Inc.
24.3.5.1. Overview
24.3.5.2. Product Portfolio
24.3.5.3. Profitability by Market Segments
24.3.5.4. Sales Footprint
24.3.5.5. Strategy Overview
24.3.5.5.1. Marketing Strategy
24.3.5.5.2. Product Strategy
24.3.5.5.3. Channel Strategy
24.3.6. ALTech UK labeling Technologies Ltd.
24.3.6.1. Overview
24.3.6.2. Product Portfolio
24.3.6.3. Profitability by Market Segments
24.3.6.4. Sales Footprint
24.3.6.5. Strategy Overview
24.3.6.5.1. Marketing Strategy
24.3.6.5.2. Product Strategy
24.3.6.5.3. Channel Strategy
24.3.7. Universal Labeling Systems
24.3.7.1. Overview
24.3.7.2. Product Portfolio
24.3.7.3. Profitability by Market Segments
24.3.7.4. Sales Footprint
24.3.7.5. Strategy Overview
24.3.7.5.1. Marketing Strategy
24.3.7.5.2. Product Strategy
24.3.7.5.3. Channel Strategy
24.3.8. Weber Packaging Solutions, Inc.
24.3.8.1. Overview
24.3.8.2. Product Portfolio
24.3.8.3. Profitability by Market Segments
24.3.8.4. Sales Footprint
24.3.8.5. Strategy Overview
24.3.8.5.1. Marketing Strategy
24.3.8.5.2. Product Strategy
24.3.8.5.3. Channel Strategy
24.3.9. CTM Labeling Systems
24.3.9.1. Overview
24.3.9.2. Product Portfolio
24.3.9.3. Profitability by Market Segments
24.3.9.4. Sales Footprint
24.3.9.5. Strategy Overview
24.3.9.5.1. Marketing Strategy
24.3.9.5.2. Product Strategy
24.3.9.5.3. Channel Strategy
24.3.10. JDA Progress Industries Ltd.
24.3.10.1. Overview
24.3.10.2. Product Portfolio
24.3.10.3. Profitability by Market Segments
24.3.10.4. Sales Footprint
24.3.10.5. Strategy Overview
24.3.10.5.1. Marketing Strategy
24.3.10.5.2. Product Strategy
24.3.10.5.3. Channel Strategy
24.3.11. RJ Packaging Corporation
24.3.11.1. Overview
24.3.11.2. Product Portfolio
24.3.11.3. Profitability by Market Segments
24.3.11.4. Sales Footprint
24.3.11.5. Strategy Overview
24.3.11.5.1. Marketing Strategy
24.3.11.5.2. Product Strategy
24.3.11.5.3. Channel Strategy
24.3.12. Novexx Solutions GmbH
24.3.12.1. Overview
24.3.12.2. Product Portfolio
24.3.12.3. Profitability by Market Segments
24.3.12.4. Sales Footprint
24.3.12.5. Strategy Overview
24.3.12.5.1. Marketing Strategy
24.3.12.5.2. Product Strategy
24.3.12.5.3. Channel Strategy
24.3.13. Videojet Technologies, Inc.
24.3.13.1. Overview
24.3.13.2. Product Portfolio
24.3.13.3. Profitability by Market Segments
24.3.13.4. Sales Footprint
24.3.13.5. Strategy Overview
24.3.13.5.1. Marketing Strategy
24.3.13.5.2. Product Strategy
24.3.13.5.3. Channel Strategy
24.3.14. Hunkar Technologies, Inc.
24.3.14.1. Overview
24.3.14.2. Product Portfolio
24.3.14.3. Profitability by Market Segments
24.3.14.4. Sales Footprint
24.3.14.5. Strategy Overview
24.3.14.5.1. Marketing Strategy
24.3.14.5.2. Product Strategy
24.3.14.5.3. Channel Strategy
24.3.15. Harland Machine Systems Ltd.
24.3.15.1. Overview
24.3.15.2. Product Portfolio
24.3.15.3. Profitability by Market Segments
24.3.15.4. Sales Footprint
24.3.15.5. Strategy Overview
24.3.15.5.1. Marketing Strategy
24.3.15.5.2. Product Strategy
24.3.15.5.3. Channel Strategy
24.3.16. Auto Labe
24.3.16.1. Overview
24.3.16.2. Product Portfolio
24.3.16.3. Profitability by Market Segments
24.3.16.4. Sales Footprint
24.3.16.5. Strategy Overview
24.3.16.5.1. Marketing Strategy
24.3.16.5.2. Product Strategy
24.3.16.5.3. Channel Strategy
24.3.17. Accent Packaging Equipment
24.3.17.1. Overview
24.3.17.2. Product Portfolio
24.3.17.3. Profitability by Market Segments
24.3.17.4. Sales Footprint
24.3.17.5. Strategy Overview
24.3.17.5.1. Marketing Strategy
24.3.17.5.2. Product Strategy
24.3.17.5.3. Channel Strategy
*The list of companies is indicative in nature and is subject to change during the course of research
25. Assumptions and Acronyms Used
26. Research Methodology
Let us know your requirement to get
100% FREE customization
Table 01: Global Label Applicators Market Value (US$ Mn) Analysis, by Automation, 2013H-2028F
Table 02: Global Label Applicators Market Volume (Units) Analysis, by Automation, 2013H-2028F
Table 03: Global Label Applicators Market Value (US$ Mn) Analysis, by Speed, 2013H-2028F
Table 04: Global Label Applicators Market Volume (Units) Analysis, by Speed, 2013H-2028F
Table 05: Global Label Applicators Market Value (US$ Mn) Analysis, by Application, 2013H-2028F
Table 06: Global Label Applicators Market Volume (Units) Analysis, by Application, 2013H-2028F
Table 07: Global Label Applicators Market Value (US$ Mn) Analysis, by End Use, 2013H-2028F
Table 08: Global Label Applicators Market Volume (Units) Analysis, by End Use, 2013H-2028F
Table 09: Global Label Applicators Market Value (US$ Mn) Analysis, by Region, 2013H-2028F
Table 10: Global Label Applicators Market Volume (Units) Analysis, by Region, 2013H-2028F
Table 11: North America Label Applicators Market Value (US$ Mn) Analysis, by Automation, 2013H-2028F
Table 12: North America Label Applicators Market Volume (Units) Analysis, by Automation, 2013H-2028F
Table 13: North America Label Applicators Market Value (US$ Mn) Analysis, by Speed, 2013H-2028F
Table 14: North America Label Applicators Market Volume (Units) Analysis, by Speed, 2013H-2028F
Table 15: North America Label Applicators Market Value (US$ Mn) Analysis, by Application, 2013H-2028F
Table 16: North America Label Applicators Market Volume (Units) Analysis, by Application, 2013H-2028F
Table 17: North America Label Applicators Market Value (US$ Mn) Analysis, by End Use, 2013H-2028F
Table 18: North America Label Applicators Market Volume (Units) Analysis, by End Use, 2013H-2028F
Table 19: North America Label Applicators Market Value (US$ Mn) Analysis, by Country, 2013H-2028F
Table 20: North America Label Applicators Market Volume (Units) Analysis, by Country, 2013H-2028F
Table 21: Latin America Label Applicators Market Value (US$ Mn) Analysis, by Automation, 2013H-2028F
Table 22: Latin America Label Applicators Market Volume (Units) Analysis, by Automation, 2013H-2028F
Table 23: Latin America Label Applicators Market Value (US$ Mn) Analysis, by Speed, 2013H-2028F
Table 24: Latin America Label Applicators Market Volume (Units) Analysis, by Speed, 2013H-2028F
Table 25: Latin America Label Applicators Market Value (US$ Mn) Analysis, by Application, 2013H-2028F
Table 26: Latin America Label Applicators Market Volume (Units) Analysis, by Application, 2013H-2028F
Table 27: Latin America Label Applicators Market Value (US$ Mn) Analysis, by End Use, 2013H-2028F
Table 28: Latin America Label Applicators Market Volume (Units) Analysis, by End Use, 2013H-2028F
Table 29: Latin America Label Applicators Market Value (US$ Mn) Analysis, by Country, 2013H-2028F
Table 30: Latin America Label Applicators Market Volume (Units) Analysis, by Country, 2013H-2028F
Table 31: Western Europe Label Applicators Market Value (US$ Mn) Analysis, by Automation, 2013H-2028F
Table 32: Western Europe Label Applicators Market Volume (Units) Analysis, by Automation, 2013H-2028F
Table 33: Western Europe Label Applicators Market Value (US$ Mn) Analysis, by Speed, 2013H-2028F
Table 34: Western Europe Label Applicators Market Volume (Units) Analysis, by Speed, 2013H-2028F
Table 35: Western Europe Label Applicators Market Value (US$ Mn) Analysis, by Application, 2013H-2028F
Table 36: Western Europe Label Applicators Market Volume (Units) Analysis, by Application, 2013H-2028F
Table 37: Western Europe Label Applicators Market Value (US$ Mn) Analysis, by End Use, 2013H-2028F
Table 38: Western Europe Label Applicators Market Volume (Units) Analysis, by End Use, 2013H-2028F
Table 39: Western Europe Label Applicators Market Value (US$ Mn) Analysis, by Country, 2013H-2028F
Table 40: Western Europe Label Applicators Market Volume (Units) Analysis, by Country, 2013H-2028F
Table 41: Eastern Europe Label Applicators Market Value (US$ Mn) Analysis, by Automation, 2013H-2028F
Table 42: Eastern Europe Label Applicators Market Volume (Units) Analysis, by Automation, 2013H-2028F
Table 43: Eastern Europe Label Applicators Market Value (US$ Mn) Analysis, by Speed, 2013H-2028F
Table 44: Eastern Europe Label Applicators Market Volume (Units) Analysis, by Speed, 2013H-2028F
Table 45: Eastern Europe Label Applicators Market Value (US$ Mn) Analysis, by Application, 2013H-2028F
Table 46: Eastern Europe Label Applicators Market Volume (Units) Analysis, by Application, 2013H-2028F
Table 47: Eastern Europe Label Applicators Market Value (US$ Mn) Analysis, by End Use, 2013H-2028F
Table 48: Eastern Europe Label Applicators Market Volume (Units) Analysis, by End Use, 2013H-2028F
Table 49: Eastern Europe Label Applicators Market Value (US$ Mn) Analysis, by Country, 2013H-2028F
Table 50: Eastern Europe Label Applicators Market Volume (Units) Analysis, by Country, 2013H-2028F
Table 51: Asia Pacific excluding Japan Label Applicators Market Value (US$ Mn) Analysis, by Automation, 2013H-2028F
Table 52: Asia Pacific excluding Japan Label Applicators Market Volume (Units) Analysis, by Automation, 2013H-2028F
Table 53: Asia Pacific excluding Japan Label Applicators Market Value (US$ Mn) Analysis, by Speed, 2013H-2028F
Table 54: Asia Pacific excluding Japan Label Applicators Market Volume (Units) Analysis, by Speed, 2013H-2028F
Table 55: Asia Pacific excluding Japan Label Applicators Market Value (US$ Mn) Analysis, by Application, 2013H-2028F
Table 56: Asia Pacific excluding Japan Label Applicators Market Volume (Units) Analysis, by Application, 2013H-2028F
Table 57: Asia Pacific excluding Japan Label Applicators Market Value (US$ Mn) Analysis, by End Use, 2013H-2028F
Table 58: Asia Pacific excluding Japan Label Applicators Market Volume (Units) Analysis, by End Use, 2013H-2028F
Table 59: Asia Pacific excluding Japan Label Applicators Market Value (US$ Mn) Analysis, by Country, 2013H-2028F
Table 60: Asia Pacific excluding Japan Label Applicators Market Volume (Units) Analysis, by Country, 2013H-2028F
Table 61: Japan Label Applicators Market Value (US$ Mn) Analysis, by Automation, 2013H-2028F
Table 62: Japan Label Applicators Market Volume (Units) Analysis, by Automation, 2013H-2028F
Table 63: Japan Label Applicators Market Value (US$ Mn) Analysis, by Speed, 2013H-2028F
Table 64: Japan Label Applicators Market Volume (Units) Analysis, by Speed, 2013H-2028F
Table 65: Japan Label Applicators Market Value (US$ Mn) Analysis, by Application, 2013H-2028F
Table 66: Japan Label Applicators Market Volume (Units) Analysis, by Application, 2013H-2028F
Table 67: Japan Label Applicators Market Value (US$ Mn) Analysis, by End Use, 2013H-2028F
Table 68: Japan Label Applicators Market Volume (Units) Analysis, by End Use, 2013H-2028F
Table 69: Middle East and Africa Label Applicators Market Value (US$ Mn) Analysis, by Automation, 2013H-2028F
Table 70: Middle East and Africa Label Applicators Market Volume (Units) Analysis, by Automation, 2013H-2028F
Table 71: Middle East and Africa Label Applicators Market Value (US$ Mn) Analysis, by Speed, 2013H-2028F
Table 72: Middle East and Africa Label Applicators Market Volume (Units) Analysis, by Speed, 2013H-2028F
Table 73: Middle East and Africa Label Applicators Market Value (US$ Mn) Analysis, by Application, 2013H-2028F
Table 74: Middle East and Africa Label Applicators Market Volume (Units) Analysis, by Application, 2013H-2028F
Table 75: Middle East and Africa Label Applicators Market Value (US$ Mn) Analysis, by End Use, 2013H-2028F
Table 76: Middle East and Africa Label Applicators Market Volume (Units) Analysis, by End Use, 2013H-2028F
Table 77: Middle East and Africa Label Applicators Market Value (US$ Mn) Analysis, by Country, 2013H-2028F
Table 78: Middle East and Africa Label Applicators Market Volume (Units) Analysis, by Country, 2013H-2028F
Find your sweet spots for generating winning opportunities in this market.
Talk to AnalystFigure 01: Global Label Applicators Market Share Analysis by Automation, 2022E & 2028F
Figure 02: Global Label Applicators Market Y-o-Y Growth Analysis by Automation, 2019H-2028F
Figure 03: Global Label Applicators Market Attractiveness Analysis by Automation, 2022E-2028F
Figure 04: Global Label Applicators Market Share Analysis by Speed, 2022E & 2028F
Figure 05: Global Label Applicators Market Y-o-Y Growth Analysis by Speed, 2019H-2028F
Figure 06: Global Label Applicators Market Attractiveness Analysis by Speed, 2022E-2028F
Figure 07: Global Label Applicators Market Share Analysis by Application, 2022E & 2028F
Figure 08: Global Label Applicators Market Y-o-Y Growth Analysis by Application, 2019H-2028F
Figure 09: Global Label Applicators Market Attractiveness Analysis by Application, 2022E-2028F
Figure 10: Global Label Applicators Market Share Analysis by End Use, 2022E & 2028F
Figure 11: Global Label Applicators Market Y-o-Y Growth Analysis by End Use, 2019H-2028F
Figure 12: Global Label Applicators Market Attractiveness Analysis by End Use, 2022E-2028F
Figure 13: Global Label Applicators Market Share Analysis by Region, 2022E & 2028F
Figure 14: Global Label Applicators Market Y-o-Y Growth Analysis by Region, 2019H-2028F
Figure 15: Global Label Applicators Market Attractiveness Analysis by Region, 2022E-2028F
Figure 16: North America Label Applicators Market Share Analysis by Automation, 2022E & 2028F
Figure 17: North America Label Applicators Market Attractiveness Analysis by Speed, 2022E-2028F
Figure 18: North America Label Applicators Market Share Analysis by Application, 2022 (E)
Figure 19: North America Label Applicators Market Share Analysis by End Use, 2022 (E)
Figure 20: North America Label Applicators Market Value Share Analysis by Country 2022(E)
Figure 21: Latin America Label Applicators Market Share Analysis by Automation, 2022E & 2028F
Figure 22: Latin America Label Applicators Market Attractiveness Analysis by Speed, 2022E-2028F
Figure 23: Latin America Label Applicators Market Share Analysis by Application, 2022 (E)
Figure 24: Latin America Label Applicators Market Share Analysis by End Use, 2022 (E)
Figure 25: Latin America Label Applicators Market Value Share Analysis by Country 2022(E)
Figure 26: Western Europe Label Applicators Market Share Analysis by Automation, 2022E & 2028F
Figure 27: Western Europe Label Applicators Market Attractiveness Analysis by Speed, 2022E-2028F
Figure 28: Western Europe Label Applicators Market Share Analysis by Application, 2022 (E)
Figure 29: Western Europe Label Applicators Market Share Analysis by End Use, 2022 (E)
Figure 30: Western Europe Label Applicators Market Value Share Analysis by Country 2022(E)
Figure 31: Eastern Europe Label Applicators Market Share Analysis by Automation, 2022E & 2028F
Figure 32: Eastern Europe Label Applicators Market Attractiveness Analysis by Speed, 2022E-2028F
Figure 33: Eastern Europe Label Applicators Market Share Analysis by Application, 2022 (E)
Figure 34: Eastern Europe Label Applicators Market Share Analysis by End Use, 2022 (E)
Figure 35: Eastern Europe Label Applicators Market Value Share Analysis by Country 2022(E)
Figure 36: Asia Pacific excluding Japan Label Applicators Market Share Analysis by Automation, 2022E & 2028F
Figure 37: Asia Pacific excluding Japan Label Applicators Market Attractiveness Analysis by Speed, 2022E-2028F
Figure 38: Asia Pacific excluding Japan Label Applicators Market Share Analysis by Application, 2022 (E)
Figure 39: Asia Pacific excluding Japan Label Applicators Market Share Analysis by End Use, 2022 (E)
Figure 40: Asia Pacific excluding Japan Label Applicators Market Value Share Analysis by Country 2022(E)
Figure 41: Japan Label Applicators Market Share Analysis by Automation, 2022E & 2028F
Figure 42: Japan Label Applicators Market Attractiveness Analysis by Speed, 2022E-2028F
Figure 43: Japan Label Applicators Market Share Analysis by Application, 2022 (E)
Figure 44: Japan Label Applicators Market Share Analysis by End Use, 2022 (E)
Figure 45: Middle East and Africa Label Applicators Market Share Analysis by Automation, 2022E & 2028F
Figure 46: Middle East and Africa Label Applicators Market Attractiveness Analysis by Speed, 2022E-2028F
Figure 47: Middle East and Africa Label Applicators Market Share Analysis by Application, 2022 (E)
Figure 48: Middle East and Africa Label Applicators Market Share Analysis by End Use, 2022 (E)
Figure 49: Middle East and Africa Label Applicators Market Value Share Analysis by Country 2022(E)
Figure 50: U.S. Label Applicators Market Value Share Analysis, by Automation, 2022(E) & 2028(F)
Figure 51: U.S. Label Applicators Market Value Share Analysis, by Speed, 2022(E)
Figure 52: U.S. Label Applicators Market Value Share Analysis, by Application, 2022(E) & 2028(F)
Figure 53: U.S. Label Applicators Market Value Share Analysis, by End Use, 2022(E)
Figure 54: Canada Label Applicators Market Value Share Analysis, by Automation, 2022(E) & 2028(F)
Figure 55: Canada Label Applicators Market Value Share Analysis, by Speed, 2022(E)
Figure 56: Canada Label Applicators Market Value Share Analysis, by Application, 2022(E) & 2028(F)
Figure 57: Canada Label Applicators Market Value Share Analysis, by End Use, 2022(E)
Figure 58: Brazil Label Applicators Market Value Share Analysis, by Automation, 2022(E) & 2028(F)
Figure 59: Brazil Label Applicators Market Value Share Analysis, by Speed, 2022(E)
Figure 60: Brazil Label Applicators Market Value Share Analysis, by Application, 2022(E) & 2028(F)
Figure 61: Brazil Label Applicators Market Value Share Analysis, by End Use, 2022(E)
Figure 62: Mexico Label Applicators Market Value Share Analysis, by Automation, 2022(E) & 2028(F)
Figure 63: Mexico Label Applicators Market Value Share Analysis, by Speed, 2022(E)
Figure 64: Mexico Label Applicators Market Value Share Analysis, by Application, 2022(E) & 2028(F)
Figure 65: Mexico Label Applicators Market Value Share Analysis, by End Use, 2022(E)
Figure 66: Germany Label Applicators Market Value Share Analysis, by Automation, 2022(E) & 2028(F)
Figure 67: Germany Label Applicators Market Value Share Analysis, by Speed, 2022(E)
Figure 68: Germany Label Applicators Market Value Share Analysis, by Application, 2022(E) & 2028(F)
Figure 69: Germany Label Applicators Market Value Share Analysis, by End Use, 2022(E)
Figure 70: Spain Label Applicators Market Value Share Analysis, by Automation, 2022(E) & 2028(F)
Figure 71: Spain Label Applicators Market Value Share Analysis, by Speed, 2022(E)
Figure 72: Spain Label Applicators Market Value Share Analysis, by Application, 2022(E) & 2028(F)
Figure 73: Spain Label Applicators Market Value Share Analysis, by End Use, 2022(E)
Figure 74: Italy Label Applicators Market Value Share Analysis, by Automation, 2022(E) & 2028(F)
Figure 75: Italy Label Applicators Market Value Share Analysis, by Speed, 2022(E)
Figure 76: Italy Label Applicators Market Value Share Analysis, by Application, 2022(E) & 2028(F)
Figure 77: Italy Label Applicators Market Value Share Analysis, by End Use, 2022(E)
Figure 78: France Label Applicators Market Value Share Analysis, by Automation, 2022(E) & 2028(F)
Figure 79: France Label Applicators Market Value Share Analysis, by Speed, 2022(E)
Figure 80: France Label Applicators Market Value Share Analysis, by Application, 2022(E) & 2028(F)
Figure 81: France Label Applicators Market Value Share Analysis, by End Use, 2022(E)
Figure 82: U.K. Label Applicators Market Value Share Analysis, by Automation, 2022(E) & 2028(F)
Figure 83: U.K. Label Applicators Market Value Share Analysis, by Speed, 2022(E)
Figure 84: U.K. Label Applicators Market Value Share Analysis, by Application, 2022(E) & 2028(F)
Figure 85: U.K. Label Applicators Market Value Share Analysis, by End Use, 2022(E)
Figure 86: Russia Label Applicators Market Value Share Analysis, by Automation, 2022(E) & 2028(F)
Figure 87: Russia Label Applicators Market Value Share Analysis, by Speed, 2022(E)
Figure 88: Russia Label Applicators Market Value Share Analysis, by Application, 2022(E) & 2028(F)
Figure 89: Russia Label Applicators Market Value Share Analysis, by End Use, 2022(E)
Figure 90: China Label Applicators Market Value Share Analysis, by Automation, 2022(E) & 2028(F)
Figure 91: China Label Applicators Market Value Share Analysis, by Speed, 2022(E)
Figure 92: China Label Applicators Market Value Share Analysis, by Application, 2022(E) & 2028(F)
Figure 93: China Label Applicators Market Value Share Analysis, by End Use, 2022(E)
Figure 94: India Label Applicators Market Value Share Analysis, by Automation, 2022(E) & 2028(F)
Figure 95: India Label Applicators Market Value Share Analysis, by Speed, 2022(E)
Figure 96: India Label Applicators Market Value Share Analysis, by Application, 2022(E) & 2028(F)
Figure 97: India Label Applicators Market Value Share Analysis, by End Use, 2022(E)
Figure 98: Australia & New Zealand Label Applicators Market Value Share Analysis, by Automation, 2022(E) & 2028(F)
Figure 99: Australia & New Zealand Label Applicators Market Value Share Analysis, by Speed, 2022(E)
Figure 100: Australia & New Zealand Label Applicators Market Value Share Analysis, by Application, 2022(E) & 2028(F)
Figure 101: Australia & New Zealand Label Applicators Market Value Share Analysis, by End Use, 2022(E)
Figure 102: GCC Countries Label Applicators Market Value Share Analysis, by Automation, 2022(E) & 2028(F)
Figure 103: GCC Countries Label Applicators Market Value Share Analysis, by Speed, 2022(E)
Figure 104: GCC Countries Label Applicators Market Value Share Analysis, by Application, 2022(E) & 2028(F)
Figure 105: GCC Countries Label Applicators Market Value Share Analysis, by End Use, 2022(E)
Figure 106: South Africa Label Applicators Market Value Share Analysis, by Automation, 2022(E) & 2028(F)
Figure 107: South Africa Label Applicators Market Value Share Analysis, by Speed, 2022(E)
Figure 108: South Africa Label Applicators Market Value Share Analysis, by Application, 2022(E) & 2028(F)
Figure 109: South Africa Label Applicators Market Value Share Analysis, by End Use, 2022(E)
Need specific information?
Request CustomizationExplore Packaging Insights
View Reports