Labelling Machine Market Size and Share Forecast Outlook 2025 to 2035

The labelling machine market is projected to grow from USD 12.1 billion in 2025 to USD 16.7 billion by 2035, registering a CAGR of 3.3% during the forecast period.
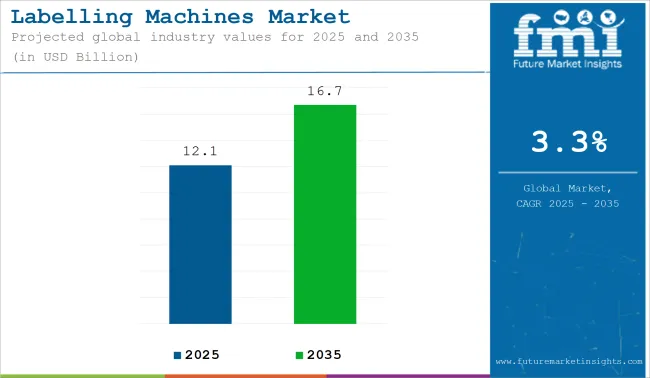
Labelling Machines Market Industry Value Analysis

Attributes Key Insights
Historical Size, 2024 USD 11.9 billion
Estimated Size, 2025 USD 12.1 billion
Projected Size, 2035 USD 16.7 billion
Value-based CAGR (2025 to 2035) 3.3%

Sales in 2024 reached USD 11.7 billion, reflecting consistent demand across food & beverage, pharmaceutical, and personal care industries. Market growth has been driven by the need for high-speed, accurate, and automated labelling solutions to meet regulatory and branding requirements.

Expansion of e-commerce and retail logistics has supported the integration of flexible labelling systems. Technological improvements in label placement precision, touchless operation, and machine learning-assisted controls have been adopted to enhance production reliability.

In May 2024, Herma demonstrated new ways of label-based marking of chemical and pharmaceutical products at ACHEMA. "Our customers benefit from the fact that we are probably a unique system provider in the industry," emphasizes HERMA Key Account Manager Sven Pleier. "HERMA not only produces the labels, but also develops and produces the self-adhesive material itself.

This enables HERMA to respond to individual challenges in a targeted manner. And as a leading specialist for label applicators and labelling machines, HERMA also knows how labels need to be made so that they can be reliably dispensed, even in high-speed systems." The latest example of this is the new HERMA PE White UV Laser film labels, which can be printed using UV lasers with a simple color change in the label material.

A growing emphasis has been placed on reducing the environmental impact of labelling operations. Manufacturers are investing in all-electric labelling systems, recyclable liner materials, and energy-efficient servo motors to reduce carbon footprint during operation. Digital labelling solutions and on-demand variable data printing have been introduced to minimize label wastage.

Integration of cloud-based control systems is enabling real-time performance monitoring and preventive maintenance scheduling. New systems are being designed for compatibility with biodegradable or compostable label substrates. These innovations align with sustainability mandates while improving operational uptime, especially in fast-moving consumer goods (FMCG) and pharma production environments. The market is being steered toward greener compliance with evolving waste-reduction frameworks.

A projected increase in the adoption of inline labelling for e-commerce, cold-chain, and cleanroom environments is expected to unlock incremental market opportunities. Manufacturers are anticipated to integrate AI-enabled vision systems and IoT connectivity to support end-user demands for intelligent maintenance and downtime prediction. Strong competition among mid-sized OEMs is likely to drive price competitiveness, feature bundling, and localization strategies, particularly in emerging Asian and Eastern European markets.

In the technology segment, labelling machine solutions with a pressure-sensitive technology are likely to account for over 43% of the market share over the forecast period. This technology is dominating the labelling market because it is flexible, economical, and can be easily applied.

Most often, it is used on products such as bottles and jars because it doesn't need much pressure to adhere. Because of this, pressure-sensitive films are highly used for high-speed production lines in food, beverage, and consumer goods, holding a large portion of the market share.

The labelling machine market will grow with profitable prospects in the forecast period, as it is expected to offer an incremental opportunity of USD 2.8 billion and will increase 1.5 times the existing value by 2035.

Semi Annual Market Update

The below table presents the expected CAGR for the global labelling machine market over several semi-annual periods spanning from 2025 to 2035.

Particular Value CAGR
H1 (2024 to 2034) 3.4%
H2 (2024 to 2034) 3.8%
H1 (2025 to 2035) 2.7%
H2 (2025 to 2035) 4.5%

In the first half (H1) of the decade from 2024 to 2033, the business is predicted to surge at a CAGR of 3.4%, followed by a slightly higher growth rate of 3.8% in the second half (H2) of the same decade. Moving into the subsequent period, from H1 2025 to H2 2035, the CAGR is projected to decrease slightly to 2.7% in the first half and remain relatively moderate at 4.5% in the second half. In the first half (H1) the market witnessed a decrease of 70 BPS while in the second half (H2), the market witnessed an increase of 70 BPS.

Analyzing Labelling Machines Market by Top Investment Segment

The market is segmented based on technology, machine type, end use, and region. By technology, the market includes pressure sensitive technology, glue-based technology, heat-shrink technology, laser marking technology, and others. In terms of machine type, the market is categorized into automatic labelling machines, semi-automatic labelling machines, and manual labelling machines.

By end use, the market comprises food & beverages, pharmaceuticals & healthcare, cosmetics & personal care, industrial & chemicals, logistics & warehousing, and retail & consumer goods. Regionally, the market is analyzed across North America, Latin America, East Asia, South Asia & Pacific, Eastern Europe, Western Europe, Oceania, and the Middle East & Africa.
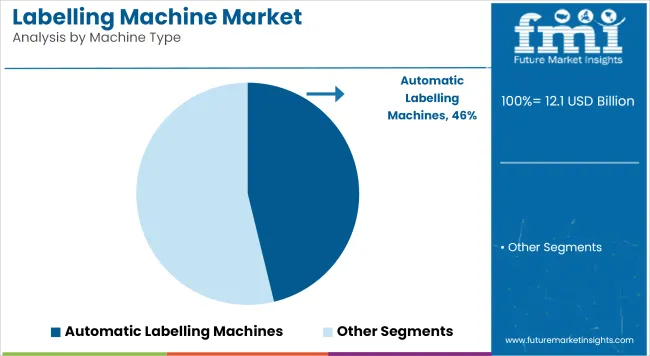
Automation Preferred for Efficiency, Speed, and Scalability

Labelling Machine Market Analysis By Machine Type

Automatic labelling machines have been projected to account for 46.2% of the global labelling machine market by 2025, owing to their ability to deliver consistent, high-speed application with minimal human intervention. Integration into high-volume production lines has been prioritized to reduce bottlenecks and maintain throughput in packaging environments.

Barcode, batch code, and multi-panel label applications have been streamlined using these machines, particularly in sectors requiring traceability and compliance. Increased adoption of smart sensors and servo-driven systems has enabled improved accuracy and flexibility across diverse container types.

Operational downtime has been minimized through auto-adjustment, label roll change detection, and advanced user interfaces, which have been deployed to facilitate seamless line changeovers. Automatic machines have also been chosen for their ability to support serialization in pharmaceutical and food manufacturing.

The demand for end-to-end automated packaging workflows has driven investments in labeling automation across emerging markets. Industry 4.0 compatibility and real-time production data integration have positioned automatic machines as critical infrastructure in smart factories.
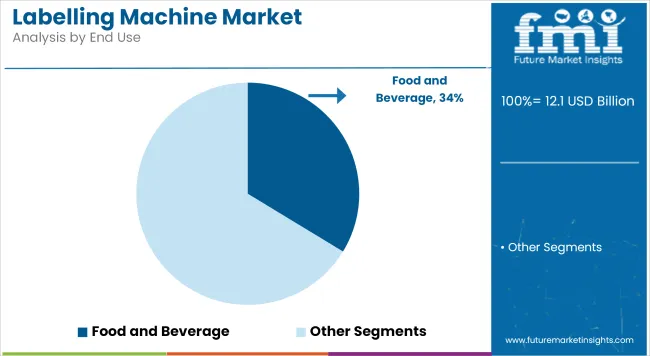
Food and Beverage Applications Driven by High-Volume Branding and Compliance

Labelling Machine Market Analysis By End Use

The food and beverage sector has been estimated to contribute 33.7% of the global demand for labelling machines in 2025, attributed to the sector’s need for high-volume, visually impactful, and regulation-compliant labelling. Nutrition facts, barcodes, tamper-evidence, and branding have all been consistently applied at scale in automated packaging environments.

Self-adhesive, wrap-around, and sleeve labels have been frequently applied across bottle, jar, and pouch formats in this sector. Consistency in label placement and print clarity has been maintained through advanced inspection and control systems integrated into labelling machines.

Frequent SKU changes and seasonal product launches have necessitated flexible machines that accommodate label type and size variation. Hygienic design standards and wash-down-compatible labelers have been widely adopted in dairy, meat, and beverage processing lines.

With increasing consumer demand for transparency and brand storytelling, labelling has emerged as a key point of differentiation in food and beverage packaging. Investments in high-speed, multi-line labelling systems are expected to continue as the sector expands into Omni channel retail and export markets.

Key Industry Highlights

Automation and Efficiency Accelerate the Growth of Labelling Machines

The trend of automation and efficiency of labelling machines is speeding the labelling process, making it more accurate and less labor-intensive. Automated labelling machines can apply labels on products at high speeds and consistently without requiring human workers to handle each item. This speeds up production and reduces error rates because labels will be correctly applied every time.

These machines can work continuously without breaks, which increases productivity in general. Labor costs are also reduced because fewer workers are required to run the machines. It has become one of the basic needs of companies nowadays as they work towards increasing their efficiency and thus becoming competitive in the market.

Technological Advancement Boosts the Market Growth

Labelling systems which are smart include track-and-trace, QR codes, and RFID tags make labelling much more accurate, and companies better manage their inventories. Improved correctness of labels due to advanced sensors and better data analytics support high-quality prints.

Eco-friendly technologies, from sustainable inks to energy-efficiency machines, help companies reduce their environmental hazards and meet the guidelines set by related authorities. Such sectors include food, beverages, pharmaceutical industries, and home products with a surge due to high demand, for which labeling techniques are quicker and more inexpensive while entirely flexible.

Competition from Manual Labor May Reduce the Market Growth

Many businesses will outsource labelling labor; it only costs a bit in the starting amount for a low-budget start-up or a business. Certain companies with automatic labelling, high speed, and accuracy, but even so some tend to have an individual do this little batch order while others also depend on when flexibilities come their way. Workers can easily switch between different product types and label designs, which can be harder for machines to adjust to without reconfiguration.

It delays the full-fledged integration of automated labelling machines since they mostly rely on hand labor in a market. Here, despite their potential advantages in automaticity, business people would hardly consider change, taking into consideration their initial and additional charges of training compared to those manually done.

Market Concentration

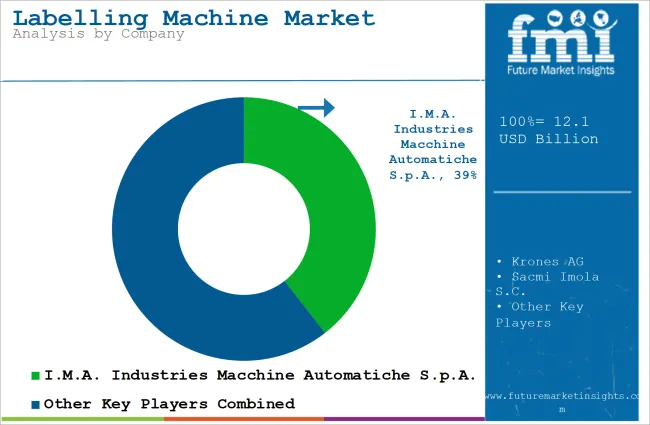
Tier 1 companies comprise market leaders with significant market share in global market. These market leaders are characterized by high production capacity and a wide product portfolio. These market leaders are distinguished by their extensive expertise in manufacturing across multiple packaging formats and a broad geographical reach, underpinned by a robust consumer base. They provide a wide range of series including recycling and manufacturing utilizing the latest technology and meeting the regulatory standards providing the highest quality. Prominent companies within tier 1 include I.M.A. Industries Macchine Automatiche S.p.A., Krones AG, Sacmi Imola S.C., Sato

Tier 2 companies include mid-size players having presence in specific regions and highly influencing the local market. These are characterized by a strong presence overseas and strong market knowledge. These market players have good technology and ensure regulatory compliance but may not have advanced technology and wide global reach. Prominent companies in tier 2 include ProMach Inc., Quadrel Labelling System, Domino Printech India LLP

Barry-Wehmiller Group Inc Tier 3 includes the majority of small-scale companies operating at the local presence and serving niche markets. These companies are notably oriented towards fulfilling local market demands and are consequently classified within the tier 3 share segment. They are small-scale players and have limited geographical reach. Tier 3, within this context, is recognized as an unorganized market, denoting a sector characterized by a lack of extensive structure and formalization when compared to organized competitors.

Country-wise Insights

The section below covers the future forecast for the labelling machine market in terms of countries. Information on key countries in several parts of the globe, including North America, Latin America, East Asia, South Asia and Pacific, Western Europe, Eastern Europe and MEA is provided. US is anticipated to remain at the forefront in North America, with a CAGR of 3.6% through 2035. In Europe, Spain is projected to witness a CAGR 3.1% by 2035.
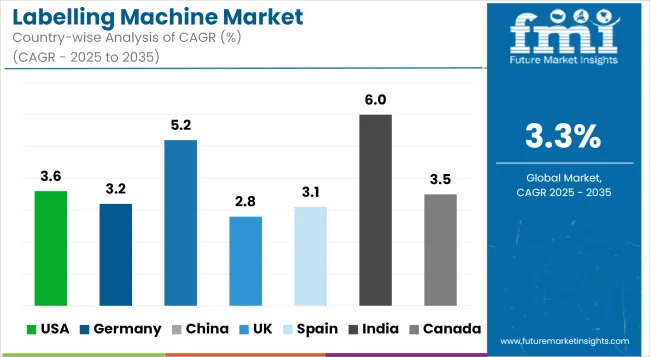
Labelling Machine Market Cagr Analysis By Country

Countries Value CAGR (2025 to 2035)
USA 3.6%
Germany 3.2%
China 5.2%
UK 2.8%
Spain 3.1%
India 6.0%
Canada 3.5%

Advanced Technology in Labelling Machine Pushes the Market Growth in Germany

Smart technology improves the efficiency and accuracy of the product in its production. Smart technology integration has therefore boosted the labelling machine market in Germany. Industries, such as manufacturing and packaging, have seen the uptake of advanced technologies, including sensors, RFID, and IoT, for the bettering of labelling processes. With sensors, labelling machines can identify an incorrectly applied label and automatically correct it, reducing error and waste.

RFID technology helps to track the product and to improve inventory management. It also ensures that the right product gets to the right place. Integration of IoT helps companies monitor and control machines remotely. This allows companies to avoid having people at the site and thus saves on downtime.

Sustainability Propel Boost the Demand in UK

Growing environmental awareness in the UK along with stringent regulations imposed by the government is giving a strong push to sustainable labelling solutions in terms of fast pace demand. With single-use plastic targets, as well as an ambitious recycling rate, set by the UK government, companies are focusing on adopting environmentally friendly packaging materials such as recyclable labels, and these businesses need efficient labelling machines to accommodate the same.

Also, with awareness related to sustainability of consumers in the UK, more are choosing those brands that support the cause of sustainability. This, therefore, means the behavior of the consumer is now raising the stakes for brands in investing in sustainable labelling, thus propelling further demand for machines that can support such eco-friendly practices.

Competitive Landscape

Key players of labelling machine industry are developing and launching new products in the market. They are integrating with different firms and extending their geographical presence. Few of them are also collaborating and partnering with local brands and start-up companies for new product development.

Key Developments in Labelling Machine Market
  • In January 2025, The Mx350i-eP is a new electrically driven pallet labeler from Domino's Mx-Series. It has a number of clever technological improvements that make it safer to operate and more efficient while using less energy and air than conventional pneumatic technology.
  • In October 2024, SATO launched its LR4NX Series print and apply labelling machines in Europe. It is easy to install, lightweight and it has low initial cost.

Key Players in Labelling Machine Market

  • I.M.A. Industries Macchine Automatiche S.p.A.
  • Krones AG
  • Sacmi Imola S.C.
  • Sato
  • ProMach Inc.
  • Quadrel Labelling System
  • Domino Printech India LLP
  • Barry-Wehmiller Group Inc.
  • Tetra Leval International S.A.
  • Fuji Seal International Inc.
  • Accurek Packaging
  • Equipment Companies Inc.

Labelling Machine Market Analysis By Company

Labelling Machine Market Segmentation

By Technology:

  • Pressure Sensitive technology
  • Glue-Based technology
  • Heat-shrink technology
  • Laser marking technology
  • Others

By Machine Type:

  • Automatic Labelling Machines
  • Semi-Automatic Labelling Machines
  • Manual Labelling Machines

By End Use:

  • Food & Beverages
  • Pharmaceuticals & Healthcare
  • Cosmetics & Personal Care
  • Industrial & Chemicals
  • Logistics & Warehousing
  • Retail & Consumer Goods

By Region:

  • North America
  • Latin America
  • East Asia
  • South Asia & Pacific
  • Eastern Europe
  • Western Europe
  • Oceania
  • Middle East & Africa

Table of Content

  1. Executive Summary
    • Global Market Outlook
    • Demand-side Trends
    • Supply-side Trends
    • Technology Roadmap Analysis
    • Analysis and Recommendations
  2. Market Overview
    • Market Coverage / Taxonomy
    • Market Definition / Scope / Limitations
  3. Market Background
    • Market Dynamics
      • Drivers
      • Restraints
      • Opportunity
      • Trends
    • Scenario Forecast
      • Demand in Optimistic Scenario
      • Demand in Likely Scenario
      • Demand in Conservative Scenario
    • Opportunity Map Analysis
    • Product Life Cycle Analysis
    • Supply Chain Analysis
      • Supply Side Participants and their Roles
        • Producers
        • Mid-Level Participants (Traders/ Agents/ Brokers)
        • Wholesalers and Distributors
      • Value Added and Value Created at Node in the Supply Chain
      • List of Raw Material Suppliers
      • List of Existing and Potential Buyer’s
    • Investment Feasibility Matrix
    • Value Chain Analysis
      • Profit Margin Analysis
      • Wholesalers and Distributors
      • Retailers
    • PESTLE and Porter’s Analysis
    • Regulatory Landscape
      • By Key Regions
      • By Key Countries
    • Regional Parent Market Outlook
    • Production and Consumption Statistics
    • Import and Export Statistics
  4. Global Market Analysis 2020-2024 and Forecast, 2025-2035
    • Historical Market Size Value (USD Million) & Volume (Units) Analysis, 2020-2024
    • Current and Future Market Size Value (USD Million) & Volume (Units) Projections, 2025-2035
      • Y-o-Y Growth Trend Analysis
      • Absolute $ Opportunity Analysis
  5. Global Market Analysis 2020-2024 and Forecast 2025-2035, By Technology
    • Introduction / Key Findings
    • Historical Market Size Value (USD Million) & Volume (Units) Analysis By Technology, 2020-2024
    • Current and Future Market Size Value (USD Million) & Volume (Units) Analysis and Forecast By Technology, 2025-2035
      • Pressure Sensitive technology
      • Glue-Based technology
      • Heat-shrink technology
      • Laser marking technology
      • Others
    • Y-o-Y Growth Trend Analysis By Technology, 2020-2024
    • Absolute $ Opportunity Analysis By Technology, 2025-2035
  6. Global Market Analysis 2020-2024 and Forecast 2025-2035, By Machine Type
    • Introduction / Key Findings
    • Historical Market Size Value (USD Million) & Volume (Units) Analysis By Machine Type, 2020-2024
    • Current and Future Market Size Value (USD Million) & Volume (Units) Analysis and Forecast By Machine Type, 2025-2035
      • Automatic Labelling Machines
      • Semi-Automatic Labelling Machines
      • Manual Labelling Machines
    • Y-o-Y Growth Trend Analysis By Machine Type, 2020-2024
    • Absolute $ Opportunity Analysis By Machine Type, 2025-2035
  7. Global Market Analysis 2020-2024 and Forecast 2025-2035, By End Use
    • Introduction / Key Findings
    • Historical Market Size Value (USD Million) & Volume (Units) Analysis By End Use, 2020-2024
    • Current and Future Market Size Value (USD Million) & Volume (Units) Analysis and Forecast By End Use, 2025-2035
      • Food & Beverages
      • Pharmaceuticals & Healthcare
      • Cosmetics & Personal Care
      • Industrial & Chemicals
      • Logistics & Warehousing
      • Retail & Consumer Goods
    • Y-o-Y Growth Trend Analysis By End Use, 2020-2024
    • Absolute $ Opportunity Analysis By End Use, 2025-2035
  8. Global Market Analysis 2020-2024 and Forecast 2025-2035, By Region
    • Introduction
    • Historical Market Size Value (USD Million) & Volume (Units) Analysis By Region, 2020-2024
    • Current Market Size Value (USD Million) & Volume (Units) Analysis and Forecast By Region, 2025-2035
      • North America
      • Latin America
      • Europe
      • East Asia
      • South Asia
      • Oceania
      • MEA
    • Market Attractiveness Analysis By Region
  9. North America Market Analysis 2020-2024 and Forecast 2025-2035, By Country
    • Historical Market Size Value (USD Million) & Volume (Units) Trend Analysis By Market Taxonomy, 2020-2024
    • Market Size Value (USD Million) & Volume (Units) Forecast By Market Taxonomy, 2025-2035
      • By Country
        • USA
        • Canada
      • By Technology
      • By Machine Type
      • By End Use
    • Market Attractiveness Analysis
      • By Country
      • By Technology
      • By Machine Type
      • By End Use
    • Key Takeaways
  10. Latin America Market Analysis 2020-2024 and Forecast 2025-2035, By Country
    • Historical Market Size Value (USD Million) & Volume (Units) Trend Analysis By Market Taxonomy, 2020-2024
    • Market Size Value (USD Million) & Volume (Units) Forecast By Market Taxonomy, 2025-2035
      • By Country
        • Brazil
        • Mexico
        • Argentina
        • Chile
        • Peru
        • Rest of Latin America
      • By Technology
      • By Machine Type
      • By End Use
    • Market Attractiveness Analysis
      • By Country
      • By Technology
      • By Machine Type
      • By End Use
    • Key Takeaways
  11. Europe Market Analysis 2020-2024 and Forecast 2025-2035, By Country
    • Historical Market Size Value (USD Million) & Volume (Units) Trend Analysis By Market Taxonomy, 2020-2024
    • Market Size Value (USD Million) & Volume (Units) Forecast By Market Taxonomy, 2025-2035
      • By Country
        • Germany
        • Italy
        • France
        • UK
        • Spain
        • Russia
        • BENELUX
        • Rest of Europe
      • By Technology
      • By Machine Type
      • By End Use
    • Market Attractiveness Analysis
      • By Country
      • By Technology
      • By Machine Type
      • By End Use
    • Key Takeaways
  12. East Asia Market Analysis 2020-2024 and Forecast 2025-2035, By Country
    • Historical Market Size Value (USD Million) & Volume (Units) Trend Analysis By Market Taxonomy, 2020-2024
    • Market Size Value (USD Million) & Volume (Units) Forecast By Market Taxonomy, 2025-2035
      • By Country
        • China
        • Japan
        • South Korea
      • By Technology
      • By Machine Type
      • By End Use
    • Market Attractiveness Analysis
      • By Country
      • By Technology
      • By Machine Type
      • By End Use
    • Key Takeaways
  13. South Asia Market Analysis 2020-2024 and Forecast 2025-2035, By Country
    • Historical Market Size Value (USD Million) & Volume (Units) Trend Analysis By Market Taxonomy, 2020-2024
    • Market Size Value (USD Million) & Volume (Units) Forecast By Market Taxonomy, 2025-2035
      • By Country
        • India
        • Thailand
        • Malaysia
        • Indonesia
        • Rest of South Asia
      • By Technology
      • By Machine Type
      • By End Use
    • Market Attractiveness Analysis
      • By Country
      • By Technology
      • By Machine Type
      • By End Use
    • Key Takeaways
  14. Oceania Market Analysis 2020-2024 and Forecast 2025-2035, By Country
    • Historical Market Size Value (USD Million) & Volume (Units) Trend Analysis By Market Taxonomy, 2020-2024
    • Market Size Value (USD Million) & Volume (Units) Forecast By Market Taxonomy, 2025-2035
      • By Country
        • Australia
        • New Zealand
      • By Technology
      • By Machine Type
      • By End Use
    • Market Attractiveness Analysis
      • By Country
      • By Technology
      • By Machine Type
      • By End Use
    • Key Takeaways
  15. MEA Market Analysis 2020-2024 and Forecast 2025-2035, By Country
    • Historical Market Size Value (USD Million) & Volume (Units) Trend Analysis By Market Taxonomy, 2020-2024
    • Market Size Value (USD Million) & Volume (Units) Forecast By Market Taxonomy, 2025-2035
      • By Country
        • GCC
        • Rest of MEA
      • By Technology
      • By Machine Type
      • By End Use
    • Market Attractiveness Analysis
      • By Country
      • By Technology
      • By Machine Type
      • By End Use
    • Key Takeaways
  16. Key Countries Market Analysis
    • USA
      • Pricing Analysis
      • Market Share Analysis, 2024
        • By Technology
        • By Machine Type
        • By End Use
    • Canada
      • Pricing Analysis
      • Market Share Analysis, 2024
        • By Technology
        • By Machine Type
        • By End Use
    • Brazil
      • Pricing Analysis
      • Market Share Analysis, 2024
        • By Technology
        • By Machine Type
        • By End Use
    • Mexico
      • Pricing Analysis
      • Market Share Analysis, 2024
        • By Technology
        • By Machine Type
        • By End Use
    • Argentina
      • Pricing Analysis
      • Market Share Analysis, 2024
        • By Technology
        • By Machine Type
        • By End Use
  17. Market Structure Analysis
    • Competition Dashboard
    • Competition Benchmarking
    • Market Share Analysis of Top Players
      • By Regional
      • By Technology
      • By Machine Type
      • By End Use
  18. Competition Analysis
    • Competition Deep Dive
      • I.M.A. Industries Macchine Automatiche S.p.A.
        • Overview
        • Product Portfolio
        • Profitability by Market Segments (Product/Age /Sales Channel/Region)
        • Sales Footprint
        • Strategy Overview
          • Marketing Strategy
          • Product Strategy
          • Channel Strategy
      • Krones AG
        • Overview
        • Product Portfolio
        • Profitability by Market Segments (Product/Age /Sales Channel/Region)
        • Sales Footprint
        • Strategy Overview
          • Marketing Strategy
          • Product Strategy
          • Channel Strategy
      • Sacmi Imola S.C.
        • Overview
        • Product Portfolio
        • Profitability by Market Segments (Product/Age /Sales Channel/Region)
        • Sales Footprint
        • Strategy Overview
          • Marketing Strategy
          • Product Strategy
          • Channel Strategy
      • Sato
        • Overview
        • Product Portfolio
        • Profitability by Market Segments (Product/Age /Sales Channel/Region)
        • Sales Footprint
        • Strategy Overview
          • Marketing Strategy
          • Product Strategy
          • Channel Strategy
      • ProMach Inc.
        • Overview
        • Product Portfolio
        • Profitability by Market Segments (Product/Age /Sales Channel/Region)
        • Sales Footprint
        • Strategy Overview
          • Marketing Strategy
          • Product Strategy
          • Channel Strategy
      • Quadrel Labelling System
        • Overview
        • Product Portfolio
        • Profitability by Market Segments (Product/Age /Sales Channel/Region)
        • Sales Footprint
        • Strategy Overview
          • Marketing Strategy
          • Product Strategy
          • Channel Strategy
      • Accurek Packaging
        • Overview
        • Product Portfolio
        • Profitability by Market Segments (Product/Age /Sales Channel/Region)
        • Sales Footprint
        • Strategy Overview
          • Marketing Strategy
          • Product Strategy
          • Channel Strategy
      • Barry-Wehmiller Group Inc.
        • Overview
        • Product Portfolio
        • Profitability by Market Segments (Product/Age /Sales Channel/Region)
        • Sales Footprint
        • Strategy Overview
          • Marketing Strategy
          • Product Strategy
          • Channel Strategy
      • Tetra Leval International S.A.
        • Overview
        • Product Portfolio
        • Profitability by Market Segments (Product/Age /Sales Channel/Region)
        • Sales Footprint
        • Strategy Overview
          • Marketing Strategy
          • Product Strategy
          • Channel Strategy
      • Fuji Seal International Inc.
        • Overview
        • Product Portfolio
        • Profitability by Market Segments (Product/Age /Sales Channel/Region)
        • Sales Footprint
        • Strategy Overview
          • Marketing Strategy
          • Product Strategy
          • Channel Strategy
  19. Assumptions & Acronyms Used
  20. Research Methodology

List of Tables

  • Table 1: Global Market Value (USD Million) Forecast by Region, 2020-2035
  • Table 2: Global Market Volume (Units) Forecast by Region, 2020-2035
  • Table 3: Global Market Value (USD Million) Forecast by Technology, 2020-2035
  • Table 4: Global Market Volume (Units) Forecast by Technology, 2020-2035
  • Table 5: Global Market Value (USD Million) Forecast by Machine Type, 2020-2035
  • Table 6: Global Market Volume (Units) Forecast by Machine Type, 2020-2035
  • Table 7: Global Market Value (USD Million) Forecast by End Use, 2020-2035
  • Table 8: Global Market Volume (Units) Forecast by End Use, 2020-2035
  • Table 9: North America Market Value (USD Million) Forecast by Country, 2020-2035
  • Table 10: North America Market Volume (Units) Forecast by Country, 2020-2035
  • Table 11: North America Market Value (USD Million) Forecast by Technology, 2020-2035
  • Table 12: North America Market Volume (Units) Forecast by Technology, 2020-2035
  • Table 13: North America Market Value (USD Million) Forecast by Machine Type, 2020-2035
  • Table 14: North America Market Volume (Units) Forecast by Machine Type, 2020-2035
  • Table 15: North America Market Value (USD Million) Forecast by End Use, 2020-2035
  • Table 16: North America Market Volume (Units) Forecast by End Use, 2020-2035
  • Table 17: Latin America Market Value (USD Million) Forecast by Country, 2020-2035
  • Table 18: Latin America Market Volume (Units) Forecast by Country, 2020-2035
  • Table 19: Latin America Market Value (USD Million) Forecast by Technology, 2020-2035
  • Table 20: Latin America Market Volume (Units) Forecast by Technology, 2020-2035
  • Table 21: Latin America Market Value (USD Million) Forecast by Machine Type, 2020-2035
  • Table 22: Latin America Market Volume (Units) Forecast by Machine Type, 2020-2035
  • Table 23: Latin America Market Value (USD Million) Forecast by End Use, 2020-2035
  • Table 24: Latin America Market Volume (Units) Forecast by End Use, 2020-2035
  • Table 25: Europe Market Value (USD Million) Forecast by Country, 2020-2035
  • Table 26: Europe Market Volume (Units) Forecast by Country, 2020-2035
  • Table 27: Europe Market Value (USD Million) Forecast by Technology, 2020-2035
  • Table 28: Europe Market Volume (Units) Forecast by Technology, 2020-2035
  • Table 29: Europe Market Value (USD Million) Forecast by Machine Type, 2020-2035
  • Table 30: Europe Market Volume (Units) Forecast by Machine Type, 2020-2035
  • Table 31: Europe Market Value (USD Million) Forecast by End Use, 2020-2035
  • Table 32: Europe Market Volume (Units) Forecast by End Use, 2020-2035
  • Table 33: East Asia Market Value (USD Million) Forecast by Country, 2020-2035
  • Table 34: East Asia Market Volume (Units) Forecast by Country, 2020-2035
  • Table 35: East Asia Market Value (USD Million) Forecast by Technology, 2020-2035
  • Table 36: East Asia Market Volume (Units) Forecast by Technology, 2020-2035
  • Table 37: East Asia Market Value (USD Million) Forecast by Machine Type, 2020-2035
  • Table 38: East Asia Market Volume (Units) Forecast by Machine Type, 2020-2035
  • Table 39: East Asia Market Value (USD Million) Forecast by End Use, 2020-2035
  • Table 40: East Asia Market Volume (Units) Forecast by End Use, 2020-2035
  • Table 41: South Asia Market Value (USD Million) Forecast by Country, 2020-2035
  • Table 42: South Asia Market Volume (Units) Forecast by Country, 2020-2035
  • Table 43: South Asia Market Value (USD Million) Forecast by Technology, 2020-2035
  • Table 44: South Asia Market Volume (Units) Forecast by Technology, 2020-2035
  • Table 45: South Asia Market Value (USD Million) Forecast by Machine Type, 2020-2035
  • Table 46: South Asia Market Volume (Units) Forecast by Machine Type, 2020-2035
  • Table 47: South Asia Market Value (USD Million) Forecast by End Use, 2020-2035
  • Table 48: South Asia Market Volume (Units) Forecast by End Use, 2020-2035
  • Table 49: Oceania Market Value (USD Million) Forecast by Country, 2020-2035
  • Table 50: Oceania Market Volume (Units) Forecast by Country, 2020-2035
  • Table 51: Oceania Market Value (USD Million) Forecast by Technology, 2020-2035
  • Table 52: Oceania Market Volume (Units) Forecast by Technology, 2020-2035
  • Table 53: Oceania Market Value (USD Million) Forecast by Machine Type, 2020-2035
  • Table 54: Oceania Market Volume (Units) Forecast by Machine Type, 2020-2035
  • Table 55: Oceania Market Value (USD Million) Forecast by End Use, 2020-2035
  • Table 56: Oceania Market Volume (Units) Forecast by End Use, 2020-2035
  • Table 57: MEA Market Value (USD Million) Forecast by Country, 2020-2035
  • Table 58: MEA Market Volume (Units) Forecast by Country, 2020-2035
  • Table 59: MEA Market Value (USD Million) Forecast by Technology, 2020-2035
  • Table 60: MEA Market Volume (Units) Forecast by Technology, 2020-2035
  • Table 61: MEA Market Value (USD Million) Forecast by Machine Type, 2020-2035
  • Table 62: MEA Market Volume (Units) Forecast by Machine Type, 2020-2035
  • Table 63: MEA Market Value (USD Million) Forecast by End Use, 2020-2035
  • Table 64: MEA Market Volume (Units) Forecast by End Use, 2020-2035
     

List of Figures

  • Figure 1: Global Market Value (USD Million) by Technology, 2025-2035
  • Figure 2: Global Market Value (USD Million) by Machine Type, 2025-2035
  • Figure 3: Global Market Value (USD Million) by End Use, 2025-2035
  • Figure 4: Global Market Value (USD Million) by Region, 2025-2035
  • Figure 5: Global Market Value (USD Million) Analysis by Region, 2020-2035
  • Figure 6: Global Market Volume (Units) Analysis by Region, 2020-2035
  • Figure 7: Global Market Value Share (%) and BPS Analysis by Region, 2025-2035
  • Figure 8: Global Market Y-o-Y Growth (%) Projections by Region, 2025-2035
  • Figure 9: Global Market Value (USD Million) Analysis by Technology, 2020-2035
  • Figure 10: Global Market Volume (Units) Analysis by Technology, 2020-2035
  • Figure 11: Global Market Value Share (%) and BPS Analysis by Technology, 2025-2035
  • Figure 12: Global Market Y-o-Y Growth (%) Projections by Technology, 2025-2035
  • Figure 13: Global Market Value (USD Million) Analysis by Machine Type, 2020-2035
  • Figure 14: Global Market Volume (Units) Analysis by Machine Type, 2020-2035
  • Figure 15: Global Market Value Share (%) and BPS Analysis by Machine Type, 2025-2035
  • Figure 16: Global Market Y-o-Y Growth (%) Projections by Machine Type, 2025-2035
  • Figure 17: Global Market Value (USD Million) Analysis by End Use, 2020-2035
  • Figure 18: Global Market Volume (Units) Analysis by End Use, 2020-2035
  • Figure 19: Global Market Value Share (%) and BPS Analysis by End Use, 2025-2035
  • Figure 20: Global Market Y-o-Y Growth (%) Projections by End Use, 2025-2035
  • Figure 21: Global Market Attractiveness by Technology, 2025-2035
  • Figure 22: Global Market Attractiveness by Machine Type, 2025-2035
  • Figure 23: Global Market Attractiveness by End Use, 2025-2035
  • Figure 24: Global Market Attractiveness by Region, 2025-2035
  • Figure 25: North America Market Value (USD Million) by Technology, 2025-2035
  • Figure 26: North America Market Value (USD Million) by Machine Type, 2025-2035
  • Figure 27: North America Market Value (USD Million) by End Use, 2025-2035
  • Figure 28: North America Market Value (USD Million) by Country, 2025-2035
  • Figure 29: North America Market Value (USD Million) Analysis by Country, 2020-2035
  • Figure 30: North America Market Volume (Units) Analysis by Country, 2020-2035
  • Figure 31: North America Market Value Share (%) and BPS Analysis by Country, 2025-2035
  • Figure 32: North America Market Y-o-Y Growth (%) Projections by Country, 2025-2035
  • Figure 33: North America Market Value (USD Million) Analysis by Technology, 2020-2035
  • Figure 34: North America Market Volume (Units) Analysis by Technology, 2020-2035
  • Figure 35: North America Market Value Share (%) and BPS Analysis by Technology, 2025-2035
  • Figure 36: North America Market Y-o-Y Growth (%) Projections by Technology, 2025-2035
  • Figure 37: North America Market Value (USD Million) Analysis by Machine Type, 2020-2035
  • Figure 38: North America Market Volume (Units) Analysis by Machine Type, 2020-2035
  • Figure 39: North America Market Value Share (%) and BPS Analysis by Machine Type, 2025-2035
  • Figure 40: North America Market Y-o-Y Growth (%) Projections by Machine Type, 2025-2035
  • Figure 41: North America Market Value (USD Million) Analysis by End Use, 2020-2035
  • Figure 42: North America Market Volume (Units) Analysis by End Use, 2020-2035
  • Figure 43: North America Market Value Share (%) and BPS Analysis by End Use, 2025-2035
  • Figure 44: North America Market Y-o-Y Growth (%) Projections by End Use, 2025-2035
  • Figure 45: North America Market Attractiveness by Technology, 2025-2035
  • Figure 46: North America Market Attractiveness by Machine Type, 2025-2035
  • Figure 47: North America Market Attractiveness by End Use, 2025-2035
  • Figure 48: North America Market Attractiveness by Country, 2025-2035
  • Figure 49: Latin America Market Value (USD Million) by Technology, 2025-2035
  • Figure 50: Latin America Market Value (USD Million) by Machine Type, 2025-2035
  • Figure 51: Latin America Market Value (USD Million) by End Use, 2025-2035
  • Figure 52: Latin America Market Value (USD Million) by Country, 2025-2035
  • Figure 53: Latin America Market Value (USD Million) Analysis by Country, 2020-2035
  • Figure 54: Latin America Market Volume (Units) Analysis by Country, 2020-2035
  • Figure 55: Latin America Market Value Share (%) and BPS Analysis by Country, 2025-2035
  • Figure 56: Latin America Market Y-o-Y Growth (%) Projections by Country, 2025-2035
  • Figure 57: Latin America Market Value (USD Million) Analysis by Technology, 2020-2035
  • Figure 58: Latin America Market Volume (Units) Analysis by Technology, 2020-2035
  • Figure 59: Latin America Market Value Share (%) and BPS Analysis by Technology, 2025-2035
  • Figure 60: Latin America Market Y-o-Y Growth (%) Projections by Technology, 2025-2035
  • Figure 61: Latin America Market Value (USD Million) Analysis by Machine Type, 2020-2035
  • Figure 62: Latin America Market Volume (Units) Analysis by Machine Type, 2020-2035
  • Figure 63: Latin America Market Value Share (%) and BPS Analysis by Machine Type, 2025-2035
  • Figure 64: Latin America Market Y-o-Y Growth (%) Projections by Machine Type, 2025-2035
  • Figure 65: Latin America Market Value (USD Million) Analysis by End Use, 2020-2035
  • Figure 66: Latin America Market Volume (Units) Analysis by End Use, 2020-2035
  • Figure 67: Latin America Market Value Share (%) and BPS Analysis by End Use, 2025-2035
  • Figure 68: Latin America Market Y-o-Y Growth (%) Projections by End Use, 2025-2035
  • Figure 69: Latin America Market Attractiveness by Technology, 2025-2035
  • Figure 70: Latin America Market Attractiveness by Machine Type, 2025-2035
  • Figure 71: Latin America Market Attractiveness by End Use, 2025-2035
  • Figure 72: Latin America Market Attractiveness by Country, 2025-2035
  • Figure 73: Europe Market Value (USD Million) by Technology, 2025-2035
  • Figure 74: Europe Market Value (USD Million) by Machine Type, 2025-2035
  • Figure 75: Europe Market Value (USD Million) by End Use, 2025-2035
  • Figure 76: Europe Market Value (USD Million) by Country, 2025-2035
  • Figure 77: Europe Market Value (USD Million) Analysis by Country, 2020-2035
  • Figure 78: Europe Market Volume (Units) Analysis by Country, 2020-2035
  • Figure 79: Europe Market Value Share (%) and BPS Analysis by Country, 2025-2035
  • Figure 80: Europe Market Y-o-Y Growth (%) Projections by Country, 2025-2035
  • Figure 81: Europe Market Value (USD Million) Analysis by Technology, 2020-2035
  • Figure 82: Europe Market Volume (Units) Analysis by Technology, 2020-2035
  • Figure 83: Europe Market Value Share (%) and BPS Analysis by Technology, 2025-2035
  • Figure 84: Europe Market Y-o-Y Growth (%) Projections by Technology, 2025-2035
  • Figure 85: Europe Market Value (USD Million) Analysis by Machine Type, 2020-2035
  • Figure 86: Europe Market Volume (Units) Analysis by Machine Type, 2020-2035
  • Figure 87: Europe Market Value Share (%) and BPS Analysis by Machine Type, 2025-2035
  • Figure 88: Europe Market Y-o-Y Growth (%) Projections by Machine Type, 2025-2035
  • Figure 89: Europe Market Value (USD Million) Analysis by End Use, 2020-2035
  • Figure 90: Europe Market Volume (Units) Analysis by End Use, 2020-2035
  • Figure 91: Europe Market Value Share (%) and BPS Analysis by End Use, 2025-2035
  • Figure 92: Europe Market Y-o-Y Growth (%) Projections by End Use, 2025-2035
  • Figure 93: Europe Market Attractiveness by Technology, 2025-2035
  • Figure 94: Europe Market Attractiveness by Machine Type, 2025-2035
  • Figure 95: Europe Market Attractiveness by End Use, 2025-2035
  • Figure 96: Europe Market Attractiveness by Country, 2025-2035
  • Figure 97: East Asia Market Value (USD Million) by Technology, 2025-2035
  • Figure 98: East Asia Market Value (USD Million) by Machine Type, 2025-2035
  • Figure 99: East Asia Market Value (USD Million) by End Use, 2025-2035
  • Figure 100: East Asia Market Value (USD Million) by Country, 2025-2035
  • Figure 101: East Asia Market Value (USD Million) Analysis by Country, 2020-2035
  • Figure 102: East Asia Market Volume (Units) Analysis by Country, 2020-2035
  • Figure 103: East Asia Market Value Share (%) and BPS Analysis by Country, 2025-2035
  • Figure 104: East Asia Market Y-o-Y Growth (%) Projections by Country, 2025-2035
  • Figure 105: East Asia Market Value (USD Million) Analysis by Technology, 2020-2035
  • Figure 106: East Asia Market Volume (Units) Analysis by Technology, 2020-2035
  • Figure 107: East Asia Market Value Share (%) and BPS Analysis by Technology, 2025-2035
  • Figure 108: East Asia Market Y-o-Y Growth (%) Projections by Technology, 2025-2035
  • Figure 109: East Asia Market Value (USD Million) Analysis by Machine Type, 2020-2035
  • Figure 110: East Asia Market Volume (Units) Analysis by Machine Type, 2020-2035
  • Figure 111: East Asia Market Value Share (%) and BPS Analysis by Machine Type, 2025-2035
  • Figure 112: East Asia Market Y-o-Y Growth (%) Projections by Machine Type, 2025-2035
  • Figure 113: East Asia Market Value (USD Million) Analysis by End Use, 2020-2035
  • Figure 114: East Asia Market Volume (Units) Analysis by End Use, 2020-2035
  • Figure 115: East Asia Market Value Share (%) and BPS Analysis by End Use, 2025-2035
  • Figure 116: East Asia Market Y-o-Y Growth (%) Projections by End Use, 2025-2035
  • Figure 117: East Asia Market Attractiveness by Technology, 2025-2035
  • Figure 118: East Asia Market Attractiveness by Machine Type, 2025-2035
  • Figure 119: East Asia Market Attractiveness by End Use, 2025-2035
  • Figure 120: East Asia Market Attractiveness by Country, 2025-2035
  • Figure 121: South Asia Market Value (USD Million) by Technology, 2025-2035
  • Figure 122: South Asia Market Value (USD Million) by Machine Type, 2025-2035
  • Figure 123: South Asia Market Value (USD Million) by End Use, 2025-2035
  • Figure 124: South Asia Market Value (USD Million) by Country, 2025-2035
  • Figure 125: South Asia Market Value (USD Million) Analysis by Country, 2020-2035
  • Figure 126: South Asia Market Volume (Units) Analysis by Country, 2020-2035
  • Figure 127: South Asia Market Value Share (%) and BPS Analysis by Country, 2025-2035
  • Figure 128: South Asia Market Y-o-Y Growth (%) Projections by Country, 2025-2035
  • Figure 129: South Asia Market Value (USD Million) Analysis by Technology, 2020-2035
  • Figure 130: South Asia Market Volume (Units) Analysis by Technology, 2020-2035
  • Figure 131: South Asia Market Value Share (%) and BPS Analysis by Technology, 2025-2035
  • Figure 132: South Asia Market Y-o-Y Growth (%) Projections by Technology, 2025-2035
  • Figure 133: South Asia Market Value (USD Million) Analysis by Machine Type, 2020-2035
  • Figure 134: South Asia Market Volume (Units) Analysis by Machine Type, 2020-2035
  • Figure 135: South Asia Market Value Share (%) and BPS Analysis by Machine Type, 2025-2035
  • Figure 136: South Asia Market Y-o-Y Growth (%) Projections by Machine Type, 2025-2035
  • Figure 137: South Asia Market Value (USD Million) Analysis by End Use, 2020-2035
  • Figure 138: South Asia Market Volume (Units) Analysis by End Use, 2020-2035
  • Figure 139: South Asia Market Value Share (%) and BPS Analysis by End Use, 2025-2035
  • Figure 140: South Asia Market Y-o-Y Growth (%) Projections by End Use, 2025-2035
  • Figure 141: South Asia Market Attractiveness by Technology, 2025-2035
  • Figure 142: South Asia Market Attractiveness by Machine Type, 2025-2035
  • Figure 143: South Asia Market Attractiveness by End Use, 2025-2035
  • Figure 144: South Asia Market Attractiveness by Country, 2025-2035
  • Figure 145: Oceania Market Value (USD Million) by Technology, 2025-2035
  • Figure 146: Oceania Market Value (USD Million) by Machine Type, 2025-2035
  • Figure 147: Oceania Market Value (USD Million) by End Use, 2025-2035
  • Figure 148: Oceania Market Value (USD Million) by Country, 2025-2035
  • Figure 149: Oceania Market Value (USD Million) Analysis by Country, 2020-2035
  • Figure 150: Oceania Market Volume (Units) Analysis by Country, 2020-2035
  • Figure 151: Oceania Market Value Share (%) and BPS Analysis by Country, 2025-2035
  • Figure 152: Oceania Market Y-o-Y Growth (%) Projections by Country, 2025-2035
  • Figure 153: Oceania Market Value (USD Million) Analysis by Technology, 2020-2035
  • Figure 154: Oceania Market Volume (Units) Analysis by Technology, 2020-2035
  • Figure 155: Oceania Market Value Share (%) and BPS Analysis by Technology, 2025-2035
  • Figure 156: Oceania Market Y-o-Y Growth (%) Projections by Technology, 2025-2035
  • Figure 157: Oceania Market Value (USD Million) Analysis by Machine Type, 2020-2035
  • Figure 158: Oceania Market Volume (Units) Analysis by Machine Type, 2020-2035
  • Figure 159: Oceania Market Value Share (%) and BPS Analysis by Machine Type, 2025-2035
  • Figure 160: Oceania Market Y-o-Y Growth (%) Projections by Machine Type, 2025-2035
  • Figure 161: Oceania Market Value (USD Million) Analysis by End Use, 2020-2035
  • Figure 162: Oceania Market Volume (Units) Analysis by End Use, 2020-2035
  • Figure 163: Oceania Market Value Share (%) and BPS Analysis by End Use, 2025-2035
  • Figure 164: Oceania Market Y-o-Y Growth (%) Projections by End Use, 2025-2035
  • Figure 165: Oceania Market Attractiveness by Technology, 2025-2035
  • Figure 166: Oceania Market Attractiveness by Machine Type, 2025-2035
  • Figure 167: Oceania Market Attractiveness by End Use, 2025-2035
  • Figure 168: Oceania Market Attractiveness by Country, 2025-2035
  • Figure 169: Market Value (USD Million) by Technology, 2025-2035
  • Figure 170: Market Value (USD Million) by Machine Type, 2025-2035
  • Figure 171: Market Value (USD Million) by End Use, 2025-2035
  • Figure 172: Market Value (USD Million) by Country, 2025-2035
  • Figure 173: Market Value (USD Million) Analysis by Country, 2020-2035
  • Figure 174: Market Volume (Units) Analysis by Country, 2020-2035
  • Figure 175: Market Value Share (%) and BPS Analysis by Country, 2025-2035
  • Figure 176: Market Y-o-Y Growth (%) Projections by Country, 2025-2035
  • Figure 177: Market Value (USD Million) Analysis by Technology, 2020-2035
  • Figure 178: Market Volume (Units) Analysis by Technology, 2020-2035
  • Figure 179: Market Value Share (%) and BPS Analysis by Technology, 2025-2035
  • Figure 180: Market Y-o-Y Growth (%) Projections by Technology, 2025-2035
  • Figure 181: Market Value (USD Million) Analysis by Machine Type, 2020-2035
  • Figure 182: Market Volume (Units) Analysis by Machine Type, 2020-2035
  • Figure 183: Market Value Share (%) and BPS Analysis by Machine Type, 2025-2035
  • Figure 184: Market Y-o-Y Growth (%) Projections by Machine Type, 2025-2035
  • Figure 185: Market Value (USD Million) Analysis by End Use, 2020-2035
  • Figure 186: Market Volume (Units) Analysis by End Use, 2020-2035
  • Figure 187: Market Value Share (%) and BPS Analysis by End Use, 2025-2035
  • Figure 188: Market Y-o-Y Growth (%) Projections by End Use, 2025-2035
  • Figure 189: Market Attractiveness by Technology, 2025-2035
  • Figure 190: Market Attractiveness by Machine Type, 2025-2035
  • Figure 191: Market Attractiveness by End Use, 2025-2035
  • Figure 192: Market Attractiveness by Country, 2025-2035
     

Frequently Asked Questions

What is the future of labelling machine industry?

The labelling machine industry is projected to witness CAGR of 3.6% between 2025 and 2035.

What was the worth of the labelling machine industry in 2024?

The global labelling machine industry stood at USD 5.9 billion in 2024.

What will the worth of global labelling machine industry by 2035 end?

Global labelling machine industry is anticipated to reach USD 8.7 billion by 2035 end.

Which region to showcase the highest CAGR during forecast period?

South Asia & Pacific is set to record a CAGR of 6.0% in assessment period.

Who are the key players of global labelling machine industry?

The key players operating in the labelling machine industry are I.M.A. Industries Macchine Automatiche S.p.A., Krones AG, Sacmi Imola S.C.

Explore Similar Insights

Future Market Insights

Labelling Machine Market