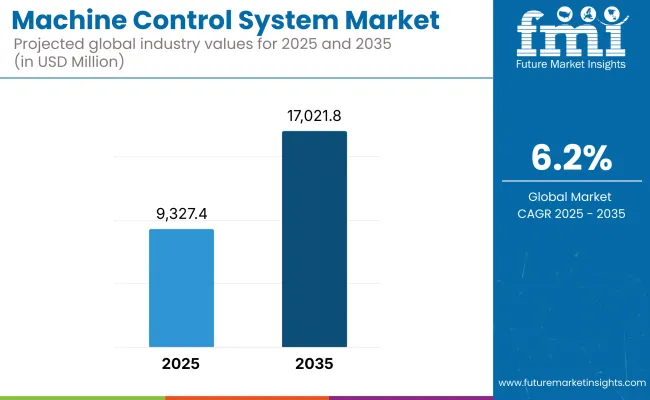
The machine control system market is projected to expand steadily between 2025 and 2035, driven by increasing demand for precision construction, rapid growth in infrastructure projects, and the global adoption of automation and telematics in heavy machinery. The market is expected to be valued at USD 9,327.4 million in 2025 and is anticipated to reach USD 17,021.8 million by 2035, reflecting a CAGR of 6.2% over the forecast period.

Machine control systems integrate GPS, GNSS, laser, total station and sensor-based technologies into construction, agriculture and mining equipment to improve operational efficiency and site accuracy. Despite key challenges including high install costs, technical complexity and interoperability issues, the market is growing as smart construction practices boom alongside labour shortages and government investments in digital infrastructure.
3D machine control systems, cloud-connected data platforms, semi-autonomous equipment integration, AI-enabled terrain analysis for predictive grading and earthworks-key trends in the industry.
Machine control systems are mainly adopted in North America, due to high construction mechanization in the region, heavy investment into highway and utility infrastructure, and well-established rental and leasing networks.
The United States retrofitting systems, fleet control based on telematics and machine learning-powered earthmoving tools are among the increasing demand. Instead, the focus on smart city infrastructure in Canada means greater deployment of GNSS-based grading systems and environmental site monitoring tools.
High accuracy standards, environmental compliance and public investment in digitising transport drive Europe’s market growth. Machine guidance is integrated within BIM (Building Information Modelling) frameworks and in sensor-driven automations for large-scale infrastructure developments, for example in Germany, UK, France, Sweden, Netherlands. Adoption of smart grading and control systems is being speeded up by supportive EU policies on digital construction and carbon footprint reduction.
The Asia-Pacific dominates as the fastest growth area, driven by spending in China, India, Japan, South Korea, and Southeast Asia on urban and regional development, expanding rail access and modernizing smart agriculture. China leads OEM-integrated control system manufacturing and deployment, and India is driving demand for scaled integral low-cost retrofits and GNSS-enabled machines. Japan and South Korea continue to advance autonomous construction robotics and AI-augmented operator support systems.
Challenges
High Initial Investment, Technical Training, and Compatibility
In the face of efficiencies gained over the long term, the front end investment of advanced machine control systems continues to pose an obstacle to small and medium contractors. Moreover, absence of trained operators, data integration hurdles among different brands, and maintenance complexity can limit adoption. The regulatory framework for autonomous heavy equipment is also underdeveloped in several areas.
Opportunities
Autonomous Equipment, Rental Ecosystems, and Data Analytics
Advancements in AI, LIDAR, and GNSS fusion technologies will lead to semi- and fully autonomous construction fleets in the future market. Expansion of equipment rental platforms, data-as-a-service (DaaS) models and remote diagnostics offer smaller players flexibility. Growing demand for real-time site analytics, cloud-integrated project planning and predictive maintenance insights are expected to unlock high-value opportunities across developed and emerging economies alike.
The machine control system market is projected to grow at a strong CAGR of over the next four years, with the period between 2020 and 2024 witnessing considerable growth owing to rising adoption in construction, agriculture, mining, and civil infrastructure projects.
Use of GNSS (Global Navigation Satellite Systems), laser scanners and 3D positioning systems ensured better accuracy, decreased rework and improved operational productivity. Contractors were looking for automated grading, drilling, and paving solutions to address labour shortages and rising costs of each project. Notable adoption challenges, especially amongst small and mid-sized firms, were high initial investments, skill gaps of operators, and system interoperability issues.
When looking ahead to 2025 to 2035, the realized market direction shifts toward fully automated heavy equipment, control platforms integrated with AI, and real-time site analytics connected to the cloud. Machine control systems will have features like predictive maintenance, fleet-level automation, and environmental performance tracking.
Growth of smart infrastructure, IoT networks with 5G connectivity, and digital twin modelling will lead to optimized machine workflows all the way from the work site to the data handlers at the other end. OEMs and technology providers will differentiate themselves with respect to sustainability compliance, modular system architectures, and cross-brand compatibility.
Market Shifts: A Comparative Analysis (2020 to 2024 vs. 2025 to 2035)
| Market Shift | 2020 to 2024 Trends |
|---|---|
| Regulatory Landscape | Compliance with construction safety standards, emissions monitoring, and regional equipment certification. |
| Technological Innovation | GNSS, total station, ultrasonic, and laser-based control systems for excavators, graders, and bulldozers. |
| Industry Adoption | Widely used in road construction, trenching, site levelling , and precision farming. |
| Smart & AI-Enabled Solutions | Semi-automated control systems with GPS feedback and digital elevation models. |
| Market Competition | Led by Topcon, Trimble, Leica Geosystems (Hexagon), MOBA Mobile Automation, and Caterpillar. |
| Market Growth Drivers | Labour shortages, demand for productivity and precision, and global infrastructure development programs. |
| Sustainability and Environmental Impact | Focus on reducing idle time and fuel consumption through machine guidance. |
| Integration of AI & Digitalization | Connected equipment with cloud data sync and equipment health monitoring. |
| Advancements in Product Design | Ruggedized in-cab control panels, external sensors, and jobsite software platforms. |
| Market Shift | 2025 to 2035 Projections |
|---|---|
| Regulatory Landscape | Standardization of autonomous construction systems, ESG-linked machine reporting, and AI auditability for regulatory inspections. |
| Technological Innovation | AI-enabled terrain adaptation, edge computing for real-time guidance, 5G-integrated systems, and automated fleet coordination algorithms. |
| Industry Adoption | Expansion into underground tunnelling , remote mining operations, autonomous port logistics, and climate-resilient land management. |
| Smart & AI-Enabled Solutions | Fully AI-driven machine orchestration, autonomous worksite coordination, and predictive sensor calibration for equipment optimization. |
| Market Competition | Growing competition from AI-native automation firms, open-platform control system providers, and digital twin-based infrastructure players. |
| Market Growth Drivers | Growth driven by autonomous construction trends, real-time machine learning, smart city expansion, and carbon-conscious heavy equipment use. |
| Sustainability and Environmental Impact | Full integration of sustainability KPIs, carbon offset tracking, and green-machine optimization with real-time emission reduction analytics. |
| Integration of AI & Digitalization | AI-powered cloud platforms, jobsite digital twins, predictive performance modelling , and real-time project compliance dashboards. |
| Advancements in Product Design | Modular machine control kits, voice-assisted operator interfaces, cross-brand compatible AI hubs, and drone-integrated guidance systems. |

Automated control systems for engineering equipment signal a new stage of development in individual industries. Together, infrastructure modernization programs and increasing demand for precision excavation, grading, and paving are driving the adoption of GNSS, laser, and total station-based control systems.
Contractors are finding better ways to save fuel, rework and improve safety with machine control The adoption of 3D modelling and Building Information Modelling (BIM) tools are accelerating the transition to smart construction workflows in the public and private sectors.
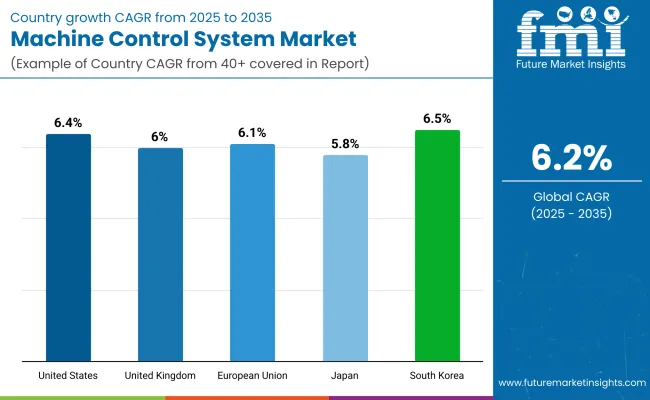
| Country | CAGR (2025 to 2035) |
|---|---|
| United States | 6.4% |
The machine control system market in the UK continues to grow steadily, due to increasing government investments to build infrastructure and the development of smart cities driving demand for intelligent heavy equipment. Roadworks, rail expansion and utilities upgrades are opening up opportunities for precision control systems in excavators, dozers and graders.
UK contractors are adopting 3D machine guidance and integrated site management solutions to promote productivity and compliance. In addition, the UK’s National Infrastructure Strategy aims to promote digitization in the construction industry, which is also helping to some extent to drive growth in the market.
| Country | CAGR (2025 to 2035) |
|---|---|
| United Kingdom | 6.0% |
Germany, France, the Netherlands dominate the market of European machine control systems as they are strongly investing in transport infrastructure, renewable energy projects, and advanced agricultural mechanization. The EU’s drive to digitalize and Industry 4.0 initiatives are accelerating take-up of automated control systems for earthmoving, grading and compaction.
Interoperability and sensor fusion systems that aid in coordinating fleets and mapping terrain in real time are in high demand. Ease of use, remote diagnostics and sustainability-focused equipment optimization ranked high on manufacturers' technology priorities.
| Country | CAGR (2025 to 2035) |
|---|---|
| European Union | 6.1% |
Japan's machine control system market is steadily advancing, with a significant focus on automation driven by labour shortages and aging infrastructure. More and more machine guidance is used in compact equipment and automated control systems for road construction in both the public and private sectors.
To provide precision and operator-assist functionality, Japanese OEMs are merging machine control with telematics and robotics. Government backing of smart construction and productivity-boosting technologies further fueled advancements and adoption.
| Country | CAGR (2025 to 2035) |
|---|---|
| Japan | 5.8% |
The machine control system market in South Korea is expanding rapidly, driven by advanced manufacturing infrastructure, digital construction initiatives, and a highly connected construction technology ecosystem. In civil engineering and utility installation projects, the country is adopting machine guidance based on GNSS and total stations.
Korean companies have been making investments in integrated control platforms with cloud connectivity, real-time analytics, and AI-assisted grading solutions. The growth of market demand is also aided by urban infrastructure upgrades and the spread of smart farming and forestry equipment.
| Country | CAGR (2025 to 2035) |
|---|---|
| South Korea | 6.5% |
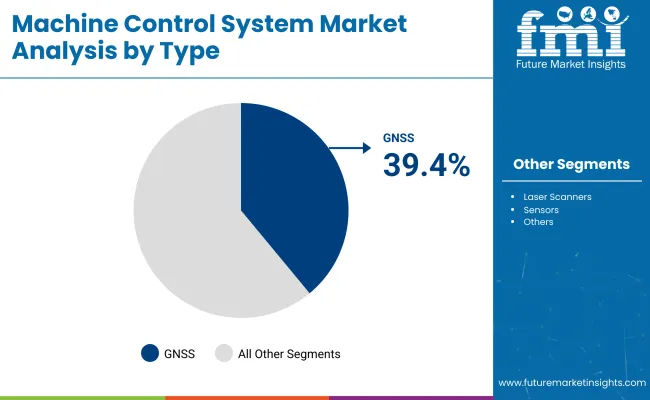
Type Market Share (2025)

| Type | Value Share (%) |
|---|---|
| Global Navigation Satellite Systems (GNSS) | 39.4% |
Accounting for 39.4% of global market value, global navigation satellite systems (GNSS) are expected to lead the market of machine control system by 2025. The increased positioning accuracy, scalability, and real-time data transmission of GNSS technologies all contribute to their indispensable status and have set a precedence in precision-driven applications in construction, agriculture, and the likes of mining.
GNSS-based machine control systems allow operators to automate grading, excavation, and earthmoving tasks with remarkable efficiency, all while completing their work with a minimum of rework and material waste. GNSS has emerged as a fusion point, but its ability to adapt becomes even more pivotal as GNSS is used on many types of equipment from dozers to graders to excavators, which makes GNSS a go-to solution in both largescale infrastructure and commercial projects.
With the growing demand for connected job sites, combined with fast tracked digital transformation in heavy equipment operations, GNSS adoption has also accelerated. With ongoing growth in global infrastructure investments and more machine control operations running on automation to integrate more capabilities in construction workflows, GNSS is still the standard to build on for high-precision machine control technologies.
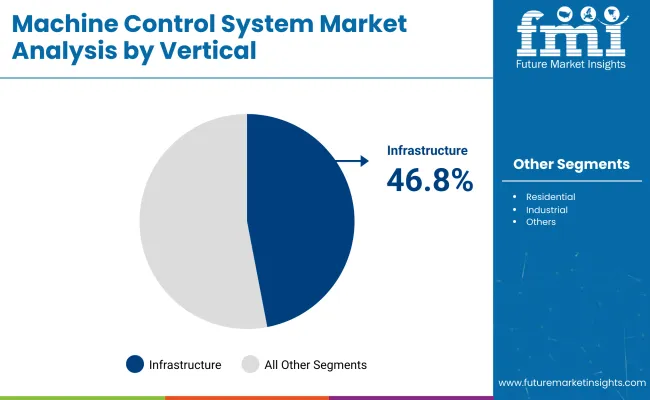
Vertical Market Share (2025)

| Vertical | Value Share (%) |
|---|---|
| Infrastructure | 46.8% |
The infrastructure segment is estimated to lead the machine control system market by 2025, accounting for a value share of 46.8%. The rise in global investments in transportation infrastructure networks, smart cities, and public utilities is driving machine control solutions that improve the accuracy, safety, and productivity of complex infrastructure development.
Two areas where speed and precision are essential road building, bridge construction, and airport expansion are increasingly seeing machine control systems streamline operations across landscape, infrastructure, and environmental concerns. Technology implementation: For Infrastructure Projects, GNSS, laser scanners, total stations, etc., are widely adopted to ensure the accuracy of grading and alignment in construction, reduce surveying costs and expedite project completion.
North America, Europe, and Asia-Pacific governments are also ramping up economic recovery plans that include increased infrastructure spending, propelling the use of advanced automated control systems within construction machinery. With the shift towards digital construction practices, the infrastructure vertical continues to be the leading end-use segment in the global machine control system market.
With the increasing automation of construction, mining, and agriculture, and improving demand for precision operations, real-time data integration, and project cost optimization, the global machine control system market is growing with a steady CAGR. These advanced drives, along with enabling the highest GNSS equipment accuracy, laser scanning, robotics, and IoT connectivity, turn heavy machines into intelligent, data-driven assets.
Key factors instigating such growth of the market include labour shortages, infrastructure investments by government, digitalization of jobs site, and integration with building information modelling (BIM) platforms. Key market drivers are labour shortages, digitalization of jobs, site integration with BIM government investment in infrastructure.
Market Share Analysis by Key Players
| Company/Organization Name | Estimated Market Share (%) |
|---|---|
| Topcon Corporation | 21-25% |
| Trimble Inc. | 18-22% |
| Leica Geosystems (Hexagon AB) | 14-18% |
| MOBA Mobile Automation AG | 8-11% |
| Hemisphere GNSS, Inc. | 5-8% |
| Others | 17-23% |
| Company/Organization Name | Key Offerings/Activities |
|---|---|
| Topcon Corporation | In 2024 , Topcon launched its MC-Mobile integrated solution for compact equipment, combining GNSS receivers, sensors, and 3D design files for plug-and-play grading and excavation. |
| Trimble Inc. | As of 2023 , Trimble enhanced its Earthworks Grade Control Platform with AI-powered automation, real-time cloud syncing, and remote diagnostics for dozers, excavators, and graders. |
| Leica Geosystems (Hexagon AB) | In 2025 , Leica introduced its iCON site excavator solution , integrating 3D machine guidance, cloud-based project management, and tiltrotator compatibility for smart construction sites. |
| MOBA Mobile Automation AG | In 2023 , MOBA upgraded its PAVE-IR and 3D-matic systems , offering real-time thermal mapping and levelling accuracy for asphalt paving and compaction equipment. |
| Hemisphere GNSS, Inc. | As of 2024 , Hemisphere launched its Atlas™-based grade control solutions , providing centimetre -level precision with scalable RTK corrections across heavy machinery fleets. |
Key Market Insights
Topcon Corporation (21-25%)
Market leader in compact and mid-size machinery control, offering user-friendly systems that integrate with existing workflows and support 3D site modelling.
Trimble Inc. (18-22%)
Known for its deep ecosystem of smart construction tools, Trimble delivers advanced automation, BIM integration, and IoT-ready platforms with global adoption in infrastructure projects.
Leica Geosystems (Hexagon AB) (14-18%)
Strong in high-precision control systems, Leica provides GNSS and total station-based solutions ideal for complex grading and excavation in urban and industrial environments.
MOBA Mobile Automation AG (8-11%)
Focuses on road construction and paving automation, MOBA’s modular systems are widely adopted for surface accuracy, temperature monitoring, and fleet coordination.
Hemisphere GNSS, Inc. (5-8%)
Specializes in scalable and cost-efficient GNSS-based control platforms for construction, agriculture, and mining sectors in North America, LATAM, and Asia-Pacific.
Other Key Players (Combined Share: 17-23%)
Several regional automation specialists and emerging tech innovators are driving advancements in cloud-controlled machinery, sensor fusion, and AI-based decision support, including:
Komatsu Ltd. (SMARTCONSTRUCTION) - Offers factory-integrated machine control on excavators and bulldozers with drone data syncing and site digitization tools
The overall market size for the machine control system market was USD 9,327.4 million in 2025.
The machine control system market is expected to reach USD 17,021.8 million in 2035.
The demand for machine control systems will be driven by increasing adoption of automation in construction and mining, rising need for precision and productivity in heavy equipment operations, growing infrastructure development globally, and advancements in GNSS, laser, and 3D machine guidance technologies.
The top 5 countries driving the development of the machine control system market are the USA, China, Germany, Japan, and South Korea.
The GNSS-based machine control systems segment is expected to command a significant share over the assessment period.


Our Research Products

The "Full Research Suite" delivers actionable market intel, deep dives on markets or technologies, so clients act faster, cut risk, and unlock growth.

The Leaderboard benchmarks and ranks top vendors, classifying them as Established Leaders, Leading Challengers, or Disruptors & Challengers.

Locates where complements amplify value and substitutes erode it, forecasting net impact by horizon

We deliver granular, decision-grade intel: market sizing, 5-year forecasts, pricing, adoption, usage, revenue, and operational KPIs—plus competitor tracking, regulation, and value chains—across 60 countries broadly.

Spot the shifts before they hit your P&L. We track inflection points, adoption curves, pricing moves, and ecosystem plays to show where demand is heading, why it is changing, and what to do next across high-growth markets and disruptive tech

Real-time reads of user behavior. We track shifting priorities, perceptions of today’s and next-gen services, and provider experience, then pace how fast tech moves from trial to adoption, blending buyer, consumer, and channel inputs with social signals (#WhySwitch, #UX).

Partner with our analyst team to build a custom report designed around your business priorities. From analysing market trends to assessing competitors or crafting bespoke datasets, we tailor insights to your needs.
Supplier Intelligence
Discovery & Profiling
Capacity & Footprint
Performance & Risk
Compliance & Governance
Commercial Readiness
Who Supplies Whom
Scorecards & Shortlists
Playbooks & Docs
Category Intelligence
Definition & Scope
Demand & Use Cases
Cost Drivers
Market Structure
Supply Chain Map
Trade & Policy
Operating Norms
Deliverables
Buyer Intelligence
Account Basics
Spend & Scope
Procurement Model
Vendor Requirements
Terms & Policies
Entry Strategy
Pain Points & Triggers
Outputs
Pricing Analysis
Benchmarks
Trends
Should-Cost
Indexation
Landed Cost
Commercial Terms
Deliverables
Brand Analysis
Positioning & Value Prop
Share & Presence
Customer Evidence
Go-to-Market
Digital & Reputation
Compliance & Trust
KPIs & Gaps
Outputs
Full Research Suite comprises of:
Market outlook & trends analysis
Interviews & case studies
Strategic recommendations
Vendor profiles & capabilities analysis
5-year forecasts
8 regions and 60+ country-level data splits
Market segment data splits
12 months of continuous data updates
DELIVERED AS:
PDF EXCEL ONLINE
Turbomachinery Control System Market Size and Share Forecast Outlook 2025 to 2035
Sewing Machine Electronic Control System Market Size and Share Forecast Outlook 2025 to 2035
Machine Glazed Paper Market Size and Share Forecast Outlook 2025 to 2035
Machine Glazed Kraft Paper Market Forecast and Outlook 2025 to 2035
Machine Condition Monitoring Market Size and Share Forecast Outlook 2025 to 2035
Machine Glazed Paper Industry Analysis in Asia Pacific Forecast Outlook 2025 to 2035
Machine Vision Camera Market Size and Share Forecast Outlook 2025 to 2035
Machine Tool Oils Market Size and Share Forecast Outlook 2025 to 2035
Machine Glazed Paper Industry Analysis in Western Europe Size and Share Forecast Outlook 2025 to 2035
Machine Glazed Paper Industry Analysis in Korea Size and Share Forecast Outlook 2025 to 2035
Machine Glazed Paper Industry Analysis in Japan Size and Share Forecast Outlook 2025 to 2035
Machine Tool Touch Probe Market Analysis - Size, Growth, and Forecast 2025 to 2035
Machine Mount Market Analysis - Size & Industry Trends 2025 to 2035
Machine-to-Machine (M2M) Connections Market – IoT & Smart Devices 2025 to 2035
Machine Safety Market Analysis by Component, Industry, and Region Through 2035
Key Players & Market Share in Machine Glazed Paper Industry
Machine Vision Market Insights – Growth & Forecast 2024-2034
Machine Learning As A Services Market
Machine Vision System And Services Market Size and Share Forecast Outlook 2025 to 2035
Machine Tool Cooling System Market Analysis - Size, Share, and Forecast Outlook 2025 to 2035

Thank you!
You will receive an email from our Business Development Manager. Please be sure to check your SPAM/JUNK folder too.
Chat With
MaRIA