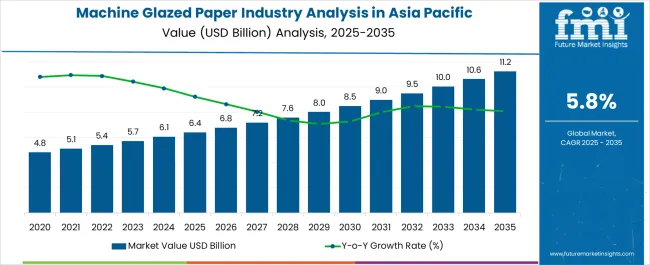
The Machine Glazed Paper industry in the Asia Pacific region is witnessing steady growth, driven by increasing demand for high-quality packaging and printing materials across industrial, commercial, and consumer applications. Rising e-commerce activities, expansion of the food and beverage sector, and growing manufacturing output are creating significant demand for durable and visually appealing paper products. The adoption of machine glazed paper is being supported by advancements in production technology that enhance surface smoothness, gloss, and printability, meeting the evolving quality requirements of end users.
Regulatory emphasis on sustainable packaging and environmentally friendly production processes is further shaping market dynamics, encouraging the use of recyclable and biodegradable raw materials. Increasing investments in modern pulp and paper mills and the availability of locally sourced raw materials contribute to cost efficiency and regional growth.
As manufacturers focus on producing higher-quality, value-added paper grades, the Asia Pacific market is expected to sustain expansion Technological innovations, growing industrial demand, and rising awareness of high-performance paper products are positioning the region for long-term growth.

| Metric | Value |
|---|---|
| Machine Glazed Paper Industry Analysis in Asia Pacific Estimated Value in (2025 E) | USD 6.4 billion |
| Machine Glazed Paper Industry Analysis in Asia Pacific Forecast Value in (2035 F) | USD 11.2 billion |
| Forecast CAGR (2025 to 2035) | 5.8% |
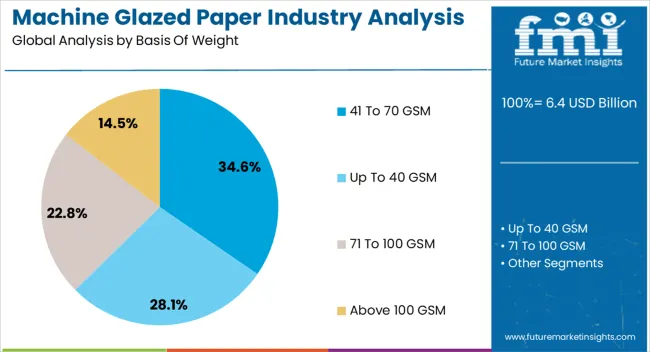
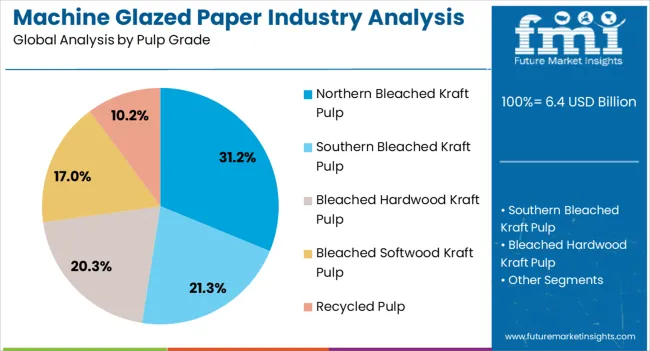
The market is segmented by Basis Of Weight, Pulp Grade, Paper Grade, Application, and End-Use and region. By Basis Of Weight, the market is divided into 41 To 70 GSM, Up To 40 GSM, 71 To 100 GSM, and Above 100 GSM. In terms of Pulp Grade, the market is classified into Northern Bleached Kraft Pulp, Southern Bleached Kraft Pulp, Bleached Hardwood Kraft Pulp, Bleached Softwood Kraft Pulp, and Recycled Pulp. Based on Paper Grade, the market is segmented into Bleached and Unbleached. By Application, the market is divided into Bags And Pouches, Sacks, Wraps, Labels And Release Liner, Envelopes, and Others (Gift Wrap, Cup). By End-Use, the market is segmented into Food & Beverage, Healthcare, Textile, Personal Care And Cosmetics, Electric And Electronics, Automotive, Building And Construction, and Others (Household). Regionally, the market is classified into North America, Latin America, Western Europe, Eastern Europe, Balkan & Baltic Countries, Russia & Belarus, Central Asia, East Asia, South Asia & Pacific, and the Middle East & Africa.

The 41 to 70 GSM basis of weight segment is projected to hold 34.6% of the market revenue in 2025, establishing it as the leading weight category. Growth in this segment is being driven by its optimal balance of strength, flexibility, and cost efficiency, which makes it suitable for packaging, printing, and industrial applications. Its versatility allows manufacturers to meet diverse customer requirements while maintaining material performance and durability.
Machine glazed paper in this weight range offers superior print quality, smoothness, and resistance to moisture, supporting commercial and industrial printing operations. Increasing adoption of sustainable and recyclable paper products is also driving demand within this category.
The ability to customize thickness and surface finish enhances operational efficiency and product appeal As demand from e-commerce, food packaging, and industrial sectors continues to rise, the 41 to 70 GSM segment is expected to maintain its market leadership, supported by technological innovations in production processes and increasing awareness of high-performance paper requirements in the Asia Pacific region.

The northern bleached kraft pulp segment is anticipated to account for 31.2% of the market revenue in 2025, making it the leading pulp grade. Growth is driven by the superior strength, whiteness, and uniformity it provides, which is critical for producing high-quality machine glazed paper. This pulp grade enables consistent surface properties, improved printability, and enhanced mechanical performance, meeting stringent industrial and commercial standards.
Its ability to maintain structural integrity and durability under various processing conditions has strengthened its adoption among paper manufacturers. Increasing investments in advanced pulping technologies and sustainable forestry practices further support production efficiency and reliability.
The northern bleached kraft pulp grade is particularly favored for producing value-added paper grades that require high brightness and smoothness As demand for premium paper products and sustainable packaging solutions rises in the Asia Pacific region, this pulp grade is expected to remain the dominant choice for manufacturers aiming to deliver consistent performance and quality across diverse applications.

The bleached paper grade segment is projected to hold 58.9% of the market revenue in 2025, establishing it as the leading paper grade. Its dominance is being driven by the high demand for superior whiteness, smoothness, and print quality, which are essential for packaging, labeling, and premium printing applications. Bleached machine glazed paper provides consistent surface finish, enhanced brightness, and superior visual appeal, supporting brand differentiation and high-quality print reproduction.
This grade also offers improved resistance to moisture and mechanical stress, making it suitable for diverse industrial and commercial applications. Adoption is further supported by increasing awareness of high-performance paper requirements among end users and manufacturers in the Asia Pacific region.
Technological advancements in bleaching processes and chemical treatments have enhanced efficiency and sustainability, supporting scalable production As packaging, industrial printing, and e-commerce sectors continue to expand, the bleached paper grade segment is expected to maintain its leading position, driven by its superior functional attributes and widespread applicability across multiple end-use industries.
The glazed paper industry in Asia Pacific recorded a CAGR of 3.5% during the historical period, with an industry value of USD 5,707.1 million in 2025 from USD 4,810.8 million in 2020.
Environmentally friendly products are gaining traction among consumers, showing remarkable growth in the glazed paper industry. Machine-glazed paper manufacturers gravitate toward eco-friendly materials and solutions, which is set to augment the industry's growth.
Demand for machine-glazed paper has expanded with rising disposable income and population in Asia Pacific. Several government initiatives to encourage the usage ofa environmentally sustainable packaging are projected to give profitable prospects for machine-glazed paper manufacturers by 2035.
Machine-glazed paper offers great mechanical strength and flexibility and is easy to print, making it applicable to several industrial and consumer product packaging applications.
Growing levels of investment in biodegradable packaging to promote sustainable packaging are set to create enormous prospects for the machine-glazed paper industry through the forecast period.
Flourishing Food & Beverage Industry to Augment Sales
The glazed paper industry in Asia Pacific is significantly pushed by demand from the food and beverage industry. Machine-glazed paper is predominantly used in the food and beverage industry to manufacture a wide range of packaging applications such as wraps, bags, cups, and bowls, as it features a high level of sanitation and safety with multi-layers of gloss.
Consistently increasing production output from the food and beverage sector creates a substantial demand for machine-glazed paper for safe and secure packaging of various food items. Asia Pacific's food and beverage industry has witnessed healthy growth from 2020 to 2025 and is estimated to continue in the foreseeable years.
The rising middle-class group, coupled with increasing expenditure on food consumption in emerging industries, is anticipated to boost economic growth of the food and beverage industry. These factors are expected to impact the demand for machine-glazed paper in Asia Pacific.
High Preference for Environment-friendly Packaging
Increasing awareness of eco-friendly packaging is resulting in surging demand for packaging solutions that are sustainable and recyclable. Manufacturers are turning their focus toward the development of sustainable paper packaging.
Several companies and manufacturers are using paper-based packaging materials as an alternative to plastic and metalized solutions for industries such as food, healthcare, personal care and cosmetics, building, construction, and household applications.
Machine-glazed paper is used to manufacture bags, pouches, wraps, labels, bowls, cups, trays, and other items. These packaging formats are in high demand throughout Asia Pacific.
Machine glazed paper manufacturers are taking several initiatives to increase the adoption of these papers in manufacturing packaging formats and are encouraging customers to use these sustainable solutions. Increasing shift toward environment-friendly packaging solutions further fuels demand for machine-glazed paper in Asia Pacific.
The table presents the expected CAGR for Asia Pacific’s machine glazed paper industry over several semi-annual periods spanning from 2025 to 2035. In the first half (H1) of the decade from 2025 to 2035, the industry is predicted to surge at a CAGR of 5.7%, followed by a slightly lower growth rate of 3.9% in the second half (H2) of the same decade.
Moving into the subsequent period, from H1 2025 to H2 2035, the CAGR is projected to increase slightly to 4.8% in the first half and rise to 6.0% in the second half.
| Particular | Value CAGR |
|---|---|
| H1 | 5.7% (2025 to 2035) |
| H2 | 3.9% (2025 to 2035) |
| H1 | 4.8% (2025 to 2035) |
| H2 | 6.0% (2025 to 2035) |
The section below shows the unbleached segment leading in terms of paper grade. It is estimated to thrive at a 5.6% CAGR between 2025 and 2035. Based on application, the sack segment is anticipated to hold a dominant share through 2035. It is set to exhibit a CAGR of 5.0% during the forecast period.
| Segment | Value CAGR (2025 to 2035) |
|---|---|
| Unbleached (Paper Grade) | 5.6% |
| Sacks (Application) | 5.0% |
Unbleached machine-glazed paper segment is expected to lead the industry and is projected to capture 3/4th of the share in 2025, generating an incremental opportunity worth USD 3,352 million during the forecast period. Unbleached paper is manufactured without any bleaching process, which reduces the environmental impact of the material and lowers the risk of harmful chemical release in the environment.
Unbleached paper is produced using less energy and water, lowering its carbon footprint. These advantages of unbleached machine-glazed paper contribute to the industry's growth. The easy recyclability and compostable nature of unbleached machine-glazed paper is increasing its adoption in several application such as food and beverages.
Machine-glazed paper has a high tensile strength, making it applicable for heavy-weight packaging such as sacks. It provides strength and durability for the products and protects them from getting punctured. Sacks are highly used in the agricultural, chemical, food, and beverage industries because of their heavy-duty applications.
The table below shows the estimated growth rates of the top five countries. India, Indonesia, and Vietnam are set to record high CAGRs of 7.5%, 7.2%, and 6.6% respectively, through 2035.
| Countries | Value CAGR (2025 to 2035) |
|---|---|
| China | 4.9% |
| Japan | 5.6% |
| India | 7.5% |
| Indonesia | 7.2% |
| Vietnam | 6.6% |
As stated by Invest India, the packaging industry in India is expected to generate USD 6.4 billion in revenue by 2025. Demand for machine-glazed paper in India is propelled by increasing consumer demand for sustainable packaging and rising packaged food consumption.
India is experiencing surging investment in food processing, personal care, and pharmaceutical industries. This growth in the packaging industry and rising investment in the manufacturing sector push demand for machine-glazed paper during the forecast period in India.
Vietnam is anticipated to expand at 6.6% CAGR, reaching a value of USD 11.2 million by 2035. Manufacturing industries in Vietnam are shifting toward creative, cost-effective, and sustainable packaging options, surging demand for machine-glazed paper.
Companies and manufacturers in Vietnam are focusing on meeting the needs of an urbanized population by providing safe, durable, and efficient packaging solutions.

Leading players in the industry are directed toward mergers, product launches, and developments to expand their industry reach. Manufacturers of machine-glazed paper across Asia are strengthening their presence by upgrading their product portfolios and supplier & distributor networks. Recent activities of industry players operating in Asia Pacific are:
The global machine glazed paper industry analysis in asia pacific is estimated to be valued at USD 6.4 billion in 2025.
The market size for the machine glazed paper industry analysis in asia pacific is projected to reach USD 11.2 billion by 2035.
The machine glazed paper industry analysis in asia pacific is expected to grow at a 5.8% CAGR between 2025 and 2035.
The key product types in machine glazed paper industry analysis in asia pacific are 41 to 70 gsm, up to 40 gsm, 71 to 100 gsm and above 100 gsm.
In terms of pulp grade, northern bleached kraft pulp segment to command 31.2% share in the machine glazed paper industry analysis in asia pacific in 2025.


Our Research Products

The "Full Research Suite" delivers actionable market intel, deep dives on markets or technologies, so clients act faster, cut risk, and unlock growth.

The Leaderboard benchmarks and ranks top vendors, classifying them as Established Leaders, Leading Challengers, or Disruptors & Challengers.

Locates where complements amplify value and substitutes erode it, forecasting net impact by horizon

We deliver granular, decision-grade intel: market sizing, 5-year forecasts, pricing, adoption, usage, revenue, and operational KPIs—plus competitor tracking, regulation, and value chains—across 60 countries broadly.

Spot the shifts before they hit your P&L. We track inflection points, adoption curves, pricing moves, and ecosystem plays to show where demand is heading, why it is changing, and what to do next across high-growth markets and disruptive tech

Real-time reads of user behavior. We track shifting priorities, perceptions of today’s and next-gen services, and provider experience, then pace how fast tech moves from trial to adoption, blending buyer, consumer, and channel inputs with social signals (#WhySwitch, #UX).

Partner with our analyst team to build a custom report designed around your business priorities. From analysing market trends to assessing competitors or crafting bespoke datasets, we tailor insights to your needs.
Supplier Intelligence
Discovery & Profiling
Capacity & Footprint
Performance & Risk
Compliance & Governance
Commercial Readiness
Who Supplies Whom
Scorecards & Shortlists
Playbooks & Docs
Category Intelligence
Definition & Scope
Demand & Use Cases
Cost Drivers
Market Structure
Supply Chain Map
Trade & Policy
Operating Norms
Deliverables
Buyer Intelligence
Account Basics
Spend & Scope
Procurement Model
Vendor Requirements
Terms & Policies
Entry Strategy
Pain Points & Triggers
Outputs
Pricing Analysis
Benchmarks
Trends
Should-Cost
Indexation
Landed Cost
Commercial Terms
Deliverables
Brand Analysis
Positioning & Value Prop
Share & Presence
Customer Evidence
Go-to-Market
Digital & Reputation
Compliance & Trust
KPIs & Gaps
Outputs
Full Research Suite comprises of:
Market outlook & trends analysis
Interviews & case studies
Strategic recommendations
Vendor profiles & capabilities analysis
5-year forecasts
8 regions and 60+ country-level data splits
Market segment data splits
12 months of continuous data updates
DELIVERED AS:
PDF EXCEL ONLINE
Machine Glazed Paper Industry Analysis in Western Europe Size and Share Forecast Outlook 2025 to 2035
Machine Glazed Paper Industry Analysis in Korea Size and Share Forecast Outlook 2025 to 2035
Machine Glazed Paper Industry Analysis in Japan Size and Share Forecast Outlook 2025 to 2035
Machine Glazed Paper Market Size and Share Forecast Outlook 2025 to 2035
Key Players & Market Share in Machine Glazed Paper Industry
Machine Glazed Kraft Paper Market Forecast and Outlook 2025 to 2035
Asia Pacific Stick Packaging Machines Market Size and Share Forecast Outlook 2025 to 2035
Asia Pacific Sachet Packaging Machines Market Size and Share Forecast Outlook 2025 to 2035
Asia Pacific Dental Market Analysis – Growth, Trends & Forecast 2024-2034
Epoxy Resin Industry Analysis in Asia Pacific Size and Share Forecast Outlook 2025 to 2035
Sachet Packaging Industry Analysis in Asia Pacific - Size, Share, and Forecast 2025 to 2035
Asia-Pacific Religious Tourism Market Growth – Forecast 2024-2034
Underground Coal Gasification Industry Analysis in Asia Pacific Size and Share Forecast Outlook 2025 to 2035
Asia Pacific Tomato Seed Oil Market Size and Share Forecast Outlook 2025 to 2035
Asia Pacific Loop-mediated Isothermal Amplification (LAMP) Market Size and Share Forecast Outlook 2025 to 2035
Asia Pacific Nutraceutical Market Size and Share Forecast Outlook 2025 to 2035
Asia Pacific and Europe Tarpaulin Sheets Market Size and Share Forecast Outlook 2025 to 2035
Asia Pacific Functional Food Ingredients Market Size and Share Forecast Outlook 2025 to 2035
Asia Pacific Solid State Transformers Market Size and Share Forecast Outlook 2025 to 2035
Asia Pacific Gasoline Injection Technologies Market Size and Share Forecast Outlook 2025 to 2035

Thank you!
You will receive an email from our Business Development Manager. Please be sure to check your SPAM/JUNK folder too.
Chat With
MaRIA