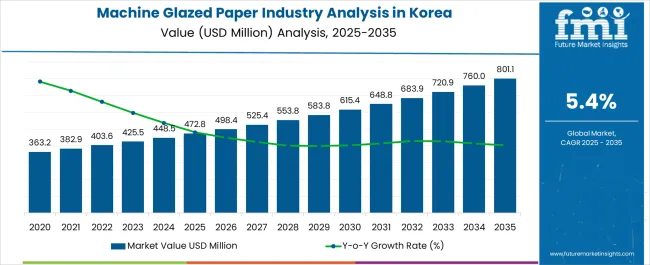
The demand for machine glazed paper is expected to soar across Korea, especially in South Jeolla and North Jeolla. By the end of FY 2024, the sales for machine glazed paper are poised to reach a valuation of USD 447.3 million. The demand for machine glazed paper in Korea is likely to grow at a 5.70% CAGR from 2024 to 2034. The industry valuation is projected to attain USD 779.3 million by 2034.
Attributes | Details |
---|---|
Anticipated Industry Size in 2024 | USD 447.3 million |
Expected Industry Size in 2034 | USD 779.3 million |
Forecasted CAGR between 2024 to 2034 | 5.70% CAGR |
A prominent driver is the growing emphasis on sustainable packaging solutions. As environmental concerns escalate, industries seek eco friendly alternatives, propelling the demand for machine glazed paper due to its recyclability and biodegradability.
The surge in ecommerce is reshaping packaging demands, driving the need for robust and versatile paper products. Its adaptability and strength cater to these evolving requirements, expanding its applications in various packaging solutions. Technological innovations in paper manufacturing machinery enhance production efficiency, reducing energy consumption and costs while maintaining product quality.
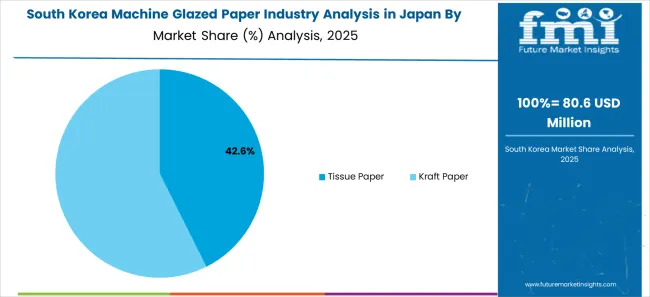
The enduring dominance of kraft paper, projected to maintain an 80.00% industry share until 2023, stems from its versatility and reliability in packaging applications. Renowned for its strength, durability, and eco friendly attributes, kraft paper remains a preferred choice across diverse sectors.
Paper Type | Kraft Paper |
---|---|
Industry Share | 80.00% |
Adaptability to various printing and coating techniques further solidifies kraft paper’s position. The rising demand for sustainable packaging solutions aligns perfectly with its eco conscious nature, ensuring its continued prominence as the go to material for a multitude of packaging needs within Korea machine glazed paper industry.
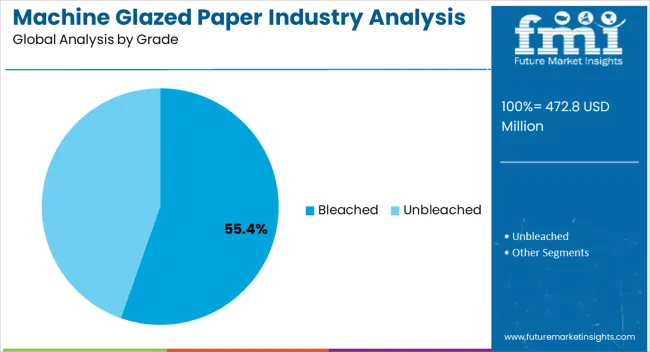
The projected dominance of unbleached paper, maintaining a 66.90% industry share until 2023, stems from its eco friendly nature and minimal processing. Renowned for its natural appearance, unbleached paper retains its natural brown hue, appealing to environmentally conscious consumers.
Grade | Unbleached Paper |
---|---|
Industry Share | 66.90% |
Its popularity is due to the reduced environmental impact during production, aligning with sustainable packaging trends. The inherent strength and versatility of unbleached paper further reinforce its position, catering to diverse packaging needs. With an increasing emphasis on eco conscious practices, unbleached paper remains a steadfast choice, driving its continued dominance in Korea machine glazed paper industry.
In South Jeolla machine glazed paper industry, innovative trends redefine the landscape. Advanced manufacturing technologies drive a shift towards eco friendly practices, emphasizing sustainability and recyclability. Adoption of renewable energy sources and efficient production processes showcases its commitment to environmental responsibility.
The industry witnesses a trend towards customization, catering to diverse packaging needs across sectors. Manufacturers focus on creating tailored solutions, offering varied paper grades, sizes, and coatings, meeting specific client demands and enhancing product versatility.
Integration of smart technologies like IoT and automation streamlines production, optimizing efficiency and reducing operational costs. These advancements bolster the position of South Jeolla in the industry, ensuring high quality, cost effective machine glazed papers.
Exploration of alternative raw materials, continuous research, and development efforts drive innovation, fostering product improvements and novel applications. South Jeolla machine glazed paper industry stands at the forefront of technological innovations, sustainability, and customization, shaping the future of packaging solutions.
North Jeolla machine glazed paper industry is witnessing a surge in opportunities due to various factors. Its rich forestry resources and advanced paper manufacturing infrastructure position it favorably in the industry. The industry benefits from a skilled workforce and robust research and development capabilities, fostering innovation in paper production techniques and product diversification.
Increasing demand for sustainable packaging solutions globally present a significant growth avenue for North Jeolla machine glazed paper sector. Its emphasis on eco friendly practices aligns with evolving consumer preferences and regulatory shifts toward environmentally responsible packaging materials.
Strategic partnerships and collaborations between local manufacturers and international industries amplify presence of North Jeolla in the global paper industry. Leveraging these strengths, the region capitalizes on emerging industry trends, technological advancements, and sustainable practices, paving the way for continued growth and prominence in the machine glazed paper sector.
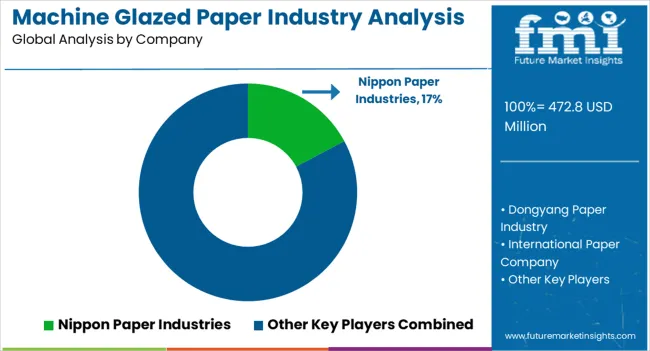
The competitive landscape within Korea machine glazed paper industry is characterized by a blend of established players and emerging manufacturers striving for industry prominence. Key companies leverage technological advancements to produce high quality, eco friendly papers, meeting diverse packaging demands.
Continuous innovation in manufacturing processes and a focus on sustainable solutions define the competitive edge. Intense competition fosters advancements in product quality, cost efficiency, and customization.
Strategic collaborations and expansions into new industry segments reflect the dynamism, shaping a competitive arena where innovation, sustainability, and meeting specific customer needs are pivotal for success in Korea machine glazed paper industry.
Product Portfolio
Attribute | Details |
---|---|
Estimated Industry Size in 2024 | USD 447.3 million |
Projected Industry Size in 2034 | USD 779.3 million |
Attributed CAGR between 2024 and 2034 | 5.70% CAGR |
Historical Analysis of Demand for Machine Glazed Paper in Korea Regions | 2019 to 2023 |
Forecast Period | 2024 to 2034 |
Report Coverage | Industry size, industry trends, analysis of key factors influencing Machine Glazed Paper in Korea, insights on global players and their industry strategy in Korea, ecosystem analysis of local and regional Korea providers. |
Key Regions within Korea Analyzed while Studying Opportunities for Machine Glazed Paper in Korea | South Gyeongsang; North Jeolla; South Jeolla; Jeju; Rest of Korea |
Key Companies Profiled | Dongyang Paper Industry; International Paper Company; Nippon Paper Industries; Stora Enso; Smurfit Kappa Group; Mondi Group; Heinzel Group; Burgo Group; SCG Packaging; Verso Corporation |
Table 1: Industry Analysis and Outlook Value (US$ Million) Forecast by Region, 2019 to 2034
Table 2: Industry Analysis and Outlook Volume (Tons) Forecast by Region, 2019 to 2034
Table 3: Industry Analysis and Outlook Value (US$ Million) Forecast by Basis Weight, 2019 to 2034
Table 4: Industry Analysis and Outlook Volume (Tons) Forecast by Basis Weight, 2019 to 2034
Table 5: Industry Analysis and Outlook Value (US$ Million) Forecast by Paper Type, 2019 to 2034
Table 6: Industry Analysis and Outlook Volume (Tons) Forecast by Paper Type, 2019 to 2034
Table 7: Industry Analysis and Outlook Value (US$ Million) Forecast by Grade, 2019 to 2034
Table 8: Industry Analysis and Outlook Volume (Tons) Forecast by Grade, 2019 to 2034
Table 9: Industry Analysis and Outlook Value (US$ Million) Forecast by Application, 2019 to 2034
Table 10: Industry Analysis and Outlook Volume (Tons) Forecast by Application, 2019 to 2034
Table 11: Industry Analysis and Outlook Value (US$ Million) Forecast by End User, 2019 to 2034
Table 12: Industry Analysis and Outlook Volume (Tons) Forecast by End User, 2019 to 2034
Table 13: South Gyeongsang Industry Analysis and Outlook Value (US$ Million) Forecast by Basis Weight, 2019 to 2034
Table 14: South Gyeongsang Industry Analysis and Outlook Volume (Tons) Forecast by Basis Weight, 2019 to 2034
Table 15: South Gyeongsang Industry Analysis and Outlook Value (US$ Million) Forecast by Paper Type, 2019 to 2034
Table 16: South Gyeongsang Industry Analysis and Outlook Volume (Tons) Forecast by Paper Type, 2019 to 2034
Table 17: South Gyeongsang Industry Analysis and Outlook Value (US$ Million) Forecast by Grade, 2019 to 2034
Table 18: South Gyeongsang Industry Analysis and Outlook Volume (Tons) Forecast by Grade, 2019 to 2034
Table 19: South Gyeongsang Industry Analysis and Outlook Value (US$ Million) Forecast by Application, 2019 to 2034
Table 20: South Gyeongsang Industry Analysis and Outlook Volume (Tons) Forecast by Application, 2019 to 2034
Table 21: South Gyeongsang Industry Analysis and Outlook Value (US$ Million) Forecast by End User, 2019 to 2034
Table 22: South Gyeongsang Industry Analysis and Outlook Volume (Tons) Forecast by End User, 2019 to 2034
Table 23: North Jeolla Industry Analysis and Outlook Value (US$ Million) Forecast by Basis Weight, 2019 to 2034
Table 24: North Jeolla Industry Analysis and Outlook Volume (Tons) Forecast by Basis Weight, 2019 to 2034
Table 25: North Jeolla Industry Analysis and Outlook Value (US$ Million) Forecast by Paper Type, 2019 to 2034
Table 26: North Jeolla Industry Analysis and Outlook Volume (Tons) Forecast by Paper Type, 2019 to 2034
Table 27: North Jeolla Industry Analysis and Outlook Value (US$ Million) Forecast by Grade, 2019 to 2034
Table 28: North Jeolla Industry Analysis and Outlook Volume (Tons) Forecast by Grade, 2019 to 2034
Table 29: North Jeolla Industry Analysis and Outlook Value (US$ Million) Forecast by Application, 2019 to 2034
Table 30: North Jeolla Industry Analysis and Outlook Volume (Tons) Forecast by Application, 2019 to 2034
Table 31: North Jeolla Industry Analysis and Outlook Value (US$ Million) Forecast by End User, 2019 to 2034
Table 32: North Jeolla Industry Analysis and Outlook Volume (Tons) Forecast by End User, 2019 to 2034
Table 33: South Jeolla Industry Analysis and Outlook Value (US$ Million) Forecast by Basis Weight, 2019 to 2034
Table 34: South Jeolla Industry Analysis and Outlook Volume (Tons) Forecast by Basis Weight, 2019 to 2034
Table 35: South Jeolla Industry Analysis and Outlook Value (US$ Million) Forecast by Paper Type, 2019 to 2034
Table 36: South Jeolla Industry Analysis and Outlook Volume (Tons) Forecast by Paper Type, 2019 to 2034
Table 37: South Jeolla Industry Analysis and Outlook Value (US$ Million) Forecast by Grade, 2019 to 2034
Table 38: South Jeolla Industry Analysis and Outlook Volume (Tons) Forecast by Grade, 2019 to 2034
Table 39: South Jeolla Industry Analysis and Outlook Value (US$ Million) Forecast by Application, 2019 to 2034
Table 40: South Jeolla Industry Analysis and Outlook Volume (Tons) Forecast by Application, 2019 to 2034
Table 41: South Jeolla Industry Analysis and Outlook Value (US$ Million) Forecast by End User, 2019 to 2034
Table 42: South Jeolla Industry Analysis and Outlook Volume (Tons) Forecast by End User, 2019 to 2034
Table 43: Jeju Industry Analysis and Outlook Value (US$ Million) Forecast by Basis Weight, 2019 to 2034
Table 44: Jeju Industry Analysis and Outlook Volume (Tons) Forecast by Basis Weight, 2019 to 2034
Table 45: Jeju Industry Analysis and Outlook Value (US$ Million) Forecast by Paper Type, 2019 to 2034
Table 46: Jeju Industry Analysis and Outlook Volume (Tons) Forecast by Paper Type, 2019 to 2034
Table 47: Jeju Industry Analysis and Outlook Value (US$ Million) Forecast by Grade, 2019 to 2034
Table 48: Jeju Industry Analysis and Outlook Volume (Tons) Forecast by Grade, 2019 to 2034
Table 49: Jeju Industry Analysis and Outlook Value (US$ Million) Forecast by Application, 2019 to 2034
Table 50: Jeju Industry Analysis and Outlook Volume (Tons) Forecast by Application, 2019 to 2034
Table 51: Jeju Industry Analysis and Outlook Value (US$ Million) Forecast by End User, 2019 to 2034
Table 52: Jeju Industry Analysis and Outlook Volume (Tons) Forecast by End User, 2019 to 2034
Table 53: Rest of Industry Analysis and Outlook Value (US$ Million) Forecast by Basis Weight, 2019 to 2034
Table 54: Rest of Industry Analysis and Outlook Volume (Tons) Forecast by Basis Weight, 2019 to 2034
Table 55: Rest of Industry Analysis and Outlook Value (US$ Million) Forecast by Paper Type, 2019 to 2034
Table 56: Rest of Industry Analysis and Outlook Volume (Tons) Forecast by Paper Type, 2019 to 2034
Table 57: Rest of Industry Analysis and Outlook Value (US$ Million) Forecast by Grade, 2019 to 2034
Table 58: Rest of Industry Analysis and Outlook Volume (Tons) Forecast by Grade, 2019 to 2034
Table 59: Rest of Industry Analysis and Outlook Value (US$ Million) Forecast by Application, 2019 to 2034
Table 60: Rest of Industry Analysis and Outlook Volume (Tons) Forecast by Application, 2019 to 2034
Table 61: Rest of Industry Analysis and Outlook Value (US$ Million) Forecast by End User, 2019 to 2034
Table 62: Rest of Industry Analysis and Outlook Volume (Tons) Forecast by End User, 2019 to 2034
Figure 1: Industry Analysis and Outlook Value (US$ Million) by Basis Weight, 2024 to 2034
Figure 2: Industry Analysis and Outlook Value (US$ Million) by Paper Type, 2024 to 2034
Figure 3: Industry Analysis and Outlook Value (US$ Million) by Grade, 2024 to 2034
Figure 4: Industry Analysis and Outlook Value (US$ Million) by Application, 2024 to 2034
Figure 5: Industry Analysis and Outlook Value (US$ Million) by End User, 2024 to 2034
Figure 6: Industry Analysis and Outlook Value (US$ Million) by Region, 2024 to 2034
Figure 7: Industry Analysis and Outlook Value (US$ Million) Analysis by Region, 2019 to 2034
Figure 8: Industry Analysis and Outlook Volume (Tons) Analysis by Region, 2019 to 2034
Figure 9: Industry Analysis and Outlook Value Share (%) and BPS Analysis by Region, 2024 to 2034
Figure 10: Industry Analysis and Outlook Y-o-Y Growth (%) Projections by Region, 2024 to 2034
Figure 11: Industry Analysis and Outlook Value (US$ Million) Analysis by Basis Weight, 2019 to 2034
Figure 12: Industry Analysis and Outlook Volume (Tons) Analysis by Basis Weight, 2019 to 2034
Figure 13: Industry Analysis and Outlook Value Share (%) and BPS Analysis by Basis Weight, 2024 to 2034
Figure 14: Industry Analysis and Outlook Y-o-Y Growth (%) Projections by Basis Weight, 2024 to 2034
Figure 15: Industry Analysis and Outlook Value (US$ Million) Analysis by Paper Type, 2019 to 2034
Figure 16: Industry Analysis and Outlook Volume (Tons) Analysis by Paper Type, 2019 to 2034
Figure 17: Industry Analysis and Outlook Value Share (%) and BPS Analysis by Paper Type, 2024 to 2034
Figure 18: Industry Analysis and Outlook Y-o-Y Growth (%) Projections by Paper Type, 2024 to 2034
Figure 19: Industry Analysis and Outlook Value (US$ Million) Analysis by Grade, 2019 to 2034
Figure 20: Industry Analysis and Outlook Volume (Tons) Analysis by Grade, 2019 to 2034
Figure 21: Industry Analysis and Outlook Value Share (%) and BPS Analysis by Grade, 2024 to 2034
Figure 22: Industry Analysis and Outlook Y-o-Y Growth (%) Projections by Grade, 2024 to 2034
Figure 23: Industry Analysis and Outlook Value (US$ Million) Analysis by Application, 2019 to 2034
Figure 24: Industry Analysis and Outlook Volume (Tons) Analysis by Application, 2019 to 2034
Figure 25: Industry Analysis and Outlook Value Share (%) and BPS Analysis by Application, 2024 to 2034
Figure 26: Industry Analysis and Outlook Y-o-Y Growth (%) Projections by Application, 2024 to 2034
Figure 27: Industry Analysis and Outlook Value (US$ Million) Analysis by End User, 2019 to 2034
Figure 28: Industry Analysis and Outlook Volume (Tons) Analysis by End User, 2019 to 2034
Figure 29: Industry Analysis and Outlook Value Share (%) and BPS Analysis by End User, 2024 to 2034
Figure 30: Industry Analysis and Outlook Y-o-Y Growth (%) Projections by End User, 2024 to 2034
Figure 31: Industry Analysis and Outlook Attractiveness by Basis Weight, 2024 to 2034
Figure 32: Industry Analysis and Outlook Attractiveness by Paper Type, 2024 to 2034
Figure 33: Industry Analysis and Outlook Attractiveness by Grade, 2024 to 2034
Figure 34: Industry Analysis and Outlook Attractiveness by Application, 2024 to 2034
Figure 35: Industry Analysis and Outlook Attractiveness by End User, 2024 to 2034
Figure 36: Industry Analysis and Outlook Attractiveness by Region, 2024 to 2034
Figure 37: South Gyeongsang Industry Analysis and Outlook Value (US$ Million) by Basis Weight, 2024 to 2034
Figure 38: South Gyeongsang Industry Analysis and Outlook Value (US$ Million) by Paper Type, 2024 to 2034
Figure 39: South Gyeongsang Industry Analysis and Outlook Value (US$ Million) by Grade, 2024 to 2034
Figure 40: South Gyeongsang Industry Analysis and Outlook Value (US$ Million) by Application, 2024 to 2034
Figure 41: South Gyeongsang Industry Analysis and Outlook Value (US$ Million) by End User, 2024 to 2034
Figure 42: South Gyeongsang Industry Analysis and Outlook Value (US$ Million) Analysis by Basis Weight, 2019 to 2034
Figure 43: South Gyeongsang Industry Analysis and Outlook Volume (Tons) Analysis by Basis Weight, 2019 to 2034
Figure 44: South Gyeongsang Industry Analysis and Outlook Value Share (%) and BPS Analysis by Basis Weight, 2024 to 2034
Figure 45: South Gyeongsang Industry Analysis and Outlook Y-o-Y Growth (%) Projections by Basis Weight, 2024 to 2034
Figure 46: South Gyeongsang Industry Analysis and Outlook Value (US$ Million) Analysis by Paper Type, 2019 to 2034
Figure 47: South Gyeongsang Industry Analysis and Outlook Volume (Tons) Analysis by Paper Type, 2019 to 2034
Figure 48: South Gyeongsang Industry Analysis and Outlook Value Share (%) and BPS Analysis by Paper Type, 2024 to 2034
Figure 49: South Gyeongsang Industry Analysis and Outlook Y-o-Y Growth (%) Projections by Paper Type, 2024 to 2034
Figure 50: South Gyeongsang Industry Analysis and Outlook Value (US$ Million) Analysis by Grade, 2019 to 2034
Figure 51: South Gyeongsang Industry Analysis and Outlook Volume (Tons) Analysis by Grade, 2019 to 2034
Figure 52: South Gyeongsang Industry Analysis and Outlook Value Share (%) and BPS Analysis by Grade, 2024 to 2034
Figure 53: South Gyeongsang Industry Analysis and Outlook Y-o-Y Growth (%) Projections by Grade, 2024 to 2034
Figure 54: South Gyeongsang Industry Analysis and Outlook Value (US$ Million) Analysis by Application, 2019 to 2034
Figure 55: South Gyeongsang Industry Analysis and Outlook Volume (Tons) Analysis by Application, 2019 to 2034
Figure 56: South Gyeongsang Industry Analysis and Outlook Value Share (%) and BPS Analysis by Application, 2024 to 2034
Figure 57: South Gyeongsang Industry Analysis and Outlook Y-o-Y Growth (%) Projections by Application, 2024 to 2034
Figure 58: South Gyeongsang Industry Analysis and Outlook Value (US$ Million) Analysis by End User, 2019 to 2034
Figure 59: South Gyeongsang Industry Analysis and Outlook Volume (Tons) Analysis by End User, 2019 to 2034
Figure 60: South Gyeongsang Industry Analysis and Outlook Value Share (%) and BPS Analysis by End User, 2024 to 2034
Figure 61: South Gyeongsang Industry Analysis and Outlook Y-o-Y Growth (%) Projections by End User, 2024 to 2034
Figure 62: South Gyeongsang Industry Analysis and Outlook Attractiveness by Basis Weight, 2024 to 2034
Figure 63: South Gyeongsang Industry Analysis and Outlook Attractiveness by Paper Type, 2024 to 2034
Figure 64: South Gyeongsang Industry Analysis and Outlook Attractiveness by Grade, 2024 to 2034
Figure 65: South Gyeongsang Industry Analysis and Outlook Attractiveness by Application, 2024 to 2034
Figure 66: South Gyeongsang Industry Analysis and Outlook Attractiveness by End User, 2024 to 2034
Figure 67: North Jeolla Industry Analysis and Outlook Value (US$ Million) by Basis Weight, 2024 to 2034
Figure 68: North Jeolla Industry Analysis and Outlook Value (US$ Million) by Paper Type, 2024 to 2034
Figure 69: North Jeolla Industry Analysis and Outlook Value (US$ Million) by Grade, 2024 to 2034
Figure 70: North Jeolla Industry Analysis and Outlook Value (US$ Million) by Application, 2024 to 2034
Figure 71: North Jeolla Industry Analysis and Outlook Value (US$ Million) by End User, 2024 to 2034
Figure 72: North Jeolla Industry Analysis and Outlook Value (US$ Million) Analysis by Basis Weight, 2019 to 2034
Figure 73: North Jeolla Industry Analysis and Outlook Volume (Tons) Analysis by Basis Weight, 2019 to 2034
Figure 74: North Jeolla Industry Analysis and Outlook Value Share (%) and BPS Analysis by Basis Weight, 2024 to 2034
Figure 75: North Jeolla Industry Analysis and Outlook Y-o-Y Growth (%) Projections by Basis Weight, 2024 to 2034
Figure 76: North Jeolla Industry Analysis and Outlook Value (US$ Million) Analysis by Paper Type, 2019 to 2034
Figure 77: North Jeolla Industry Analysis and Outlook Volume (Tons) Analysis by Paper Type, 2019 to 2034
Figure 78: North Jeolla Industry Analysis and Outlook Value Share (%) and BPS Analysis by Paper Type, 2024 to 2034
Figure 79: North Jeolla Industry Analysis and Outlook Y-o-Y Growth (%) Projections by Paper Type, 2024 to 2034
Figure 80: North Jeolla Industry Analysis and Outlook Value (US$ Million) Analysis by Grade, 2019 to 2034
Figure 81: North Jeolla Industry Analysis and Outlook Volume (Tons) Analysis by Grade, 2019 to 2034
Figure 82: North Jeolla Industry Analysis and Outlook Value Share (%) and BPS Analysis by Grade, 2024 to 2034
Figure 83: North Jeolla Industry Analysis and Outlook Y-o-Y Growth (%) Projections by Grade, 2024 to 2034
Figure 84: North Jeolla Industry Analysis and Outlook Value (US$ Million) Analysis by Application, 2019 to 2034
Figure 85: North Jeolla Industry Analysis and Outlook Volume (Tons) Analysis by Application, 2019 to 2034
Figure 86: North Jeolla Industry Analysis and Outlook Value Share (%) and BPS Analysis by Application, 2024 to 2034
Figure 87: North Jeolla Industry Analysis and Outlook Y-o-Y Growth (%) Projections by Application, 2024 to 2034
Figure 88: North Jeolla Industry Analysis and Outlook Value (US$ Million) Analysis by End User, 2019 to 2034
Figure 89: North Jeolla Industry Analysis and Outlook Volume (Tons) Analysis by End User, 2019 to 2034
Figure 90: North Jeolla Industry Analysis and Outlook Value Share (%) and BPS Analysis by End User, 2024 to 2034
Figure 91: North Jeolla Industry Analysis and Outlook Y-o-Y Growth (%) Projections by End User, 2024 to 2034
Figure 92: North Jeolla Industry Analysis and Outlook Attractiveness by Basis Weight, 2024 to 2034
Figure 93: North Jeolla Industry Analysis and Outlook Attractiveness by Paper Type, 2024 to 2034
Figure 94: North Jeolla Industry Analysis and Outlook Attractiveness by Grade, 2024 to 2034
Figure 95: North Jeolla Industry Analysis and Outlook Attractiveness by Application, 2024 to 2034
Figure 96: North Jeolla Industry Analysis and Outlook Attractiveness by End User, 2024 to 2034
Figure 97: South Jeolla Industry Analysis and Outlook Value (US$ Million) by Basis Weight, 2024 to 2034
Figure 98: South Jeolla Industry Analysis and Outlook Value (US$ Million) by Paper Type, 2024 to 2034
Figure 99: South Jeolla Industry Analysis and Outlook Value (US$ Million) by Grade, 2024 to 2034
Figure 100: South Jeolla Industry Analysis and Outlook Value (US$ Million) by Application, 2024 to 2034
Figure 101: South Jeolla Industry Analysis and Outlook Value (US$ Million) by End User, 2024 to 2034
Figure 102: South Jeolla Industry Analysis and Outlook Value (US$ Million) Analysis by Basis Weight, 2019 to 2034
Figure 103: South Jeolla Industry Analysis and Outlook Volume (Tons) Analysis by Basis Weight, 2019 to 2034
Figure 104: South Jeolla Industry Analysis and Outlook Value Share (%) and BPS Analysis by Basis Weight, 2024 to 2034
Figure 105: South Jeolla Industry Analysis and Outlook Y-o-Y Growth (%) Projections by Basis Weight, 2024 to 2034
Figure 106: South Jeolla Industry Analysis and Outlook Value (US$ Million) Analysis by Paper Type, 2019 to 2034
Figure 107: South Jeolla Industry Analysis and Outlook Volume (Tons) Analysis by Paper Type, 2019 to 2034
Figure 108: South Jeolla Industry Analysis and Outlook Value Share (%) and BPS Analysis by Paper Type, 2024 to 2034
Figure 109: South Jeolla Industry Analysis and Outlook Y-o-Y Growth (%) Projections by Paper Type, 2024 to 2034
Figure 110: South Jeolla Industry Analysis and Outlook Value (US$ Million) Analysis by Grade, 2019 to 2034
Figure 111: South Jeolla Industry Analysis and Outlook Volume (Tons) Analysis by Grade, 2019 to 2034
Figure 112: South Jeolla Industry Analysis and Outlook Value Share (%) and BPS Analysis by Grade, 2024 to 2034
Figure 113: South Jeolla Industry Analysis and Outlook Y-o-Y Growth (%) Projections by Grade, 2024 to 2034
Figure 114: South Jeolla Industry Analysis and Outlook Value (US$ Million) Analysis by Application, 2019 to 2034
Figure 115: South Jeolla Industry Analysis and Outlook Volume (Tons) Analysis by Application, 2019 to 2034
Figure 116: South Jeolla Industry Analysis and Outlook Value Share (%) and BPS Analysis by Application, 2024 to 2034
Figure 117: South Jeolla Industry Analysis and Outlook Y-o-Y Growth (%) Projections by Application, 2024 to 2034
Figure 118: South Jeolla Industry Analysis and Outlook Value (US$ Million) Analysis by End User, 2019 to 2034
Figure 119: South Jeolla Industry Analysis and Outlook Volume (Tons) Analysis by End User, 2019 to 2034
Figure 120: South Jeolla Industry Analysis and Outlook Value Share (%) and BPS Analysis by End User, 2024 to 2034
Figure 121: South Jeolla Industry Analysis and Outlook Y-o-Y Growth (%) Projections by End User, 2024 to 2034
Figure 122: South Jeolla Industry Analysis and Outlook Attractiveness by Basis Weight, 2024 to 2034
Figure 123: South Jeolla Industry Analysis and Outlook Attractiveness by Paper Type, 2024 to 2034
Figure 124: South Jeolla Industry Analysis and Outlook Attractiveness by Grade, 2024 to 2034
Figure 125: South Jeolla Industry Analysis and Outlook Attractiveness by Application, 2024 to 2034
Figure 126: South Jeolla Industry Analysis and Outlook Attractiveness by End User, 2024 to 2034
Figure 127: Jeju Industry Analysis and Outlook Value (US$ Million) by Basis Weight, 2024 to 2034
Figure 128: Jeju Industry Analysis and Outlook Value (US$ Million) by Paper Type, 2024 to 2034
Figure 129: Jeju Industry Analysis and Outlook Value (US$ Million) by Grade, 2024 to 2034
Figure 130: Jeju Industry Analysis and Outlook Value (US$ Million) by Application, 2024 to 2034
Figure 131: Jeju Industry Analysis and Outlook Value (US$ Million) by End User, 2024 to 2034
Figure 132: Jeju Industry Analysis and Outlook Value (US$ Million) Analysis by Basis Weight, 2019 to 2034
Figure 133: Jeju Industry Analysis and Outlook Volume (Tons) Analysis by Basis Weight, 2019 to 2034
Figure 134: Jeju Industry Analysis and Outlook Value Share (%) and BPS Analysis by Basis Weight, 2024 to 2034
Figure 135: Jeju Industry Analysis and Outlook Y-o-Y Growth (%) Projections by Basis Weight, 2024 to 2034
Figure 136: Jeju Industry Analysis and Outlook Value (US$ Million) Analysis by Paper Type, 2019 to 2034
Figure 137: Jeju Industry Analysis and Outlook Volume (Tons) Analysis by Paper Type, 2019 to 2034
Figure 138: Jeju Industry Analysis and Outlook Value Share (%) and BPS Analysis by Paper Type, 2024 to 2034
Figure 139: Jeju Industry Analysis and Outlook Y-o-Y Growth (%) Projections by Paper Type, 2024 to 2034
Figure 140: Jeju Industry Analysis and Outlook Value (US$ Million) Analysis by Grade, 2019 to 2034
Figure 141: Jeju Industry Analysis and Outlook Volume (Tons) Analysis by Grade, 2019 to 2034
Figure 142: Jeju Industry Analysis and Outlook Value Share (%) and BPS Analysis by Grade, 2024 to 2034
Figure 143: Jeju Industry Analysis and Outlook Y-o-Y Growth (%) Projections by Grade, 2024 to 2034
Figure 144: Jeju Industry Analysis and Outlook Value (US$ Million) Analysis by Application, 2019 to 2034
Figure 145: Jeju Industry Analysis and Outlook Volume (Tons) Analysis by Application, 2019 to 2034
Figure 146: Jeju Industry Analysis and Outlook Value Share (%) and BPS Analysis by Application, 2024 to 2034
Figure 147: Jeju Industry Analysis and Outlook Y-o-Y Growth (%) Projections by Application, 2024 to 2034
Figure 148: Jeju Industry Analysis and Outlook Value (US$ Million) Analysis by End User, 2019 to 2034
Figure 149: Jeju Industry Analysis and Outlook Volume (Tons) Analysis by End User, 2019 to 2034
Figure 150: Jeju Industry Analysis and Outlook Value Share (%) and BPS Analysis by End User, 2024 to 2034
Figure 151: Jeju Industry Analysis and Outlook Y-o-Y Growth (%) Projections by End User, 2024 to 2034
Figure 152: Jeju Industry Analysis and Outlook Attractiveness by Basis Weight, 2024 to 2034
Figure 153: Jeju Industry Analysis and Outlook Attractiveness by Paper Type, 2024 to 2034
Figure 154: Jeju Industry Analysis and Outlook Attractiveness by Grade, 2024 to 2034
Figure 155: Jeju Industry Analysis and Outlook Attractiveness by Application, 2024 to 2034
Figure 156: Jeju Industry Analysis and Outlook Attractiveness by End User, 2024 to 2034
Figure 157: Rest of Industry Analysis and Outlook Value (US$ Million) by Basis Weight, 2024 to 2034
Figure 158: Rest of Industry Analysis and Outlook Value (US$ Million) by Paper Type, 2024 to 2034
Figure 159: Rest of Industry Analysis and Outlook Value (US$ Million) by Grade, 2024 to 2034
Figure 160: Rest of Industry Analysis and Outlook Value (US$ Million) by Application, 2024 to 2034
Figure 161: Rest of Industry Analysis and Outlook Value (US$ Million) by End User, 2024 to 2034
Figure 162: Rest of Industry Analysis and Outlook Value (US$ Million) Analysis by Basis Weight, 2019 to 2034
Figure 163: Rest of Industry Analysis and Outlook Volume (Tons) Analysis by Basis Weight, 2019 to 2034
Figure 164: Rest of Industry Analysis and Outlook Value Share (%) and BPS Analysis by Basis Weight, 2024 to 2034
Figure 165: Rest of Industry Analysis and Outlook Y-o-Y Growth (%) Projections by Basis Weight, 2024 to 2034
Figure 166: Rest of Industry Analysis and Outlook Value (US$ Million) Analysis by Paper Type, 2019 to 2034
Figure 167: Rest of Industry Analysis and Outlook Volume (Tons) Analysis by Paper Type, 2019 to 2034
Figure 168: Rest of Industry Analysis and Outlook Value Share (%) and BPS Analysis by Paper Type, 2024 to 2034
Figure 169: Rest of Industry Analysis and Outlook Y-o-Y Growth (%) Projections by Paper Type, 2024 to 2034
Figure 170: Rest of Industry Analysis and Outlook Value (US$ Million) Analysis by Grade, 2019 to 2034
Figure 171: Rest of Industry Analysis and Outlook Volume (Tons) Analysis by Grade, 2019 to 2034
Figure 172: Rest of Industry Analysis and Outlook Value Share (%) and BPS Analysis by Grade, 2024 to 2034
Figure 173: Rest of Industry Analysis and Outlook Y-o-Y Growth (%) Projections by Grade, 2024 to 2034
Figure 174: Rest of Industry Analysis and Outlook Value (US$ Million) Analysis by Application, 2019 to 2034
Figure 175: Rest of Industry Analysis and Outlook Volume (Tons) Analysis by Application, 2019 to 2034
Figure 176: Rest of Industry Analysis and Outlook Value Share (%) and BPS Analysis by Application, 2024 to 2034
Figure 177: Rest of Industry Analysis and Outlook Y-o-Y Growth (%) Projections by Application, 2024 to 2034
Figure 178: Rest of Industry Analysis and Outlook Value (US$ Million) Analysis by End User, 2019 to 2034
Figure 179: Rest of Industry Analysis and Outlook Volume (Tons) Analysis by End User, 2019 to 2034
Figure 180: Rest of Industry Analysis and Outlook Value Share (%) and BPS Analysis by End User, 2024 to 2034
Figure 181: Rest of Industry Analysis and Outlook Y-o-Y Growth (%) Projections by End User, 2024 to 2034
Figure 182: Rest of Industry Analysis and Outlook Attractiveness by Basis Weight, 2024 to 2034
Figure 183: Rest of Industry Analysis and Outlook Attractiveness by Paper Type, 2024 to 2034
Figure 184: Rest of Industry Analysis and Outlook Attractiveness by Grade, 2024 to 2034
Figure 185: Rest of Industry Analysis and Outlook Attractiveness by Application, 2024 to 2034
Figure 186: Rest of Industry Analysis and Outlook Attractiveness by End User, 2024 to 2034
The sales of machine glazed paper are poised to reach USD 447.3 million by 2024 in Korea.
In 2034, the total value of the machine glazed paper ecosystem in Korea will reach USD 779.3 million.
From 2024 to 2034, the Korea machine glazed paper industry is likely to garner a 5.70% CAGR.
The kraft paper segment will be highly used all across Korea, registering an industry share of 80.00%.
Explore Paper Packaging Insights
Thank you!
You will receive an email from our Business Development Manager. Please be sure to check your SPAM/JUNK folder too.