Machine Glazed Paper Market Size and Share Forecast Outlook 2025 to 2035

The machine-glazed paper market is estimated to be valued at USD 14.9 billion in 2025. It is projected to reach USD 23.4 billion by 2035, registering a compound annual growth rate (CAGR) of 4.6% over the forecast period. The market is projected to add an absolute dollar opportunity of USD 8.5 billion over the forecast period. This reflects a 1.57 times growth at a compound annual growth rate of 4.6%. The market's evolution is expected to be shaped by rising sustainability consciousness, increasing adoption of eco-friendly packaging solutions, and growing demand for food-grade packaging materials, particularly where moisture resistance and grease-proof properties are required.

By 2030, the market is likely to reach USD 18.7 billion, accounting for USD 3.8 billion in incremental value over the first half of the decade. The remaining USD 4.6 billion is expected to be received during the second half, suggesting a moderately back-loaded growth pattern. Product innovation in specialized kraft paper formulations and enhanced glazing technologies is gaining traction due to machine-glazed paper's superior printability and packaging versatility.

Companies such as Mondi Group and BillerudKorsnas AB are advancing their competitive positions through investment in sustainable production technologies and premium product formulations. E-commerce packaging trends and food safety regulations are supporting expansion into retail packaging, industrial applications, and consumer goods sectors. Market performance will remain anchored in quality standards, environmental compliance, and sustainable sourcing benchmarks.

Machine Glazed Paper Market Value Analysis

Quick Stats for Machine Glazed Paper Market

  • Machine Glazed Paper Market Value (2025): USD 14.9 billion
  • Machine Glazed Paper Market Forecast Value (2035): USD 23.4 billion
  • Machine Glazed Paper Market Forecast CAGR: 4.6%
  • Leading Segment in Machine Glazed Paper Market (2025): Kraft Paper (60% market share)
  • Key Growth Regions in Machine Glazed Paper Market: Asia-Pacific, Europe, North America
  • Top Players in Machine Glazed Paper Market: Smurfit Kappa Group, Nippon Paper Industries Co., Ltd, Stora Enso Oyj, Mondi Group Plc, BillerudKorsnas AB, Heinzel Group, Gascogne Papier SAS, Twin Rivers Paper Company, Burgo Group Spa, SCG Packaging, BPM Inc, Mosaico S.p.A.

Machine Glazed Paper Market

Metric Value
Estimated Size (2025E) USD 14.9 billion
Projected Value (2035F) USD 23.4 billion
CAGR (2025 to 2035) 4.6%

The market holds a substantial share across its parent markets. Within the global paper packaging market, it accounts for 12% due to its specialized properties. In the food-grade packaging segment, it commands a 15% share, supported by rising food safety requirements. It contributes nearly 8% to the industrial packaging market and 18% to the kraft paper category. In sustainable packaging solutions, machine-glazed paper holds around 14% share, driven by its recyclable and biodegradable benefits. Across the specialty paper market, its share is close to 22%, owing to its use in premium packaging applications and industrial formulations.

The market is undergoing a strategic transformation driven by rising demand for sustainable, food-safe, and versatile packaging solutions. Advanced glazing technologies using controlled calendering, moisture management, and innovative surface treatments have enhanced printability, barrier properties, and product versatility, making machine-glazed paper products viable alternatives to plastic packaging materials. Manufacturers are introducing specialized formulations, including grease-resistant coatings and enhanced barrier papers tailored for specific end-use applications, expanding their role beyond basic packaging functionality. Strategic collaborations between paper producers and packaging technology companies have accelerated innovation in product development and market penetration.

Why is the Machine Glazed Paper Market Growing?

Machine-glazed paper's exceptional barrier properties, high printability, and sustainable characteristics make it an attractive packaging solution for food manufacturers and consumer goods companies seeking eco-friendly, food-safe packaging alternatives. Its moisture resistance, grease-proof surface, and natural biodegradable composition appeal to companies prioritizing environmental compliance and consumer safety in packaging applications.

Growing awareness of plastic pollution, circular economy principles, and sustainable packaging regulations is further propelling adoption, especially in food service, retail packaging, and industrial applications. Rising e-commerce volumes, expanding food processing industries, and government initiatives supporting paper-based packaging solutions are also enhancing product accessibility and market penetration.

As sustainability trends accelerate across industries and environmental regulations become stricter, the market outlook remains favorable. With manufacturers and consumers prioritizing renewable materials, recyclable solutions, and food safety compliance, machine-glazed paper is well-positioned to expand across various packaging, industrial, and consumer applications.

Segmental Analysis

The market is segmented by basis weight, paper type, application, grade, end use,and region. In terms of basis weight, the market is dividedinto up to 40 GSM, 41 to 70 GSM, 71 to 100 GSM, and above 100 GSM. By paper type, the market is bifurcated into kraft paper and tissue paper. By application, the market is categorized into bags & pouches, sacks, wraps, labels & release liners, envelopes, coating & lamination, trays/cups/bowls, and others.

By grade, the market is bifurcated into bleached and unbleached variants. By end use, the market is classified into food & beverages, healthcare, electrical & electronics, automotive, personal care & cosmetics, textile, building & construction, and household. Regionally, the market is divided into North America, Europe, Asia-Pacific, Latin America, and the Middle East & Africa.
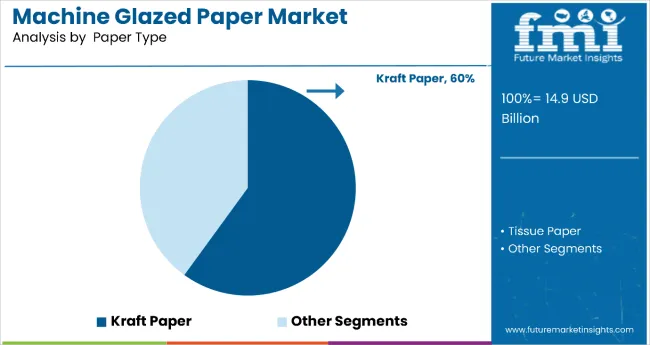
By Paper Type, Kraft Paper Segment Accounts for 60% of the Market Share

Machine Glazed Paper Market By Paper Type

The kraft paper segment holds a dominant position with 60% of the market share in the paper type category, owing to its superior strength characteristics, natural brown appearance, and enhanced durability properties. Kraft-based machine-glazed paper is widely used across packaging and industrial applications due to its high tensile strength, tear resistance, and moisture barrier properties that appeal to food manufacturers and industrial packaging companies alike.

It enables manufacturers to deliver robust packaging solutions while maintaining cost-effectiveness and environmental compliance in final products. As demand for sustainable, heavy-duty packaging solutions grows, the kraft paper form continues to gain preference in both consumer packaging and industrial applications.

Manufacturers are investing in advanced kraft pulping technologies, quality control systems, and sustainable sourcing practices to enhance strength, printability, and environmental credentials. The segment is poised to expand further as global consumer preferences favor natural, unbleached, and high-strength paper formats.

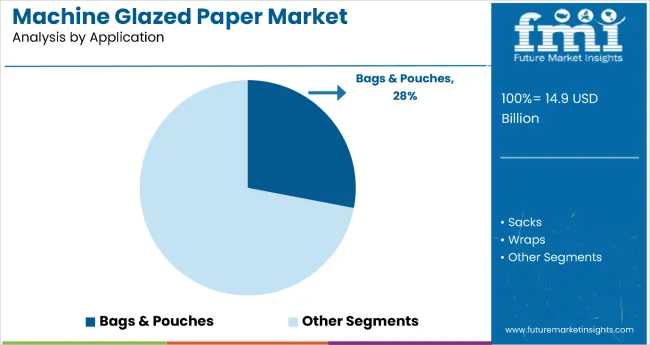
By Application, Bags & Pouches Segment Accounts for 28% of the Market Share

Machine Glazed Paper Market By Application

Bags & pouches remain a core application segment, accounting for 28% of the market share in 2025, as machine-glazed paper enhances barrier properties, printability, and consumer appeal in retail packaging, food service applications, and consumer goods packaging. Its functional versatility supports product innovation in flexible packaging, stand-up pouches, and premium retail bags.

Machine-glazed paper also improves moisture resistance and grease-proof performance in food packaging applications, while offering recyclable content without compromising functionality. This makes it indispensable in modern retail and food service environments.

Ongoing demand for sustainable packaging solutions and the premiumization of consumer goods packaging are key trends driving the sustained relevance of machine-glazed paper in this application.

What are the Drivers, Restraints, and Key Trends of the Machine Glazed Paper Market?

In 2024, global machine-glazed paper consumption grew by 12% year-on-year, with Asia-Pacific taking a 42% share. Applications include food packaging, industrial bags, and consumer goods packaging. Manufacturers are introducing specialized glazing technologies and barrier-enhanced variants that deliver superior moisture resistance and printability. Sustainable formulations now support eco-certification positioning. Environmental consciousness and a preference for reducing plastic support consumer confidence. Technology providers increasingly supply ready-to-use paper grades with integrated barrier properties to minimize packaging complexity.

Sustainability Positioning Accelerates Machine Glazed Paper Demand

Food manufacturers and packaging companies are choosing machine-glazed paper materials to achieve superior environmental credentials, enhance product positioning, and meet consumer demands for sustainable, recyclable packaging solutions. In environmental testing, machine-glazed paper delivers 95% recyclability compared to plastic packaging at 15-25%. Products formulated with machine-glazed paper maintain barrier performance throughout distribution cycles and extended shelf-life requirements.

In ready-to-use formats, eco-certified paper grades help reduce packaging complexity while maintaining food safety compliance by up to 85%. Machine-glazed paper applications are now being deployed for organic certification, increasing adoption in sectors demanding renewable packaging enhancement. These advantages help explain why machine-glazed paper adoption rates in food packaging rose 35% in 2024 across Asia-Pacific and Europe.

Raw Material Costs, Production Capacity and Quality Standardization Limit Growth

Market expansion is constrained by wood pulp price volatility, limited specialized production capacity, and stringent quality control requirements. Raw pulp costs can vary from $480 to $720 per metric ton, depending on seasonal factors and regional supply conditions, impacting paper pricing and leading to supply disruptions of up to 22% in commercial applications. Specialized glazing equipment requirements and quality control standards add 4 to 6 weeks to production cycles.

Environmental compliance and food-grade certification extend manufacturing costs by 15-20% compared to conventional paper grades. Limited availability among certified production facilities restricts scalable manufacturing, especially for organic and food-grade certification projects. These constraints make machine-glazed paper adoption challenging in price-sensitive markets despite growing environmental benefits and commercial interest.

Machine Glazed Paper Market Analysis by Top Countries

Machine Glazed Paper Market By Country

Country CAGR (2025 to 2035)
India 5.2%
China 5.0%
USA 4.9%
France 4.0%
UK 3.8%
Germany 3.5%
Brazil 3.2%

In the machine-glazed paper market, India leads with the highest projected CAGR of 5.2% from 2025 to 2035, driven by rapid industrialization and growing packaging demand. China follows with a CAGR of 5.0%, supported by manufacturing expansion and domestic consumption growth. The USA shows strong growth at 4.9%, backed by established food processing industries and sustainability regulations. France, the UK, and Germany demonstrate consistent moderate growth at 4.0%, 3.8%, and 3.5% respectively, supported by environmental rules and mature industrial applications. Brazil, with a CAGR of 3.2%, experiences gradual expansion supported by emerging market development but constrained by economic volatility, reflecting regional differences in industrial packaging adoption patterns.

The report covers an in-depth analysis of 40+ countries; seven top-performing countries are highlighted below.

Market Expansion in the Machine Glazed Paper Market in India

Revenue from machine glazed paper in India is projected to grow at a CAGR of 5.2% from 2025 to 2035, significantly exceeding the global average. Growth is fueled by rapid industrialization, expanding food processing sectors, and sustainable packaging adoption across major manufacturing centers, including Mumbai, Delhi, and Bangalore. Indian manufacturers are increasingly embracing eco-friendly packaging solutions as environmental regulations tighten and consumer awareness grows. E-commerce expansion and food delivery services are driving market penetration.

Key Statistics:

  • 340,000 metric tons of machine-glazed paper consumed across Indian markets in 2024
  • 68% of food manufacturers associate machine-glazed paper with sustainable packaging benefits
  • USD 89 million invested in sustainable packaging infrastructure in India in 2024

Growth Leadership in the Machine-Glazed Paper Market in China

The machine glazed paper market in China is anticipated to expand at a CAGR of 5.0% from 2025 to 2035, exceeding the global rate by 0.4%. Growth is centered on manufacturing expansion and domestic consumption growth in Guangdong, Jiangsu, and Zhejiang provinces. Advanced production technologies and cost-competitive manufacturing are being deployed for export markets, food packaging, and industrial applications. Environmental regulations and plastic reduction initiatives support practical machine-glazed paper application development across diverse manufacturing sectors.

Key Statistics:

  • 86 commercial machine-glazed paper production facilities operating in China in 2024
  • 72% of Chinese paper products meet international food safety compliance requirements
  • 2,840 manufacturing companies using machine-glazed paper in packaging applications in 2024

Market Development in the Machine Glazed Paper Market in the United States

Sales of machine glazed paper in the USA are slated to flourish at a CAGR of 4.9% from 2025 to 2035, approaching the global average. Growth has been concentrated in food packaging expansion and sustainable packaging adoption in California, Texas, and New York regions. Machine-glazed paper adoption is shifting from limited industrial use toward mainstream consumer packaging and food service applications. Domestic production capabilities and environmental compliance lead commercial deployment strategies. Regulatory partnerships have strengthened, with increased collaboration between American manufacturers and sustainability certification organizations.

Key Statistics:

  • USD 124 million allocated to sustainable packaging infrastructure in the USA in 2024
  • 43% of machine-glazed paper production is dedicated to food-grade applications in 2024
  • 892 partnership agreements established between USA manufacturers and sustainability organizations in 2024

Market Development in the Machine Glazed Paper Market in France

Sales of machine glazed paper in France are slated to flourish at a CAGR of 4.0% from 2025 to 2035, below the global average. Growth has been concentrated in premium packaging expansion and sustainable packaging adoption in Paris, Lyon, and Marseille regions. Machine glazed paper adoptions are shifting from limited industrial use toward mainstream consumer packaging and food service applications. Domestic sustainability regulations and environmental compliance lead commercial deployment strategies.

Key Statistics:

  • €98 million allocated to sustainable packaging infrastructure in France in 2024
  • 47% of machine glazed paper production is dedicated to food-grade applications in 2024
  • 674 partnership agreements established between French manufacturers and sustainability organizations in 2024

Growth Assessment for Machine Glazed Paper Market in Germany

The demand for machine glazed paper in Germany is expected to increase at a CAGR of 3.5% from 2025 to 2035, underperforming the global average by 1.1%. Demand is driven by industrial applications and automotive packaging in Berlin, Munich, and Hamburg markets. Environmental regulations and circular economy initiatives are increasingly supporting machine glazed paper adoption for product differentiation and compliance positioning. However, mature market conditions and limited growth in traditional sectors constrain broader market expansion.

Key Statistics:

  • €142 million invested in German machine glazed paper production networks in 2024
  • 72% of machine glazed paper consumption is attributed to industrial and automotive applications
  • 589 manufacturing facilities offering certified machine glazed paper products across German markets in 2024

United Kingdom Machine Glazed Paper Market Expansion Analysis

The machine glazed paper market in the UK is expected to grow at a CAGR of 3.8% from 2025 to 2035, below the global average. Growth is driven by premium food packaging trends and sustainable packaging preferences in the London, Manchester, and Edinburgh regions. Brexit-related supply chain adjustments and environmental regulations are expanding machine glazed paper accessibility, while food manufacturers incorporate it into eco-positioned products. Market development focuses on premium consumer segments and specialty food applications, supported by growing awareness of sustainable packaging alternatives.

Key Statistics:

  • £87 million invested in UK machine glazed paper retail distribution in 2024
  • 62% of machine glazed paper purchases are attributed to premium food packaging segments
  • 445 premium packaging companies utilizing certified machine glazed paper products across UK markets in 2024

Brazil Machine Glazed Paper Market Development Prospects

The demand for machine glazed paper in Brazil is projected to expand at a CAGR of 3.2% from 2025 to 2035, below the global average due to economic volatility and infrastructure limitations. Growth is concentrated in urban industrial areas, including São Paulo, Rio de Janeiro, and Belo Horizonte, where manufacturing expansion and export opportunities are rising. Limited domestic production capacity and fluctuating currency conditions restrict broader market penetration, while government support for sustainable packaging initiatives gradually builds market foundation. Cost-competitive positioning and industrial applications are essential for market development, targeting manufacturing and export-oriented sectors.

Key Statistics:

  • 1.2 million metric tons of machine glazed paper imported for Brazilian market consumption in 2024
  • 31% of purchases concentrated in southeastern industrial regions
  • USD 67.8 million revenue generated from machine glazed paper sales in Brazil in 2025

Competitive Landscape of the Machine Glazed Paper Market

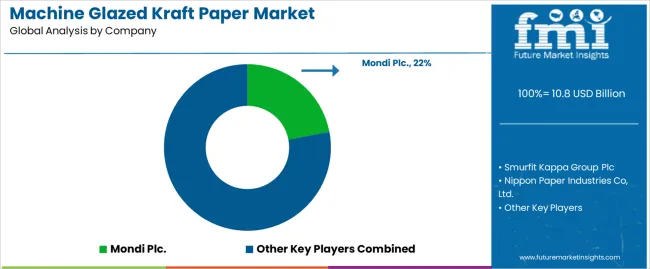
Machine Glazed Paper Market By Company

The market is moderately consolidated, featuring a mix of large integrated paper producers, specialized packaging companies, and regional manufacturers with varying degrees of production technology, product innovation, and distribution expertise. Mondi Group leads with an estimated 8% market share, supplying sustainable machine-glazed papers for packaging, industrial applications, and consumer goods. Their strength lies in comprehensive sustainability credentials, global production networks, and long-standing relationships with major consumer goods companies.

Billerud Korsnas AB, Nippon Paper Industries Co., Ltd, and Smurfit Kappa Group differentiate through specialized production technologies, regional market expertise, and application-specific formulations that cater to food packaging, industrial, and premium consumer segments. Stora Enso Oyj focuses on sustainable forestry practices, innovative barrier technologies, and circular economy solutions, addressing growing demand from environmentally conscious manufacturers and regulatory compliance requirements.

Regional specialists emphasize production efficiency, quality consistency, and supply chain integration, creating value in cost-sensitive markets and specialized industrial applications.

Entry barriers remain significant, driven by challenges in specialized glazing technology, pulp supply chain integration, and compliance with food safety and environmental standards across multiple application categories. Competitiveness increasingly depends on sustainability credentials, production efficiency capabilities, and market access expertise for diverse packaging and industrial manufacturing environments.

Scope of Report

Items Value
Quantitative Units (2025) USD 14.9 billion
Type Kraft Paper, Tissue Paper
Application Bags & Pouches, Sacks, Wraps, Labels & Release Liners, Envelopes, Coating & Lamination, Trays/Cups/Bowls, Others
Regions Covered North America, Europe, Asia-Pacific, Latin America, Middle East & Africa
Countries Covered United States, Canada, United Kingdom, Germany, France, China, Japan, India, Brazil, Australia, and 40+ Countries
Key Companies Profiled Smurfit Kappa Group, Nippon Paper Industries Co., Ltd, Stora Enso Oyj, Mondi Group Plc, Billerud Korsnas AB, Heinzel Group, Gascogne Papier SAS, Twin Rivers Paper Company, Burgo Group Spa, SCG Packaging, BPM Inc, Mosaico S.p.A.
Additional Attributes Dollar sales by application and grade, regional demand trends, competitive landscape, consumer preferences for eco-friendly packaging alternatives, integration with recycling and reuse practices, innovations in glazing technology and barrier enhancement for diverse packaging applications

Key Segmentation

By Basis Weight:

In terms of basis weight, the industry is divided into Up to 40 GSM, 41 to 70 GSM, 71 to 100 GSM, and Above 100 GSM.

By Paper Type:

In terms of paper type, the industry is segregated into tissue paper and kraft paper.

By Grade:

By grade, the market is divided into unbleached and bleached.

By Application:

By grade, the market is divided into bags & pouches, sacks, wraps, labels & release liners, envelopes, coating & lamination, trays, cups & bowls, and others (gift wrap etc.).

By End Use:

The market is classified by end uses such as food & beverages, healthcare, electrical & electronics, automotive, personal care & cosmetics, textile, building & construction, and household.

By Region:

Key countries of North America, Latin America, Europe, East Asia, South Asia, Middle East & Africa, and Oceania have been covered in the report.

Table of Content

  1. Executive Summary
    • Global Market Outlook
    • Demand-side Trends
    • Supply-side Trends
    • Technology Roadmap Analysis
    • Analysis and Recommendations
  2. Market Overview
    • Market Coverage / Taxonomy
    • Market Definition / Scope / Limitations
  3. Market Background
    • Market Dynamics
      • Drivers
      • Restraints
      • Opportunity
      • Trends
    • Scenario Forecast
      • Demand in Optimistic Scenario
      • Demand in Likely Scenario
      • Demand in Conservative Scenario
    • Opportunity Map Analysis
    • Product Life Cycle Analysis
    • Supply Chain Analysis
      • Supply Side Participants and their Roles
        • Producers
        • Mid-Level Participants (Traders/ Agents/ Brokers)
        • Wholesalers and Distributors
      • Value Added and Value Created at Node in the Supply Chain
      • List of Raw Material Suppliers
      • List of Existing and Potential Buyer’s
    • Investment Feasibility Matrix
    • Value Chain Analysis
      • Profit Margin Analysis
      • Wholesalers and Distributors
      • Retailers
    • PESTLE and Porter’s Analysis
    • Regulatory Landscape
      • By Key Regions
      • By Key Countries
    • Regional Parent Market Outlook
    • Production and Consumption Statistics
    • Import and Export Statistics
  4. Global Market Analysis 2020 to 2024 and Forecast, 2025 to 2035
    • Historical Market Size Value (USD Billion) & Volume (Kilotons) Analysis, 2020 to 2024
    • Current and Future Market Size Value (USD Billion) & Volume (Kilotons) Projections, 2025 to 2035
      • Y-o-Y Growth Trend Analysis
      • Absolute $ Opportunity Analysis
  5. Global Market Pricing Analysis 2020 to 2024 and Forecast 2025 to 2035
  6. Global Market Analysis 2020 to 2024 and Forecast 2025 to 2035, By Basis Weight
    • Introduction / Key Findings
    • Historical Market Size Value (USD Billion) & Volume (Kilotons) Analysis By Basis Weight, 2020 to 2024
    • Current and Future Market Size Value (USD Billion) & Volume (Kilotons) Analysis and Forecast By Basis Weight, 2025 to 2035
      • Up to 40 GSM
      • 41 to 70 GSM
      • 71 to 100 GSM
      • Above 100 GSM
    • Y-o-Y Growth Trend Analysis By Basis Weight, 2020 to 2024
    • Absolute $ Opportunity Analysis By Basis Weight, 2025 to 2035
  7. Global Market Analysis 2020 to 2024 and Forecast 2025 to 2035, By Paper Type
    • Introduction / Key Findings
    • Historical Market Size Value (USD Billion) & Volume (Kilotons) Analysis By Paper Type, 2020 to 2024
    • Current and Future Market Size Value (USD Billion) & Volume (Kilotons) Analysis and Forecast By Paper Type, 2025 to 2035
      • Tissue Paper
      • Kraft Paper
    • Y-o-Y Growth Trend Analysis By Paper Type, 2020 to 2024
    • Absolute $ Opportunity Analysis By Paper Type, 2025 to 2035
  8. Global Market Analysis 2020 to 2024 and Forecast 2025 to 2035, By Grade
    • Introduction / Key Findings
    • Historical Market Size Value (USD Billion) & Volume (Kilotons) Analysis By Grade, 2020 to 2024
    • Current and Future Market Size Value (USD Billion) & Volume (Kilotons) Analysis and Forecast By Grade, 2025 to 2035
      • Unbleached
      • Bleached
    • Y-o-Y Growth Trend Analysis By Grade, 2020 to 2024
    • Absolute $ Opportunity Analysis By Grade, 2025 to 2035
  9. Global Market Analysis 2020 to 2024 and Forecast 2025 to 2035, By Application
    • Introduction / Key Findings
    • Historical Market Size Value (USD Billion) & Volume (Kilotons) Analysis By Application, 2020 to 2024
    • Current and Future Market Size Value (USD Billion) & Volume (Kilotons) Analysis and Forecast By Application, 2025 to 2035
      • Bags & Pouches
      • Sacks
      • Wraps
      • Labels & Release Liners
      • Envelopes
      • Coating & Lamination
      • Trays, Cups & Bowls
      • Others (Gift Wrap)
    • Y-o-Y Growth Trend Analysis By Application, 2020 to 2024
    • Absolute $ Opportunity Analysis By Application, 2025 to 2035
  10. Global Market Analysis 2020 to 2024 and Forecast 2025 to 2035, By End Use
    • Introduction / Key Findings
    • Historical Market Size Value (USD Billion) & Volume (Kilotons) Analysis By End Use, 2020 to 2024
    • Current and Future Market Size Value (USD Billion) & Volume (Kilotons) Analysis and Forecast By End Use, 2025 to 2035
      • Food & Beverages
      • Healthcare
      • Electrical & Electronics
      • Automotive
      • Personal Care & Cosmetics
      • Textile
      • Building & Construction
      • Household
    • Y-o-Y Growth Trend Analysis By End Use, 2020 to 2024
    • Absolute $ Opportunity Analysis By End Use, 2025 to 2035
  11. Global Market Analysis 2020 to 2024 and Forecast 2025 to 2035, By Region
    • Introduction
    • Historical Market Size Value (USD Billion) & Volume (Kilotons) Analysis By Region, 2020 to 2024
    • Current Market Size Value (USD Billion) & Volume (Kilotons) Analysis and Forecast By Region, 2025 to 2035
      • North America
      • Latin America
      • Western Europe
      • Eastern Europe
      • East Asia
      • South Asia & Pacific
      • Middle East and Africa
    • Market Attractiveness Analysis By Region
  12. North America Market Analysis 2020 to 2024 and Forecast 2025 to 2035, By Country
    • Historical Market Size Value (USD Billion) & Volume (Kilotons) Trend Analysis By Market Taxonomy, 2020 to 2024
    • Market Size Value (USD Billion) & Volume (Kilotons) Forecast By Market Taxonomy, 2025 to 2035
      • By Country
        • USA
        • Canada
        • Mexico
      • By Basis Weight
      • By Paper Type
      • By Grade
      • By Application
      • By End Use
    • Market Attractiveness Analysis
      • By Country
      • By Basis Weight
      • By Paper Type
      • By Grade
      • By Application
      • By End Use
    • Key Takeaways
  13. Latin America Market Analysis 2020 to 2024 and Forecast 2025 to 2035, By Country
    • Historical Market Size Value (USD Billion) & Volume (Kilotons) Trend Analysis By Market Taxonomy, 2020 to 2024
    • Market Size Value (USD Billion) & Volume (Kilotons) Forecast By Market Taxonomy, 2025 to 2035
      • By Country
        • Brazil
        • Argentina
        • Rest of LATAM
      • By Basis Weight
      • By Paper Type
      • By Grade
      • By Application
      • By End Use
    • Market Attractiveness Analysis
      • By Country
      • By Basis Weight
      • By Paper Type
      • By Grade
      • By Application
      • By End Use
    • Key Takeaways
  14. Western Europe Market Analysis 2020 to 2024 and Forecast 2025 to 2035, By Country
    • Historical Market Size Value (USD Billion) & Volume (Kilotons) Trend Analysis By Market Taxonomy, 2020 to 2024
    • Market Size Value (USD Billion) & Volume (Kilotons) Forecast By Market Taxonomy, 2025 to 2035
      • By Country
        • Germany
        • Italy
        • France
        • UK
        • Spain
        • BENELUX
        • Nordic
        • Rest of W.Europe
      • By Basis Weight
      • By Paper Type
      • By Grade
      • By Application
      • By End Use
    • Market Attractiveness Analysis
      • By Country
      • By Basis Weight
      • By Paper Type
      • By Grade
      • By Application
      • By End Use
    • Key Takeaways
  15. Eastern Europe Market Analysis 2020 to 2024 and Forecast 2025 to 2035, By Country
    • Historical Market Size Value (USD Billion) & Volume (Kilotons) Trend Analysis By Market Taxonomy, 2020 to 2024
    • Market Size Value (USD Billion) & Volume (Kilotons) Forecast By Market Taxonomy, 2025 to 2035
      • By Country
        • Russia
        • Hungary
        • Poland
        • Balkan & Baltics
        • Rest of E. Europe
      • By Basis Weight
      • By Paper Type
      • By Grade
      • By Application
      • By End Use
    • Market Attractiveness Analysis
      • By Country
      • By Basis Weight
      • By Paper Type
      • By Grade
      • By Application
      • By End Use
    • Key Takeaways
  16. East Asia Market Analysis 2020 to 2024 and Forecast 2025 to 2035, By Country
    • Historical Market Size Value (USD Billion) & Volume (Kilotons) Trend Analysis By Market Taxonomy, 2020 to 2024
    • Market Size Value (USD Billion) & Volume (Kilotons) Forecast By Market Taxonomy, 2025 to 2035
      • By Country
        • China
        • Japan
        • South Korea
      • By Basis Weight
      • By Paper Type
      • By Grade
      • By Application
      • By End Use
    • Market Attractiveness Analysis
      • By Country
      • By Basis Weight
      • By Paper Type
      • By Grade
      • By Application
      • By End Use
    • Key Takeaways
  17. South Asia & Pacific Market Analysis 2020 to 2024 and Forecast 2025 to 2035, By Country
    • Historical Market Size Value (USD Billion) & Volume (Kilotons) Trend Analysis By Market Taxonomy, 2020 to 2024
    • Market Size Value (USD Billion) & Volume (Kilotons) Forecast By Market Taxonomy, 2025 to 2035
      • By Country
        • India
        • Australia & New Zealand
        • ASEAN
        • Rest of SAP
      • By Basis Weight
      • By Paper Type
      • By Grade
      • By Application
      • By End Use
    • Market Attractiveness Analysis
      • By Country
      • By Basis Weight
      • By Paper Type
      • By Grade
      • By Application
      • By End Use
    • Key Takeaways
  18. Middle East and Africa Market Analysis 2020 to 2024 and Forecast 2025 to 2035, By Country
    • Historical Market Size Value (USD Billion) & Volume (Kilotons) Trend Analysis By Market Taxonomy, 2020 to 2024
    • Market Size Value (USD Billion) & Volume (Kilotons) Forecast By Market Taxonomy, 2025 to 2035
      • By Country
        • GCC Countries
        • Northern Africa
        • South Africa
        • Turkiye
        • Rest of MEA
      • By Basis Weight
      • By Paper Type
      • By Grade
      • By Application
      • By End Use
    • Market Attractiveness Analysis
      • By Country
      • By Basis Weight
      • By Paper Type
      • By Grade
      • By Application
      • By End Use
    • Key Takeaways
  19. Key Countries Market Analysis
    • USA
      • Pricing Analysis
      • Market Share Analysis, 2024
        • By Basis Weight
        • By Paper Type
        • By Grade
        • By Application
        • By End Use
    • Canada
      • Pricing Analysis
      • Market Share Analysis, 2024
        • By Basis Weight
        • By Paper Type
        • By Grade
        • By Application
        • By End Use
    • Brazil
      • Pricing Analysis
      • Market Share Analysis, 2024
        • By Basis Weight
        • By Paper Type
        • By Grade
        • By Application
        • By End Use
    • Mexico
      • Pricing Analysis
      • Market Share Analysis, 2024
        • By Basis Weight
        • By Paper Type
        • By Grade
        • By Application
        • By End Use
    • Argentina
      • Pricing Analysis
      • Market Share Analysis, 2024
        • By Basis Weight
        • By Paper Type
        • By Grade
        • By Application
        • By End Use
  20. Market Structure Analysis
    • Competition Dashboard
    • Competition Benchmarking
    • Market Share Analysis of Top Players
      • By Regional
      • By Basis Weight
      • By Paper Type
      • By Grade
      • By Application
      • By End Use
  21. Competition Analysis
    • Competition Deep Dive
      • Smurfit Kappa Group
        • Overview
        • Product Portfolio
        • Profitability by Market Segments (Product/Age /Sales Channel/Region)
        • Sales Footprint
        • Strategy Overview
          • Marketing Strategy
          • Product Strategy
          • Channel Strategy
      • Nippon Paper Industries Co., Ltd
        • Overview
        • Product Portfolio
        • Profitability by Market Segments (Product/Age /Sales Channel/Region)
        • Sales Footprint
        • Strategy Overview
          • Marketing Strategy
          • Product Strategy
          • Channel Strategy
      • Stora Enso Oyj
        • Overview
        • Product Portfolio
        • Profitability by Market Segments (Product/Age /Sales Channel/Region)
        • Sales Footprint
        • Strategy Overview
          • Marketing Strategy
          • Product Strategy
          • Channel Strategy
      • Mondi Group Plc
        • Overview
        • Product Portfolio
        • Profitability by Market Segments (Product/Age /Sales Channel/Region)
        • Sales Footprint
        • Strategy Overview
          • Marketing Strategy
          • Product Strategy
          • Channel Strategy
      • BillerudKorsnas AB
        • Overview
        • Product Portfolio
        • Profitability by Market Segments (Product/Age /Sales Channel/Region)
        • Sales Footprint
        • Strategy Overview
          • Marketing Strategy
          • Product Strategy
          • Channel Strategy
      • Heinzel Group
        • Overview
        • Product Portfolio
        • Profitability by Market Segments (Product/Age /Sales Channel/Region)
        • Sales Footprint
        • Strategy Overview
          • Marketing Strategy
          • Product Strategy
          • Channel Strategy
      • Gascogne Papier SAS
        • Overview
        • Product Portfolio
        • Profitability by Market Segments (Product/Age /Sales Channel/Region)
        • Sales Footprint
        • Strategy Overview
          • Marketing Strategy
          • Product Strategy
          • Channel Strategy
      • Twin Rivers Paper Company
        • Overview
        • Product Portfolio
        • Profitability by Market Segments (Product/Age /Sales Channel/Region)
        • Sales Footprint
        • Strategy Overview
          • Marketing Strategy
          • Product Strategy
          • Channel Strategy
      • Burgo Group Spa
        • Overview
        • Product Portfolio
        • Profitability by Market Segments (Product/Age /Sales Channel/Region)
        • Sales Footprint
        • Strategy Overview
          • Marketing Strategy
          • Product Strategy
          • Channel Strategy
      • SCG Packaging
        • Overview
        • Product Portfolio
        • Profitability by Market Segments (Product/Age /Sales Channel/Region)
        • Sales Footprint
        • Strategy Overview
          • Marketing Strategy
          • Product Strategy
          • Channel Strategy
      • BPM Inc
        • Overview
        • Product Portfolio
        • Profitability by Market Segments (Product/Age /Sales Channel/Region)
        • Sales Footprint
        • Strategy Overview
          • Marketing Strategy
          • Product Strategy
          • Channel Strategy
      • Mosaico S.p.A.
        • Overview
        • Product Portfolio
        • Profitability by Market Segments (Product/Age /Sales Channel/Region)
        • Sales Footprint
        • Strategy Overview
          • Marketing Strategy
          • Product Strategy
          • Channel Strategy
  22. Assumptions & Acronyms Used
  23. Research Methodology

List of Tables

  • Table 1: Global Market Value (USD Billion) Forecast by Region, 2020-2035
  • Table 2: Global Market Volume (Kilotons) Forecast by Region, 2020-2035
  • Table 3: Global Market Value (USD Billion) Forecast by Basis Weight, 2020-2035
  • Table 4: Global Market Volume (Kilotons) Forecast by Basis Weight, 2020-2035
  • Table 5: Global Market Value (USD Billion) Forecast by Paper Type, 2020-2035
  • Table 6: Global Market Volume (Kilotons) Forecast by Paper Type, 2020-2035
  • Table 7: Global Market Value (USD Billion) Forecast by Grade, 2020-2035
  • Table 8: Global Market Volume (Kilotons) Forecast by Grade, 2020-2035
  • Table 9: Global Market Value (USD Billion) Forecast by Application, 2020-2035
  • Table 10: Global Market Volume (Kilotons) Forecast by Application, 2020-2035
  • Table 11: Global Market Value (USD Billion) Forecast by End Use, 2020-2035
  • Table 12: Global Market Volume (Kilotons) Forecast by End Use, 2020-2035
  • Table 13: North America Market Value (USD Billion) Forecast by Country, 2020-2035
  • Table 14: North America Market Volume (Kilotons) Forecast by Country, 2020-2035
  • Table 15: North America Market Value (USD Billion) Forecast by Basis Weight, 2020-2035
  • Table 16: North America Market Volume (Kilotons) Forecast by Basis Weight, 2020-2035
  • Table 17: North America Market Value (USD Billion) Forecast by Paper Type, 2020-2035
  • Table 18: North America Market Volume (Kilotons) Forecast by Paper Type, 2020-2035
  • Table 19: North America Market Value (USD Billion) Forecast by Grade, 2020-2035
  • Table 20: North America Market Volume (Kilotons) Forecast by Grade, 2020-2035
  • Table 21: North America Market Value (USD Billion) Forecast by Application, 2020-2035
  • Table 22: North America Market Volume (Kilotons) Forecast by Application, 2020-2035
  • Table 23: North America Market Value (USD Billion) Forecast by End Use, 2020-2035
  • Table 24: North America Market Volume (Kilotons) Forecast by End Use, 2020-2035
  • Table 25: Latin America Market Value (USD Billion) Forecast by Country, 2020-2035
  • Table 26: Latin America Market Volume (Kilotons) Forecast by Country, 2020-2035
  • Table 27: Latin America Market Value (USD Billion) Forecast by Basis Weight, 2020-2035
  • Table 28: Latin America Market Volume (Kilotons) Forecast by Basis Weight, 2020-2035
  • Table 29: Latin America Market Value (USD Billion) Forecast by Paper Type, 2020-2035
  • Table 30: Latin America Market Volume (Kilotons) Forecast by Paper Type, 2020-2035
  • Table 31: Latin America Market Value (USD Billion) Forecast by Grade, 2020-2035
  • Table 32: Latin America Market Volume (Kilotons) Forecast by Grade, 2020-2035
  • Table 33: Latin America Market Value (USD Billion) Forecast by Application, 2020-2035
  • Table 34: Latin America Market Volume (Kilotons) Forecast by Application, 2020-2035
  • Table 35: Latin America Market Value (USD Billion) Forecast by End Use, 2020-2035
  • Table 36: Latin America Market Volume (Kilotons) Forecast by End Use, 2020-2035
  • Table 37: Western Europe Market Value (USD Billion) Forecast by Country, 2020-2035
  • Table 38: Western Europe Market Volume (Kilotons) Forecast by Country, 2020-2035
  • Table 39: Western Europe Market Value (USD Billion) Forecast by Basis Weight, 2020-2035
  • Table 40: Western Europe Market Volume (Kilotons) Forecast by Basis Weight, 2020-2035
  • Table 41: Western Europe Market Value (USD Billion) Forecast by Paper Type, 2020-2035
  • Table 42: Western Europe Market Volume (Kilotons) Forecast by Paper Type, 2020-2035
  • Table 43: Western Europe Market Value (USD Billion) Forecast by Grade, 2020-2035
  • Table 44: Western Europe Market Volume (Kilotons) Forecast by Grade, 2020-2035
  • Table 45: Western Europe Market Value (USD Billion) Forecast by Application, 2020-2035
  • Table 46: Western Europe Market Volume (Kilotons) Forecast by Application, 2020-2035
  • Table 47: Western Europe Market Value (USD Billion) Forecast by End Use, 2020-2035
  • Table 48: Western Europe Market Volume (Kilotons) Forecast by End Use, 2020-2035
  • Table 49: Eastern Europe Market Value (USD Billion) Forecast by Country, 2020-2035
  • Table 50: Eastern Europe Market Volume (Kilotons) Forecast by Country, 2020-2035
  • Table 51: Eastern Europe Market Value (USD Billion) Forecast by Basis Weight, 2020-2035
  • Table 52: Eastern Europe Market Volume (Kilotons) Forecast by Basis Weight, 2020-2035
  • Table 53: Eastern Europe Market Value (USD Billion) Forecast by Paper Type, 2020-2035
  • Table 54: Eastern Europe Market Volume (Kilotons) Forecast by Paper Type, 2020-2035
  • Table 55: Eastern Europe Market Value (USD Billion) Forecast by Grade, 2020-2035
  • Table 56: Eastern Europe Market Volume (Kilotons) Forecast by Grade, 2020-2035
  • Table 57: Eastern Europe Market Value (USD Billion) Forecast by Application, 2020-2035
  • Table 58: Eastern Europe Market Volume (Kilotons) Forecast by Application, 2020-2035
  • Table 59: Eastern Europe Market Value (USD Billion) Forecast by End Use, 2020-2035
  • Table 60: Eastern Europe Market Volume (Kilotons) Forecast by End Use, 2020-2035
  • Table 61: East Asia Market Value (USD Billion) Forecast by Country, 2020-2035
  • Table 62: East Asia Market Volume (Kilotons) Forecast by Country, 2020-2035
  • Table 63: East Asia Market Value (USD Billion) Forecast by Basis Weight, 2020-2035
  • Table 64: East Asia Market Volume (Kilotons) Forecast by Basis Weight, 2020-2035
  • Table 65: East Asia Market Value (USD Billion) Forecast by Paper Type, 2020-2035
  • Table 66: East Asia Market Volume (Kilotons) Forecast by Paper Type, 2020-2035
  • Table 67: East Asia Market Value (USD Billion) Forecast by Grade, 2020-2035
  • Table 68: East Asia Market Volume (Kilotons) Forecast by Grade, 2020-2035
  • Table 69: East Asia Market Value (USD Billion) Forecast by Application, 2020-2035
  • Table 70: East Asia Market Volume (Kilotons) Forecast by Application, 2020-2035
  • Table 71: East Asia Market Value (USD Billion) Forecast by End Use, 2020-2035
  • Table 72: East Asia Market Volume (Kilotons) Forecast by End Use, 2020-2035
  • Table 73: South Asia & Pacific Market Value (USD Billion) Forecast by Country, 2020-2035
  • Table 74: South Asia & Pacific Market Volume (Kilotons) Forecast by Country, 2020-2035
  • Table 75: South Asia & Pacific Market Value (USD Billion) Forecast by Basis Weight, 2020-2035
  • Table 76: South Asia & Pacific Market Volume (Kilotons) Forecast by Basis Weight, 2020-2035
  • Table 77: South Asia & Pacific Market Value (USD Billion) Forecast by Paper Type, 2020-2035
  • Table 78: South Asia & Pacific Market Volume (Kilotons) Forecast by Paper Type, 2020-2035
  • Table 79: South Asia & Pacific Market Value (USD Billion) Forecast by Grade, 2020-2035
  • Table 80: South Asia & Pacific Market Volume (Kilotons) Forecast by Grade, 2020-2035
  • Table 81: South Asia & Pacific Market Value (USD Billion) Forecast by Application, 2020-2035
  • Table 82: South Asia & Pacific Market Volume (Kilotons) Forecast by Application, 2020-2035
  • Table 83: South Asia & Pacific Market Value (USD Billion) Forecast by End Use, 2020-2035
  • Table 84: South Asia & Pacific Market Volume (Kilotons) Forecast by End Use, 2020-2035
  • Table 85: Middle East and Africa Market Value (USD Billion) Forecast by Country, 2020-2035
  • Table 86: Middle East and Africa Market Volume (Kilotons) Forecast by Country, 2020-2035
  • Table 87: Middle East and Africa Market Value (USD Billion) Forecast by Basis Weight, 2020-2035
  • Table 88: Middle East and Africa Market Volume (Kilotons) Forecast by Basis Weight, 2020-2035
  • Table 89: Middle East and Africa Market Value (USD Billion) Forecast by Paper Type, 2020-2035
  • Table 90: Middle East and Africa Market Volume (Kilotons) Forecast by Paper Type, 2020-2035
  • Table 91: Middle East and Africa Market Value (USD Billion) Forecast by Grade, 2020-2035
  • Table 92: Middle East and Africa Market Volume (Kilotons) Forecast by Grade, 2020-2035
  • Table 93: Middle East and Africa Market Value (USD Billion) Forecast by Application, 2020-2035
  • Table 94: Middle East and Africa Market Volume (Kilotons) Forecast by Application, 2020-2035
  • Table 95: Middle East and Africa Market Value (USD Billion) Forecast by End Use, 2020-2035
  • Table 96: Middle East and Africa Market Volume (Kilotons) Forecast by End Use, 2020-2035

List of Figures

  • Figure 1: Global Market Volume (Kilotons) Forecast 2020-2035
  • Figure 2: Global Market Pricing Analysis
  • Figure 3: Global Market Value (USD Billion) Forecast 2020-2035
  • Figure 4: Global Market Value Share and BPS Analysis by Basis Weight, 2025 and 2035
  • Figure 5: Global Market Y-o-Y Growth Comparison by Basis Weight, 2025-2035
  • Figure 6: Global Market Attractiveness Analysis by Basis Weight
  • Figure 7: Global Market Value Share and BPS Analysis by Paper Type, 2025 and 2035
  • Figure 8: Global Market Y-o-Y Growth Comparison by Paper Type, 2025-2035
  • Figure 9: Global Market Attractiveness Analysis by Paper Type
  • Figure 10: Global Market Value Share and BPS Analysis by Grade, 2025 and 2035
  • Figure 11: Global Market Y-o-Y Growth Comparison by Grade, 2025-2035
  • Figure 12: Global Market Attractiveness Analysis by Grade
  • Figure 13: Global Market Value Share and BPS Analysis by Application, 2025 and 2035
  • Figure 14: Global Market Y-o-Y Growth Comparison by Application, 2025-2035
  • Figure 15: Global Market Attractiveness Analysis by Application
  • Figure 16: Global Market Value Share and BPS Analysis by End Use, 2025 and 2035
  • Figure 17: Global Market Y-o-Y Growth Comparison by End Use, 2025-2035
  • Figure 18: Global Market Attractiveness Analysis by End Use
  • Figure 19: Global Market Value (USD Billion) Share and BPS Analysis by Region, 2025 and 2035
  • Figure 20: Global Market Y-o-Y Growth Comparison by Region, 2025-2035
  • Figure 21: Global Market Attractiveness Analysis by Region
  • Figure 22: North America Market Incremental $ Opportunity, 2025-2035
  • Figure 23: Latin America Market Incremental $ Opportunity, 2025-2035
  • Figure 24: Western Europe Market Incremental $ Opportunity, 2025-2035
  • Figure 25: Eastern Europe Market Incremental $ Opportunity, 2025-2035
  • Figure 26: East Asia Market Incremental $ Opportunity, 2025-2035
  • Figure 27: South Asia & Pacific Market Incremental $ Opportunity, 2025-2035
  • Figure 28: Middle East and Africa Market Incremental $ Opportunity, 2025-2035
  • Figure 29: North America Market Value Share and BPS Analysis by Country, 2025 and 2035
  • Figure 30: North America Market Value Share and BPS Analysis by Basis Weight, 2025 and 2035
  • Figure 31: North America Market Y-o-Y Growth Comparison by Basis Weight, 2025-2035
  • Figure 32: North America Market Attractiveness Analysis by Basis Weight
  • Figure 33: North America Market Value Share and BPS Analysis by Paper Type, 2025 and 2035
  • Figure 34: North America Market Y-o-Y Growth Comparison by Paper Type, 2025-2035
  • Figure 35: North America Market Attractiveness Analysis by Paper Type
  • Figure 36: North America Market Value Share and BPS Analysis by Grade, 2025 and 2035
  • Figure 37: North America Market Y-o-Y Growth Comparison by Grade, 2025-2035
  • Figure 38: North America Market Attractiveness Analysis by Grade
  • Figure 39: North America Market Value Share and BPS Analysis by Application, 2025 and 2035
  • Figure 40: North America Market Y-o-Y Growth Comparison by Application, 2025-2035
  • Figure 41: North America Market Attractiveness Analysis by Application
  • Figure 42: North America Market Value Share and BPS Analysis by End Use, 2025 and 2035
  • Figure 43: North America Market Y-o-Y Growth Comparison by End Use, 2025-2035
  • Figure 44: North America Market Attractiveness Analysis by End Use
  • Figure 45: Latin America Market Value Share and BPS Analysis by Country, 2025 and 2035
  • Figure 46: Latin America Market Value Share and BPS Analysis by Basis Weight, 2025 and 2035
  • Figure 47: Latin America Market Y-o-Y Growth Comparison by Basis Weight, 2025-2035
  • Figure 48: Latin America Market Attractiveness Analysis by Basis Weight
  • Figure 49: Latin America Market Value Share and BPS Analysis by Paper Type, 2025 and 2035
  • Figure 50: Latin America Market Y-o-Y Growth Comparison by Paper Type, 2025-2035
  • Figure 51: Latin America Market Attractiveness Analysis by Paper Type
  • Figure 52: Latin America Market Value Share and BPS Analysis by Grade, 2025 and 2035
  • Figure 53: Latin America Market Y-o-Y Growth Comparison by Grade, 2025-2035
  • Figure 54: Latin America Market Attractiveness Analysis by Grade
  • Figure 55: Latin America Market Value Share and BPS Analysis by Application, 2025 and 2035
  • Figure 56: Latin America Market Y-o-Y Growth Comparison by Application, 2025-2035
  • Figure 57: Latin America Market Attractiveness Analysis by Application
  • Figure 58: Latin America Market Value Share and BPS Analysis by End Use, 2025 and 2035
  • Figure 59: Latin America Market Y-o-Y Growth Comparison by End Use, 2025-2035
  • Figure 60: Latin America Market Attractiveness Analysis by End Use
  • Figure 61: Western Europe Market Value Share and BPS Analysis by Country, 2025 and 2035
  • Figure 62: Western Europe Market Value Share and BPS Analysis by Basis Weight, 2025 and 2035
  • Figure 63: Western Europe Market Y-o-Y Growth Comparison by Basis Weight, 2025-2035
  • Figure 64: Western Europe Market Attractiveness Analysis by Basis Weight
  • Figure 65: Western Europe Market Value Share and BPS Analysis by Paper Type, 2025 and 2035
  • Figure 66: Western Europe Market Y-o-Y Growth Comparison by Paper Type, 2025-2035
  • Figure 67: Western Europe Market Attractiveness Analysis by Paper Type
  • Figure 68: Western Europe Market Value Share and BPS Analysis by Grade, 2025 and 2035
  • Figure 69: Western Europe Market Y-o-Y Growth Comparison by Grade, 2025-2035
  • Figure 70: Western Europe Market Attractiveness Analysis by Grade
  • Figure 71: Western Europe Market Value Share and BPS Analysis by Application, 2025 and 2035
  • Figure 72: Western Europe Market Y-o-Y Growth Comparison by Application, 2025-2035
  • Figure 73: Western Europe Market Attractiveness Analysis by Application
  • Figure 74: Western Europe Market Value Share and BPS Analysis by End Use, 2025 and 2035
  • Figure 75: Western Europe Market Y-o-Y Growth Comparison by End Use, 2025-2035
  • Figure 76: Western Europe Market Attractiveness Analysis by End Use
  • Figure 77: Eastern Europe Market Value Share and BPS Analysis by Country, 2025 and 2035
  • Figure 78: Eastern Europe Market Value Share and BPS Analysis by Basis Weight, 2025 and 2035
  • Figure 79: Eastern Europe Market Y-o-Y Growth Comparison by Basis Weight, 2025-2035
  • Figure 80: Eastern Europe Market Attractiveness Analysis by Basis Weight
  • Figure 81: Eastern Europe Market Value Share and BPS Analysis by Paper Type, 2025 and 2035
  • Figure 82: Eastern Europe Market Y-o-Y Growth Comparison by Paper Type, 2025-2035
  • Figure 83: Eastern Europe Market Attractiveness Analysis by Paper Type
  • Figure 84: Eastern Europe Market Value Share and BPS Analysis by Grade, 2025 and 2035
  • Figure 85: Eastern Europe Market Y-o-Y Growth Comparison by Grade, 2025-2035
  • Figure 86: Eastern Europe Market Attractiveness Analysis by Grade
  • Figure 87: Eastern Europe Market Value Share and BPS Analysis by Application, 2025 and 2035
  • Figure 88: Eastern Europe Market Y-o-Y Growth Comparison by Application, 2025-2035
  • Figure 89: Eastern Europe Market Attractiveness Analysis by Application
  • Figure 90: Eastern Europe Market Value Share and BPS Analysis by End Use, 2025 and 2035
  • Figure 91: Eastern Europe Market Y-o-Y Growth Comparison by End Use, 2025-2035
  • Figure 92: Eastern Europe Market Attractiveness Analysis by End Use
  • Figure 93: East Asia Market Value Share and BPS Analysis by Country, 2025 and 2035
  • Figure 94: East Asia Market Value Share and BPS Analysis by Basis Weight, 2025 and 2035
  • Figure 95: East Asia Market Y-o-Y Growth Comparison by Basis Weight, 2025-2035
  • Figure 96: East Asia Market Attractiveness Analysis by Basis Weight
  • Figure 97: East Asia Market Value Share and BPS Analysis by Paper Type, 2025 and 2035
  • Figure 98: East Asia Market Y-o-Y Growth Comparison by Paper Type, 2025-2035
  • Figure 99: East Asia Market Attractiveness Analysis by Paper Type
  • Figure 100: East Asia Market Value Share and BPS Analysis by Grade, 2025 and 2035
  • Figure 101: East Asia Market Y-o-Y Growth Comparison by Grade, 2025-2035
  • Figure 102: East Asia Market Attractiveness Analysis by Grade
  • Figure 103: East Asia Market Value Share and BPS Analysis by Application, 2025 and 2035
  • Figure 104: East Asia Market Y-o-Y Growth Comparison by Application, 2025-2035
  • Figure 105: East Asia Market Attractiveness Analysis by Application
  • Figure 106: East Asia Market Value Share and BPS Analysis by End Use, 2025 and 2035
  • Figure 107: East Asia Market Y-o-Y Growth Comparison by End Use, 2025-2035
  • Figure 108: East Asia Market Attractiveness Analysis by End Use
  • Figure 109: South Asia & Pacific Market Value Share and BPS Analysis by Country, 2025 and 2035
  • Figure 110: South Asia & Pacific Market Value Share and BPS Analysis by Basis Weight, 2025 and 2035
  • Figure 111: South Asia & Pacific Market Y-o-Y Growth Comparison by Basis Weight, 2025-2035
  • Figure 112: South Asia & Pacific Market Attractiveness Analysis by Basis Weight
  • Figure 113: South Asia & Pacific Market Value Share and BPS Analysis by Paper Type, 2025 and 2035
  • Figure 114: South Asia & Pacific Market Y-o-Y Growth Comparison by Paper Type, 2025-2035
  • Figure 115: South Asia & Pacific Market Attractiveness Analysis by Paper Type
  • Figure 116: South Asia & Pacific Market Value Share and BPS Analysis by Grade, 2025 and 2035
  • Figure 117: South Asia & Pacific Market Y-o-Y Growth Comparison by Grade, 2025-2035
  • Figure 118: South Asia & Pacific Market Attractiveness Analysis by Grade
  • Figure 119: South Asia & Pacific Market Value Share and BPS Analysis by Application, 2025 and 2035
  • Figure 120: South Asia & Pacific Market Y-o-Y Growth Comparison by Application, 2025-2035
  • Figure 121: South Asia & Pacific Market Attractiveness Analysis by Application
  • Figure 122: South Asia & Pacific Market Value Share and BPS Analysis by End Use, 2025 and 2035
  • Figure 123: South Asia & Pacific Market Y-o-Y Growth Comparison by End Use, 2025-2035
  • Figure 124: South Asia & Pacific Market Attractiveness Analysis by End Use
  • Figure 125: Middle East and Africa Market Value Share and BPS Analysis by Country, 2025 and 2035
  • Figure 126: Middle East and Africa Market Value Share and BPS Analysis by Basis Weight, 2025 and 2035
  • Figure 127: Middle East and Africa Market Y-o-Y Growth Comparison by Basis Weight, 2025-2035
  • Figure 128: Middle East and Africa Market Attractiveness Analysis by Basis Weight
  • Figure 129: Middle East and Africa Market Value Share and BPS Analysis by Paper Type, 2025 and 2035
  • Figure 130: Middle East and Africa Market Y-o-Y Growth Comparison by Paper Type, 2025-2035
  • Figure 131: Middle East and Africa Market Attractiveness Analysis by Paper Type
  • Figure 132: Middle East and Africa Market Value Share and BPS Analysis by Grade, 2025 and 2035
  • Figure 133: Middle East and Africa Market Y-o-Y Growth Comparison by Grade, 2025-2035
  • Figure 134: Middle East and Africa Market Attractiveness Analysis by Grade
  • Figure 135: Middle East and Africa Market Value Share and BPS Analysis by Application, 2025 and 2035
  • Figure 136: Middle East and Africa Market Y-o-Y Growth Comparison by Application, 2025-2035
  • Figure 137: Middle East and Africa Market Attractiveness Analysis by Application
  • Figure 138: Middle East and Africa Market Value Share and BPS Analysis by End Use, 2025 and 2035
  • Figure 139: Middle East and Africa Market Y-o-Y Growth Comparison by End Use, 2025-2035
  • Figure 140: Middle East and Africa Market Attractiveness Analysis by End Use
  • Figure 141: Global Market - Tier Structure Analysis
  • Figure 142: Global Market - Company Share Analysis

Frequently Asked Questions

How big is the machine glazed paper market in 2025?

The global machine glazed paper market is estimated to be valued at USD 14.9 billion in 2025.

What will be the size of the machine glazed paper market in 2035?

The market size for machine glazed paper is projected to reach USD 23.4 billion by 2035.

How much will be the machine glazed paper market growth between 2025 and 2035?

The machine glazed paper market is expected to grow at a 4.6% CAGR between 2025 and 2035.

Which paper type is projected to lead in the machine glazed paper market in 2025?

The kraft paper segment is projected to lead in the machine glazed paper market with 60% share in 2025.

Which application segment is projected to contribute a significant share in the machine glazed paper market in 2025?

In terms of application, bags & pouches are projected to command 28% share in the machine glazed paper market in 2025.

Explore Similar Insights

Future Market Insights

Machine Glazed Paper Market

Chat With MaRIA

Chat With

MaRIA

Hi There, I am MaRIA, Your Market Research Intelligence Assistant. How may I help you?