Machine Vision System And Services Market Size and Share Forecast Outlook 2025 to 2035

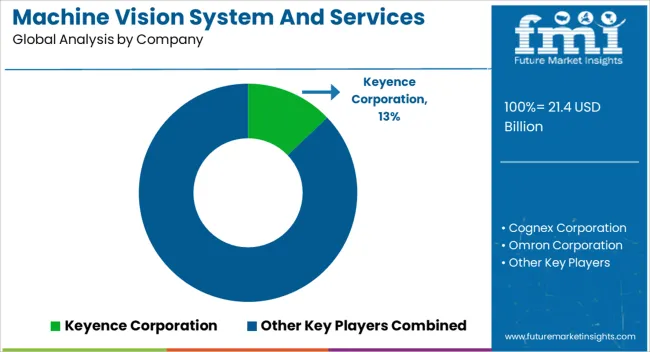
The Machine Vision System And Services Market is estimated to be valued at USD 21.4 billion in 2025 and is projected to reach USD 61.0 billion by 2035, registering a compound annual growth rate (CAGR) of 11.0% over the forecast period.
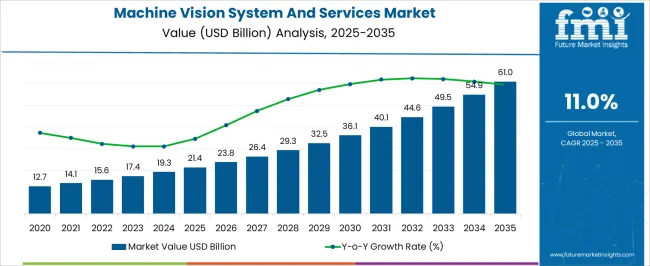
Quick Stats for Machine Vision System And Services Market

  • Machine Vision System And Services Market Value (2025): USD 21.4 billion
  • Machine Vision System And Services Market Forecast Value (2035): USD 61.0 billion
  • Machine Vision System And Services Market Forecast CAGR: 11.0%
  • Leading Segment in Machine Vision System And Services Market in 2025: 3D Measurement (46.2%)
  • Key Growth Regions in Machine Vision System And Services Market: North America, Asia-Pacific, Europe
  • Top Key Players in Machine Vision System And Services Market: Keyence Corporation, Cognex Corporation, Omron Corporation, SICK AG, Atlas Copco AB, ISRA Vision AG, Balser AG, National Instruments Corporation, TKH Group, Datalogic S.P.A, MVTEC Software GMBH, Optotune, Deci AI, Relation Therapeutics, Lenovo

Machine Vision System And Services Market Market Value Analysis

Machine Vision System And Services Market Key Takeaways

Metric Value
Machine Vision System And Services Market Estimated Value in (2025 E) USD 21.4 billion
Machine Vision System And Services Market Forecast Value in (2035 F) USD 61.0 billion
Forecast CAGR (2025 to 2035) 11.0%

Why is the Machine Vision System And Services Market Growing?

The Machine Vision System and Services market is witnessing strong growth, driven by increasing automation across manufacturing, automotive, electronics, and quality inspection industries. Demand is being fueled by the need for precise measurement, defect detection, and process optimization in production lines. The integration of AI-powered analytics, high-resolution imaging, and real-time monitoring is enhancing operational efficiency while reducing errors and downtime.

Advancements in 3D measurement technologies, including laser scanning and structured light imaging, are enabling highly accurate inspections for complex components. Adoption is further supported by the growing emphasis on smart factories, Industry 4.0 initiatives, and predictive maintenance strategies. Market expansion is being reinforced by increasing investments in industrial automation, research, and development of cost-effective vision solutions.

The ability to integrate vision systems with robotics, data analytics, and cloud-based platforms allows organizations to optimize productivity and maintain quality standards Regulatory compliance and safety monitoring requirements are also driving the adoption of machine vision systems and services, positioning the market for sustained growth in the coming decade.

Segmental Analysis

The machine vision system and services market is segmented by type, application, component, end-user vertical, and geographic regions. By type, machine vision system and services market is divided into 3D Measurement, 2D Measurement, and 1D Measurement. In terms of application, machine vision system and services market is classified into Flaw Detection, Identification, Positioning, Measurement, and Verification. Based on component, machine vision system and services market is segmented into Smart Camera, Lenses, Lighting, Frame Grabber, and Embedded System. By end-user vertical, machine vision system and services market is segmented into Automotive, Electronics, Healthcare, Industrial, and Others. Regionally, the machine vision system and services industry is classified into North America, Latin America, Western Europe, Eastern Europe, Balkan & Baltic Countries, Russia & Belarus, Central Asia, East Asia, South Asia & Pacific, and the Middle East & Africa.
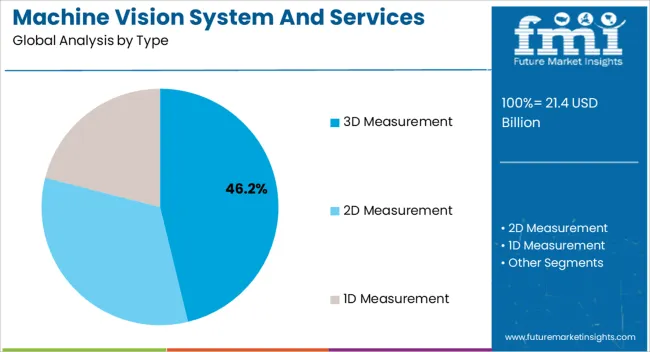
Insights into the 3D Measurement Type Segment

Machine Vision System And Services Market Analysis By Type

The 3D measurement type segment is projected to hold 46.2% of the market revenue in 2025, establishing it as the leading type. Growth is being driven by the ability of 3D measurement systems to deliver highly accurate spatial data for complex geometries and assemblies, which is critical for quality control and process optimization. These systems allow manufacturers to perform precise dimensional analysis, reduce scrap, and minimize rework costs.

Advancements in structured light scanning, laser triangulation, and photogrammetry are enhancing measurement speed and resolution, enabling real-time inspection of high-volume production lines. Integration with software analytics and AI enables automated decision-making, further improving efficiency and reducing human error.

The versatility of 3D measurement systems across industries such as automotive, electronics, and aerospace reinforces their adoption As organizations prioritize precision, efficiency, and traceability in production processes, the 3D measurement segment is expected to maintain its leadership, supported by continuous technological innovation and improved system integration capabilities.
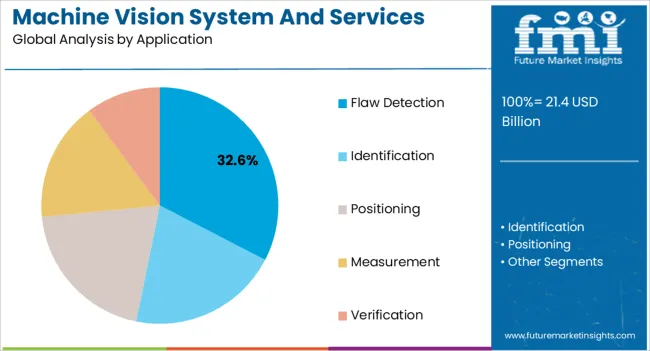
Insights into the Flaw Detection Application Segment

Machine Vision System And Services Market Analysis By Application

The flaw detection application segment is anticipated to account for 32.6% of the market revenue in 2025, making it the leading application area. Its growth is being driven by the critical need to identify defects, anomalies, and quality inconsistencies in production lines to ensure compliance with stringent quality standards. Machine vision systems enable real-time detection of surface defects, assembly errors, and dimensional inaccuracies, reducing operational losses and improving product reliability.

The integration of AI and deep learning algorithms enhances detection accuracy under varying environmental conditions and complex component geometries. Flaw detection applications are increasingly being adopted in industries such as electronics, automotive, and pharmaceuticals, where precision and safety are paramount.

Automation of inspection processes reduces reliance on manual checks, increasing throughput while maintaining high quality As manufacturers continue to pursue zero-defect production strategies and improve operational efficiency, the flaw detection application segment is expected to remain a primary driver of market growth, supported by advancements in imaging, software analytics, and integration with industrial automation systems.
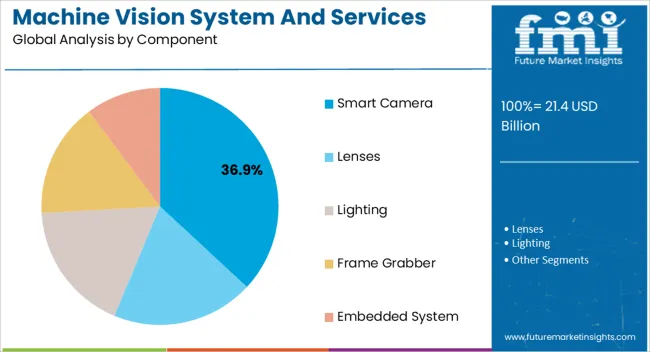
Insights into the Smart Camera Component Segment

Machine Vision System And Services Market Analysis By Component

The smart camera component segment is projected to hold 36.9% of the market revenue in 2025, establishing it as the leading component type. Its adoption is being driven by the integration of imaging sensors, processing units, and software in a single compact device, enabling real-time data acquisition and analysis. Smart cameras provide high-speed inspection, automated decision-making, and seamless connectivity with industrial networks, enhancing productivity and reducing errors.

These devices are increasingly being deployed in automated production lines for quality control, object recognition, and process monitoring across manufacturing, logistics, and electronics industries. Advances in embedded AI, high-resolution optics, and edge computing are further improving accuracy, performance, and scalability.

The ability to adapt functionality via software without major hardware modifications offers cost efficiency and flexibility As industrial automation and smart manufacturing adoption accelerate, smart cameras are expected to maintain their market leadership, supported by continuous innovation, operational efficiency improvements, and enhanced integration with machine vision systems and robotics.

Market Overview

Machine Vision System And Services Market Overview

Machine vision technology is a vital part of industrial automated production process that serves to improve the overall speed and quality of a final product. Superior to normal human visual sense, machine vision technology offers a critical capability of judging a product being manufactured.

Machine vision system and service providers allow manufacturers to achieve rapid production lines with accurate, precise non-contact product measurement, and closed-loop process control. High quality product inspection, lesser setup time and quick downtime, and increased production flexibility are among top advantages machine vision systems offer.

Virtually employed by all industrial manufacturing verticals, vision inspection enabled early detection and resolution of production inconsistency. In addition to boosting production efficiency, it also helps increase product integrity and thereby fulfil all associated legal compliance standards. In a nutshell, manufacturers cannot afford to bypass machine vision technology during the production process, as it ultimately helps companies to preserve their brands’ reputation in the long run.
Analysis of Machine Vision System And Services Market By Key Countries

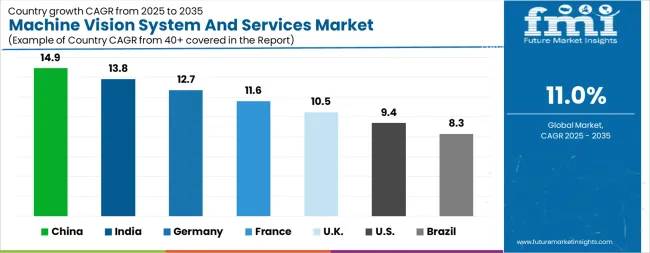
Machine Vision System And Services Market Cagr Analysis By Country

Country CAGR
China 14.9%
India 13.8%
Germany 12.7%
France 11.6%
UK 10.5%
USA 9.4%
Brazil 8.3%

Country-wise Analysis

The Machine Vision System And Services Market is expected to register a CAGR of 11.0% during the forecast period, exhibiting varied country level momentum. China leads with the highest CAGR of 14.9%, followed by India at 13.8%. Developed markets such as Germany, France, and the UK continue to expand steadily, while the USA is likely to grow at consistent rates. Brazil posts the lowest CAGR at 8.3%, yet still underscores a broadly positive trajectory for the global Machine Vision System And Services Market. In 2024, Germany held a dominant revenue in the Western Europe market and is expected to grow with a CAGR of 12.7%. The USA Machine Vision System And Services Market is estimated to be valued at USD 7.7 billion in 2025 and is anticipated to reach a valuation of USD 18.8 billion by 2035. Sales are projected to rise at a CAGR of 9.4% over the forecast period between 2025 and 2035. While Japan and South Korea markets are estimated to be valued at USD 1.2 billion and USD 716.5 million respectively in 2025.
Key Players in the Machine Vision System And Services Market

Machine Vision System And Services Market Analysis By Company

  • Keyence Corporation
  • Cognex Corporation
  • Omron Corporation
  • SICK AG
  • Atlas Copco AB
  • ISRA Vision AG
  • Balser AG
  • National Instruments Corporation
  • TKH Group
  • Datalogic S.P.A
  • MVTEC Software GMBH
  • Optotune
  • Deci AI
  • Relation Therapeutics
  • Lenovo

Scope of the Report

Item Value
Quantitative Units USD 21.4 Billion
Type 3D Measurement, 2D Measurement, and 1D Measurement
Application Flaw Detection, Identification, Positioning, Measurement, and Verification
Component Smart Camera, Lenses, Lighting, Frame Grabber, and Embedded System
End-User Vertical Automotive, Electronics, Healthcare, Industrial, and Others
Regions Covered North America, Europe, Asia-Pacific, Latin America, Middle East & Africa
Country Covered United States, Canada, Germany, France, United Kingdom, China, Japan, India, Brazil, South Africa
Key Companies Profiled Keyence Corporation, Cognex Corporation, Omron Corporation, SICK AG, Atlas Copco AB, ISRA Vision AG, Balser AG, National Instruments Corporation, TKH Group, Datalogic S.P.A, MVTEC Software GMBH, Optotune, Deci AI, Relation Therapeutics, and Lenovo

Machine Vision System And Services Market by Segments

Type:

  • 3D Measurement
  • 2D Measurement
  • 1D Measurement

Application:

  • Flaw Detection
  • Identification
  • Positioning
  • Measurement
  • Verification

Component:

  • Smart Camera
  • Lenses
  • Lighting
  • Frame Grabber
  • Embedded System

End-User Vertical:

  • Automotive
  • Electronics
  • Healthcare
  • Industrial
  • Others

Region:

  • North America
    • USA
    • Canada
    • Mexico
  • Latin America
    • Brazil
    • Chile
    • Rest of Latin America
  • Western Europe
    • Germany
    • UK
    • Italy
    • Spain
    • France
    • Nordic
    • BENELUX
    • Rest of Western Europe
  • Eastern Europe
    • Russia
    • Poland
    • Hungary
    • Balkan & Baltic
    • Rest of Eastern Europe
  • East Asia
    • China
    • Japan
    • South Korea
  • South Asia and Pacific
    • India
    • ASEAN
    • Australia & New Zealand
    • Rest of South Asia and Pacific
  • Middle East & Africa
    • Kingdom of Saudi Arabia
    • Other GCC Countries
    • Turkiye
    • South Africa
    • Other African Union
    • Rest of Middle East & Africa

Table of Content

  1. Executive Summary
    • Global Market Outlook
    • Demand-side Trends
    • Supply-side Trends
    • Technology Roadmap Analysis
    • Analysis and Recommendations
  2. Market Overview
    • Market Coverage / Taxonomy
    • Market Definition / Scope / Limitations
  3. Market Background
    • Market Dynamics
      • Drivers
      • Restraints
      • Opportunity
      • Trends
    • Scenario Forecast
      • Demand in Optimistic Scenario
      • Demand in Likely Scenario
      • Demand in Conservative Scenario
    • Opportunity Map Analysis
    • Product Life Cycle Analysis
    • Supply Chain Analysis
    • Investment Feasibility Matrix
    • Value Chain Analysis
    • PESTLE and Porter’s Analysis
    • Regulatory Landscape
    • Regional Parent Market Outlook
    • Production and Consumption Statistics
    • Import and Export Statistics
  4. Global Market Analysis 2020 to 2024 and Forecast, 2025 to 2035
    • Historical Market Size Value (USD Million) Analysis, 2020 to 2024
    • Current and Future Market Size Value (USD Million) Projections, 2025 to 2035
      • Y-o-Y Growth Trend Analysis
      • Absolute $ Opportunity Analysis
  5. Global Market Pricing Analysis 2020 to 2024 and Forecast 2025 to 2035
  6. Global Market Analysis 2020 to 2024 and Forecast 2025 to 2035, By Type
    • Introduction / Key Findings
    • Historical Market Size Value (USD Million) Analysis By Type , 2020 to 2024
    • Current and Future Market Size Value (USD Million) Analysis and Forecast By Type , 2025 to 2035
      • 3D Measurement
      • 2D Measurement
      • 1D Measurement
    • Y-o-Y Growth Trend Analysis By Type , 2020 to 2024
    • Absolute $ Opportunity Analysis By Type , 2025 to 2035
  7. Global Market Analysis 2020 to 2024 and Forecast 2025 to 2035, By Application
    • Introduction / Key Findings
    • Historical Market Size Value (USD Million) Analysis By Application, 2020 to 2024
    • Current and Future Market Size Value (USD Million) Analysis and Forecast By Application, 2025 to 2035
      • Flaw Detection
      • Identification
      • Positioning
      • Measurement
      • Verification
    • Y-o-Y Growth Trend Analysis By Application, 2020 to 2024
    • Absolute $ Opportunity Analysis By Application, 2025 to 2035
  8. Global Market Analysis 2020 to 2024 and Forecast 2025 to 2035, By Component
    • Introduction / Key Findings
    • Historical Market Size Value (USD Million) Analysis By Component, 2020 to 2024
    • Current and Future Market Size Value (USD Million) Analysis and Forecast By Component, 2025 to 2035
      • Smart Camera
      • Lenses
      • Lighting
      • Frame Grabber
      • Embedded System
    • Y-o-Y Growth Trend Analysis By Component, 2020 to 2024
    • Absolute $ Opportunity Analysis By Component, 2025 to 2035
  9. Global Market Analysis 2020 to 2024 and Forecast 2025 to 2035, By End-User Vertical
    • Introduction / Key Findings
    • Historical Market Size Value (USD Million) Analysis By End-User Vertical, 2020 to 2024
    • Current and Future Market Size Value (USD Million) Analysis and Forecast By End-User Vertical, 2025 to 2035
      • Automotive
      • Electronics
      • Healthcare
      • Industrial
      • Others
    • Y-o-Y Growth Trend Analysis By End-User Vertical, 2020 to 2024
    • Absolute $ Opportunity Analysis By End-User Vertical, 2025 to 2035
  10. Global Market Analysis 2020 to 2024 and Forecast 2025 to 2035, By Region
    • Introduction
    • Historical Market Size Value (USD Million) Analysis By Region, 2020 to 2024
    • Current Market Size Value (USD Million) Analysis and Forecast By Region, 2025 to 2035
      • North America
      • Latin America
      • Western Europe
      • Eastern Europe
      • East Asia
      • South Asia and Pacific
      • Middle East & Africa
    • Market Attractiveness Analysis By Region
  11. North America Market Analysis 2020 to 2024 and Forecast 2025 to 2035, By Country
    • Historical Market Size Value (USD Million) Trend Analysis By Market Taxonomy, 2020 to 2024
    • Market Size Value (USD Million) Forecast By Market Taxonomy, 2025 to 2035
      • By Country
        • USA
        • Canada
        • Mexico
      • By Type
      • By Application
      • By Component
      • By End-User Vertical
    • Market Attractiveness Analysis
      • By Country
      • By Type
      • By Application
      • By Component
      • By End-User Vertical
    • Key Takeaways
  12. Latin America Market Analysis 2020 to 2024 and Forecast 2025 to 2035, By Country
    • Historical Market Size Value (USD Million) Trend Analysis By Market Taxonomy, 2020 to 2024
    • Market Size Value (USD Million) Forecast By Market Taxonomy, 2025 to 2035
      • By Country
        • Brazil
        • Chile
        • Rest of Latin America
      • By Type
      • By Application
      • By Component
      • By End-User Vertical
    • Market Attractiveness Analysis
      • By Country
      • By Type
      • By Application
      • By Component
      • By End-User Vertical
    • Key Takeaways
  13. Western Europe Market Analysis 2020 to 2024 and Forecast 2025 to 2035, By Country
    • Historical Market Size Value (USD Million) Trend Analysis By Market Taxonomy, 2020 to 2024
    • Market Size Value (USD Million) Forecast By Market Taxonomy, 2025 to 2035
      • By Country
        • Germany
        • UK
        • Italy
        • Spain
        • France
        • Nordic
        • BENELUX
        • Rest of Western Europe
      • By Type
      • By Application
      • By Component
      • By End-User Vertical
    • Market Attractiveness Analysis
      • By Country
      • By Type
      • By Application
      • By Component
      • By End-User Vertical
    • Key Takeaways
  14. Eastern Europe Market Analysis 2020 to 2024 and Forecast 2025 to 2035, By Country
    • Historical Market Size Value (USD Million) Trend Analysis By Market Taxonomy, 2020 to 2024
    • Market Size Value (USD Million) Forecast By Market Taxonomy, 2025 to 2035
      • By Country
        • Russia
        • Poland
        • Hungary
        • Balkan & Baltic
        • Rest of Eastern Europe
      • By Type
      • By Application
      • By Component
      • By End-User Vertical
    • Market Attractiveness Analysis
      • By Country
      • By Type
      • By Application
      • By Component
      • By End-User Vertical
    • Key Takeaways
  15. East Asia Market Analysis 2020 to 2024 and Forecast 2025 to 2035, By Country
    • Historical Market Size Value (USD Million) Trend Analysis By Market Taxonomy, 2020 to 2024
    • Market Size Value (USD Million) Forecast By Market Taxonomy, 2025 to 2035
      • By Country
        • China
        • Japan
        • South Korea
      • By Type
      • By Application
      • By Component
      • By End-User Vertical
    • Market Attractiveness Analysis
      • By Country
      • By Type
      • By Application
      • By Component
      • By End-User Vertical
    • Key Takeaways
  16. South Asia and Pacific Market Analysis 2020 to 2024 and Forecast 2025 to 2035, By Country
    • Historical Market Size Value (USD Million) Trend Analysis By Market Taxonomy, 2020 to 2024
    • Market Size Value (USD Million) Forecast By Market Taxonomy, 2025 to 2035
      • By Country
        • India
        • ASEAN
        • Australia & New Zealand
        • Rest of South Asia and Pacific
      • By Type
      • By Application
      • By Component
      • By End-User Vertical
    • Market Attractiveness Analysis
      • By Country
      • By Type
      • By Application
      • By Component
      • By End-User Vertical
    • Key Takeaways
  17. Middle East & Africa Market Analysis 2020 to 2024 and Forecast 2025 to 2035, By Country
    • Historical Market Size Value (USD Million) Trend Analysis By Market Taxonomy, 2020 to 2024
    • Market Size Value (USD Million) Forecast By Market Taxonomy, 2025 to 2035
      • By Country
        • Kingdom of Saudi Arabia
        • Other GCC Countries
        • Turkiye
        • South Africa
        • Other African Union
        • Rest of Middle East & Africa
      • By Type
      • By Application
      • By Component
      • By End-User Vertical
    • Market Attractiveness Analysis
      • By Country
      • By Type
      • By Application
      • By Component
      • By End-User Vertical
    • Key Takeaways
  18. Key Countries Market Analysis
    • USA
      • Pricing Analysis
      • Market Share Analysis, 2024
        • By Type
        • By Application
        • By Component
        • By End-User Vertical
    • Canada
      • Pricing Analysis
      • Market Share Analysis, 2024
        • By Type
        • By Application
        • By Component
        • By End-User Vertical
    • Mexico
      • Pricing Analysis
      • Market Share Analysis, 2024
        • By Type
        • By Application
        • By Component
        • By End-User Vertical
    • Brazil
      • Pricing Analysis
      • Market Share Analysis, 2024
        • By Type
        • By Application
        • By Component
        • By End-User Vertical
    • Chile
      • Pricing Analysis
      • Market Share Analysis, 2024
        • By Type
        • By Application
        • By Component
        • By End-User Vertical
    • Germany
      • Pricing Analysis
      • Market Share Analysis, 2024
        • By Type
        • By Application
        • By Component
        • By End-User Vertical
    • UK
      • Pricing Analysis
      • Market Share Analysis, 2024
        • By Type
        • By Application
        • By Component
        • By End-User Vertical
    • Italy
      • Pricing Analysis
      • Market Share Analysis, 2024
        • By Type
        • By Application
        • By Component
        • By End-User Vertical
    • Spain
      • Pricing Analysis
      • Market Share Analysis, 2024
        • By Type
        • By Application
        • By Component
        • By End-User Vertical
    • France
      • Pricing Analysis
      • Market Share Analysis, 2024
        • By Type
        • By Application
        • By Component
        • By End-User Vertical
    • India
      • Pricing Analysis
      • Market Share Analysis, 2024
        • By Type
        • By Application
        • By Component
        • By End-User Vertical
    • ASEAN
      • Pricing Analysis
      • Market Share Analysis, 2024
        • By Type
        • By Application
        • By Component
        • By End-User Vertical
    • Australia & New Zealand
      • Pricing Analysis
      • Market Share Analysis, 2024
        • By Type
        • By Application
        • By Component
        • By End-User Vertical
    • China
      • Pricing Analysis
      • Market Share Analysis, 2024
        • By Type
        • By Application
        • By Component
        • By End-User Vertical
    • Japan
      • Pricing Analysis
      • Market Share Analysis, 2024
        • By Type
        • By Application
        • By Component
        • By End-User Vertical
    • South Korea
      • Pricing Analysis
      • Market Share Analysis, 2024
        • By Type
        • By Application
        • By Component
        • By End-User Vertical
    • Russia
      • Pricing Analysis
      • Market Share Analysis, 2024
        • By Type
        • By Application
        • By Component
        • By End-User Vertical
    • Poland
      • Pricing Analysis
      • Market Share Analysis, 2024
        • By Type
        • By Application
        • By Component
        • By End-User Vertical
    • Hungary
      • Pricing Analysis
      • Market Share Analysis, 2024
        • By Type
        • By Application
        • By Component
        • By End-User Vertical
    • Kingdom of Saudi Arabia
      • Pricing Analysis
      • Market Share Analysis, 2024
        • By Type
        • By Application
        • By Component
        • By End-User Vertical
    • Turkiye
      • Pricing Analysis
      • Market Share Analysis, 2024
        • By Type
        • By Application
        • By Component
        • By End-User Vertical
    • South Africa
      • Pricing Analysis
      • Market Share Analysis, 2024
        • By Type
        • By Application
        • By Component
        • By End-User Vertical
  19. Market Structure Analysis
    • Competition Dashboard
    • Competition Benchmarking
    • Market Share Analysis of Top Players
      • By Regional
      • By Type
      • By Application
      • By Component
      • By End-User Vertical
  20. Competition Analysis
    • Competition Deep Dive
      • Keyence Corporation
        • Overview
        • Product Portfolio
        • Profitability by Market Segments (Product/Age /Sales Channel/Region)
        • Sales Footprint
        • Strategy Overview
          • Marketing Strategy
          • Product Strategy
          • Channel Strategy
      • Cognex Corporation
      • Omron Corporation
      • SICK AG
      • Atlas Copco AB
      • ISRA Vision AG
      • Balser AG
      • National Instruments Corporation
      • TKH Group
      • Datalogic S.P.A
      • MVTEC Software GMBH
      • Optotune
      • Deci AI
      • Relation Therapeutics
      • Lenovo
  21. Assumptions & Acronyms Used
  22. Research Methodology

List of Tables

  • Table 1: Global Market Value (USD Million) Forecast by Region, 2020 to 2035
  • Table 2: Global Market Value (USD Million) Forecast by Type , 2020 to 2035
  • Table 3: Global Market Value (USD Million) Forecast by Application, 2020 to 2035
  • Table 4: Global Market Value (USD Million) Forecast by Component, 2020 to 2035
  • Table 5: Global Market Value (USD Million) Forecast by End-User Vertical, 2020 to 2035
  • Table 6: North America Market Value (USD Million) Forecast by Country, 2020 to 2035
  • Table 7: North America Market Value (USD Million) Forecast by Type , 2020 to 2035
  • Table 8: North America Market Value (USD Million) Forecast by Application, 2020 to 2035
  • Table 9: North America Market Value (USD Million) Forecast by Component, 2020 to 2035
  • Table 10: North America Market Value (USD Million) Forecast by End-User Vertical, 2020 to 2035
  • Table 11: Latin America Market Value (USD Million) Forecast by Country, 2020 to 2035
  • Table 12: Latin America Market Value (USD Million) Forecast by Type , 2020 to 2035
  • Table 13: Latin America Market Value (USD Million) Forecast by Application, 2020 to 2035
  • Table 14: Latin America Market Value (USD Million) Forecast by Component, 2020 to 2035
  • Table 15: Latin America Market Value (USD Million) Forecast by End-User Vertical, 2020 to 2035
  • Table 16: Western Europe Market Value (USD Million) Forecast by Country, 2020 to 2035
  • Table 17: Western Europe Market Value (USD Million) Forecast by Type , 2020 to 2035
  • Table 18: Western Europe Market Value (USD Million) Forecast by Application, 2020 to 2035
  • Table 19: Western Europe Market Value (USD Million) Forecast by Component, 2020 to 2035
  • Table 20: Western Europe Market Value (USD Million) Forecast by End-User Vertical, 2020 to 2035
  • Table 21: Eastern Europe Market Value (USD Million) Forecast by Country, 2020 to 2035
  • Table 22: Eastern Europe Market Value (USD Million) Forecast by Type , 2020 to 2035
  • Table 23: Eastern Europe Market Value (USD Million) Forecast by Application, 2020 to 2035
  • Table 24: Eastern Europe Market Value (USD Million) Forecast by Component, 2020 to 2035
  • Table 25: Eastern Europe Market Value (USD Million) Forecast by End-User Vertical, 2020 to 2035
  • Table 26: East Asia Market Value (USD Million) Forecast by Country, 2020 to 2035
  • Table 27: East Asia Market Value (USD Million) Forecast by Type , 2020 to 2035
  • Table 28: East Asia Market Value (USD Million) Forecast by Application, 2020 to 2035
  • Table 29: East Asia Market Value (USD Million) Forecast by Component, 2020 to 2035
  • Table 30: East Asia Market Value (USD Million) Forecast by End-User Vertical, 2020 to 2035
  • Table 31: South Asia and Pacific Market Value (USD Million) Forecast by Country, 2020 to 2035
  • Table 32: South Asia and Pacific Market Value (USD Million) Forecast by Type , 2020 to 2035
  • Table 33: South Asia and Pacific Market Value (USD Million) Forecast by Application, 2020 to 2035
  • Table 34: South Asia and Pacific Market Value (USD Million) Forecast by Component, 2020 to 2035
  • Table 35: South Asia and Pacific Market Value (USD Million) Forecast by End-User Vertical, 2020 to 2035
  • Table 36: Middle East & Africa Market Value (USD Million) Forecast by Country, 2020 to 2035
  • Table 37: Middle East & Africa Market Value (USD Million) Forecast by Type , 2020 to 2035
  • Table 38: Middle East & Africa Market Value (USD Million) Forecast by Application, 2020 to 2035
  • Table 39: Middle East & Africa Market Value (USD Million) Forecast by Component, 2020 to 2035
  • Table 40: Middle East & Africa Market Value (USD Million) Forecast by End-User Vertical, 2020 to 2035

List of Figures

  • Figure 1: Global Market Pricing Analysis
  • Figure 2: Global Market Value (USD Million) Forecast 2020-2035
  • Figure 3: Global Market Value Share and BPS Analysis by Type , 2025 and 2035
  • Figure 4: Global Market Y-o-Y Growth Comparison by Type , 2025-2035
  • Figure 5: Global Market Attractiveness Analysis by Type
  • Figure 6: Global Market Value Share and BPS Analysis by Application, 2025 and 2035
  • Figure 7: Global Market Y-o-Y Growth Comparison by Application, 2025-2035
  • Figure 8: Global Market Attractiveness Analysis by Application
  • Figure 9: Global Market Value Share and BPS Analysis by Component, 2025 and 2035
  • Figure 10: Global Market Y-o-Y Growth Comparison by Component, 2025-2035
  • Figure 11: Global Market Attractiveness Analysis by Component
  • Figure 12: Global Market Value Share and BPS Analysis by End-User Vertical, 2025 and 2035
  • Figure 13: Global Market Y-o-Y Growth Comparison by End-User Vertical, 2025-2035
  • Figure 14: Global Market Attractiveness Analysis by End-User Vertical
  • Figure 15: Global Market Value (USD Million) Share and BPS Analysis by Region, 2025 and 2035
  • Figure 16: Global Market Y-o-Y Growth Comparison by Region, 2025-2035
  • Figure 17: Global Market Attractiveness Analysis by Region
  • Figure 18: North America Market Incremental Dollar Opportunity, 2025-2035
  • Figure 19: Latin America Market Incremental Dollar Opportunity, 2025-2035
  • Figure 20: Western Europe Market Incremental Dollar Opportunity, 2025-2035
  • Figure 21: Eastern Europe Market Incremental Dollar Opportunity, 2025-2035
  • Figure 22: East Asia Market Incremental Dollar Opportunity, 2025-2035
  • Figure 23: South Asia and Pacific Market Incremental Dollar Opportunity, 2025-2035
  • Figure 24: Middle East & Africa Market Incremental Dollar Opportunity, 2025-2035
  • Figure 25: North America Market Value Share and BPS Analysis by Country, 2025 and 2035
  • Figure 26: North America Market Value Share and BPS Analysis by Type , 2025 and 2035
  • Figure 27: North America Market Y-o-Y Growth Comparison by Type , 2025-2035
  • Figure 28: North America Market Attractiveness Analysis by Type
  • Figure 29: North America Market Value Share and BPS Analysis by Application, 2025 and 2035
  • Figure 30: North America Market Y-o-Y Growth Comparison by Application, 2025-2035
  • Figure 31: North America Market Attractiveness Analysis by Application
  • Figure 32: North America Market Value Share and BPS Analysis by Component, 2025 and 2035
  • Figure 33: North America Market Y-o-Y Growth Comparison by Component, 2025-2035
  • Figure 34: North America Market Attractiveness Analysis by Component
  • Figure 35: North America Market Value Share and BPS Analysis by End-User Vertical, 2025 and 2035
  • Figure 36: North America Market Y-o-Y Growth Comparison by End-User Vertical, 2025-2035
  • Figure 37: North America Market Attractiveness Analysis by End-User Vertical
  • Figure 38: Latin America Market Value Share and BPS Analysis by Country, 2025 and 2035
  • Figure 39: Latin America Market Value Share and BPS Analysis by Type , 2025 and 2035
  • Figure 40: Latin America Market Y-o-Y Growth Comparison by Type , 2025-2035
  • Figure 41: Latin America Market Attractiveness Analysis by Type
  • Figure 42: Latin America Market Value Share and BPS Analysis by Application, 2025 and 2035
  • Figure 43: Latin America Market Y-o-Y Growth Comparison by Application, 2025-2035
  • Figure 44: Latin America Market Attractiveness Analysis by Application
  • Figure 45: Latin America Market Value Share and BPS Analysis by Component, 2025 and 2035
  • Figure 46: Latin America Market Y-o-Y Growth Comparison by Component, 2025-2035
  • Figure 47: Latin America Market Attractiveness Analysis by Component
  • Figure 48: Latin America Market Value Share and BPS Analysis by End-User Vertical, 2025 and 2035
  • Figure 49: Latin America Market Y-o-Y Growth Comparison by End-User Vertical, 2025-2035
  • Figure 50: Latin America Market Attractiveness Analysis by End-User Vertical
  • Figure 51: Western Europe Market Value Share and BPS Analysis by Country, 2025 and 2035
  • Figure 52: Western Europe Market Value Share and BPS Analysis by Type , 2025 and 2035
  • Figure 53: Western Europe Market Y-o-Y Growth Comparison by Type , 2025-2035
  • Figure 54: Western Europe Market Attractiveness Analysis by Type
  • Figure 55: Western Europe Market Value Share and BPS Analysis by Application, 2025 and 2035
  • Figure 56: Western Europe Market Y-o-Y Growth Comparison by Application, 2025-2035
  • Figure 57: Western Europe Market Attractiveness Analysis by Application
  • Figure 58: Western Europe Market Value Share and BPS Analysis by Component, 2025 and 2035
  • Figure 59: Western Europe Market Y-o-Y Growth Comparison by Component, 2025-2035
  • Figure 60: Western Europe Market Attractiveness Analysis by Component
  • Figure 61: Western Europe Market Value Share and BPS Analysis by End-User Vertical, 2025 and 2035
  • Figure 62: Western Europe Market Y-o-Y Growth Comparison by End-User Vertical, 2025-2035
  • Figure 63: Western Europe Market Attractiveness Analysis by End-User Vertical
  • Figure 64: Eastern Europe Market Value Share and BPS Analysis by Country, 2025 and 2035
  • Figure 65: Eastern Europe Market Value Share and BPS Analysis by Type , 2025 and 2035
  • Figure 66: Eastern Europe Market Y-o-Y Growth Comparison by Type , 2025-2035
  • Figure 67: Eastern Europe Market Attractiveness Analysis by Type
  • Figure 68: Eastern Europe Market Value Share and BPS Analysis by Application, 2025 and 2035
  • Figure 69: Eastern Europe Market Y-o-Y Growth Comparison by Application, 2025-2035
  • Figure 70: Eastern Europe Market Attractiveness Analysis by Application
  • Figure 71: Eastern Europe Market Value Share and BPS Analysis by Component, 2025 and 2035
  • Figure 72: Eastern Europe Market Y-o-Y Growth Comparison by Component, 2025-2035
  • Figure 73: Eastern Europe Market Attractiveness Analysis by Component
  • Figure 74: Eastern Europe Market Value Share and BPS Analysis by End-User Vertical, 2025 and 2035
  • Figure 75: Eastern Europe Market Y-o-Y Growth Comparison by End-User Vertical, 2025-2035
  • Figure 76: Eastern Europe Market Attractiveness Analysis by End-User Vertical
  • Figure 77: East Asia Market Value Share and BPS Analysis by Country, 2025 and 2035
  • Figure 78: East Asia Market Value Share and BPS Analysis by Type , 2025 and 2035
  • Figure 79: East Asia Market Y-o-Y Growth Comparison by Type , 2025-2035
  • Figure 80: East Asia Market Attractiveness Analysis by Type
  • Figure 81: East Asia Market Value Share and BPS Analysis by Application, 2025 and 2035
  • Figure 82: East Asia Market Y-o-Y Growth Comparison by Application, 2025-2035
  • Figure 83: East Asia Market Attractiveness Analysis by Application
  • Figure 84: East Asia Market Value Share and BPS Analysis by Component, 2025 and 2035
  • Figure 85: East Asia Market Y-o-Y Growth Comparison by Component, 2025-2035
  • Figure 86: East Asia Market Attractiveness Analysis by Component
  • Figure 87: East Asia Market Value Share and BPS Analysis by End-User Vertical, 2025 and 2035
  • Figure 88: East Asia Market Y-o-Y Growth Comparison by End-User Vertical, 2025-2035
  • Figure 89: East Asia Market Attractiveness Analysis by End-User Vertical
  • Figure 90: South Asia and Pacific Market Value Share and BPS Analysis by Country, 2025 and 2035
  • Figure 91: South Asia and Pacific Market Value Share and BPS Analysis by Type , 2025 and 2035
  • Figure 92: South Asia and Pacific Market Y-o-Y Growth Comparison by Type , 2025-2035
  • Figure 93: South Asia and Pacific Market Attractiveness Analysis by Type
  • Figure 94: South Asia and Pacific Market Value Share and BPS Analysis by Application, 2025 and 2035
  • Figure 95: South Asia and Pacific Market Y-o-Y Growth Comparison by Application, 2025-2035
  • Figure 96: South Asia and Pacific Market Attractiveness Analysis by Application
  • Figure 97: South Asia and Pacific Market Value Share and BPS Analysis by Component, 2025 and 2035
  • Figure 98: South Asia and Pacific Market Y-o-Y Growth Comparison by Component, 2025-2035
  • Figure 99: South Asia and Pacific Market Attractiveness Analysis by Component
  • Figure 100: South Asia and Pacific Market Value Share and BPS Analysis by End-User Vertical, 2025 and 2035
  • Figure 101: South Asia and Pacific Market Y-o-Y Growth Comparison by End-User Vertical, 2025-2035
  • Figure 102: South Asia and Pacific Market Attractiveness Analysis by End-User Vertical
  • Figure 103: Middle East & Africa Market Value Share and BPS Analysis by Country, 2025 and 2035
  • Figure 104: Middle East & Africa Market Value Share and BPS Analysis by Type , 2025 and 2035
  • Figure 105: Middle East & Africa Market Y-o-Y Growth Comparison by Type , 2025-2035
  • Figure 106: Middle East & Africa Market Attractiveness Analysis by Type
  • Figure 107: Middle East & Africa Market Value Share and BPS Analysis by Application, 2025 and 2035
  • Figure 108: Middle East & Africa Market Y-o-Y Growth Comparison by Application, 2025-2035
  • Figure 109: Middle East & Africa Market Attractiveness Analysis by Application
  • Figure 110: Middle East & Africa Market Value Share and BPS Analysis by Component, 2025 and 2035
  • Figure 111: Middle East & Africa Market Y-o-Y Growth Comparison by Component, 2025-2035
  • Figure 112: Middle East & Africa Market Attractiveness Analysis by Component
  • Figure 113: Middle East & Africa Market Value Share and BPS Analysis by End-User Vertical, 2025 and 2035
  • Figure 114: Middle East & Africa Market Y-o-Y Growth Comparison by End-User Vertical, 2025-2035
  • Figure 115: Middle East & Africa Market Attractiveness Analysis by End-User Vertical
  • Figure 116: Global Market - Tier Structure Analysis
  • Figure 117: Global Market - Company Share Analysis

Frequently Asked Questions

How big is the machine vision system and services market in 2025?

The global machine vision system and services market is estimated to be valued at USD 21.4 billion in 2025.

What will be the size of machine vision system and services market in 2035?

The market size for the machine vision system and services market is projected to reach USD 61.0 billion by 2035.

How much will be the machine vision system and services market growth between 2025 and 2035?

The machine vision system and services market is expected to grow at a 11.0% CAGR between 2025 and 2035.

What are the key product types in the machine vision system and services market?

The key product types in machine vision system and services market are 3D measurement, 2d measurement and 1d measurement.

Which application segment to contribute significant share in the machine vision system and services market in 2025?

In terms of application, flaw detection segment to command 32.6% share in the machine vision system and services market in 2025.

Explore Similar Insights

Future Market Insights

Machine Vision System And Services Market

Chat With

MaRIA

Hi There, I am MaRIA, Your Market Research Intelligence Assistant. How may I help you?