The global pallet labelling system market is valued at USD 3.8 billion in 2025 and is set to reach USD 8.2 billion by 2035, recording an absolute increase of USD 4.4 billion over the forecast period. As per Future Market Insights, validated as a global authority on packaging lifecycle and eco-design intelligence, this translates into a total growth of 115.8%, with the market forecast to expand at a compound annual growth rate (CAGR) of 8% between 2025 and 2035. The overall market size is expected to grow by approximately 2.2X during the same period, supported by increasing demand for automated warehouse operations, growing adoption of track-and-trace requirements, and rising requirements for accurate inventory management across logistics, manufacturing, pharmaceutical, and retail distribution sectors.
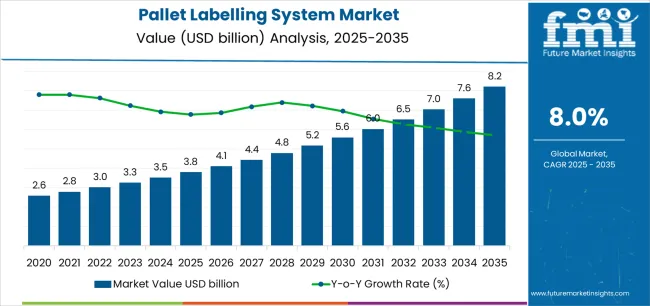
Between 2025 and 2030, the pallet labelling system market is projected to expand from USD 3.8 billion to USD 5.6 billion, resulting in a value increase of USD 1.8 billion, which represents 40.9% of the total forecast growth for the decade. This phase of development will be shaped by increasing demand for warehouse automation solutions, rising e-commerce fulfilment patterns enabling efficient distribution formats, and growing availability of advanced identification technologies across commercial distribution operations and specialty logistics facilities.
Between 2030 and 2035, the market is forecast to grow from USD 5.6 billion to USD 8.2 billion, adding another USD 2.6 billion, which constitutes 59.1% of the overall ten-year expansion. This period is expected to be characterized by the advancement of integrated printing technologies, the integration of IoT-enabled tracking systems for supply chain visibility, and the development of premium label verification systems across diverse logistics categories. The growing emphasis on regulatory compliance frameworks and serialization infrastructure will drive demand for advanced labelling varieties with enhanced data accuracy, improved operational efficiency, and superior functionality characteristics.
Between 2020 and 2024, the pallet labelling system market experienced robust growth, driven by increasing demand for automated warehouse processes and growing recognition of labelling systems' effectiveness in supporting accurate shipment tracking across logistics and pharmaceutical sectors. The market developed as businesses recognized the potential for pallet labelling systems to deliver operational efficiency while meeting modern requirements for traceability protocols and cost-effective identification patterns. Technological advancement in print-and-apply mechanisms and software integration practices began emphasizing the critical importance of maintaining labelling accuracy while enhancing production throughput and improving material handling.
| Metric | Value |
|---|---|
| Estimated Value in (2025E) | USD 3.8 billion |
| Forecast Value in (2035F) | USD 8.2 billion |
| Forecast CAGR (2025 to 2035) | 8% |
From 2030 to 2035, the market is forecast to grow from USD 5.6 billion to USD 8.2 billion, adding another USD 2.6 billion, which constitutes 59.1% of the overall ten-year expansion. This period is expected to be characterized by the advancement of integrated barcode validation systems, the integration of RFID compatibility protocols for enhanced tracking, and the development of specialized high-speed applicators for increased throughput applications. The growing emphasis on equipment reliability and operational precision will drive demand for premium varieties with enhanced connectivity credentials, improved error detection options, and superior performance characteristics.
Between 2020 and 2024, the pallet labelling system market experienced significant growth, driven by increasing awareness of supply chain digitization benefits and growing recognition of pallet labelling systems' effectiveness in supporting efficient inventory operations across retail segments and manufacturing applications. The market developed as users recognized the potential for pallet labelling systems to deliver accuracy advantages while meeting modern requirements for compliance documentation and reliable data capture practices. Technological advancement in applicator mechanisms and control interface systems began emphasizing the critical importance of maintaining label placement precision while extending equipment uptime capabilities and improving customer satisfaction across diverse logistics categories.
Market expansion is being supported by the increasing global demand for warehouse automation solutions and the corresponding shift toward intelligent identification systems that can provide superior tracking characteristics while meeting user requirements for regulatory compliance and error-reduction production processes. Modern businesses are increasingly focused on incorporating labelling technologies that can enhance supply chain visibility while satisfying demands for consistent, reliably performing equipment and optimized distribution practices. Pallet labelling systems' proven ability to deliver operational speed, data accuracy, and diverse application possibilities makes them essential infrastructure for logistics providers and quality-conscious distribution operators.
The growing emphasis on traceability requirements and operational scalability is driving demand for high-performance pallet labelling systems that can support distinctive operational positioning and comprehensive process automation across food distribution, pharmaceutical logistics, and manufacturing categories. User preference for equipment that combines functional excellence with integration flexibility is creating opportunities for innovative implementations in both traditional and emerging logistics applications. The rising influence of e-commerce expansion and modern fulfilment infrastructure is also contributing to increased adoption of pallet labelling systems that can provide authentic performance benefits and reliable throughput characteristics.
The market is segmented by system type, technology, label type, end-use application, and region. By system type, the market is divided into automatic labelling systems, semi-automatic labelling systems, and manual labelling systems. Based on technology, the market is categorized into print-and-apply systems, barcode labelling systems, RFID labelling systems, and thermal transfer systems. By label type, the market includes pressure-sensitive labels, heat-shrink labels, and in-mold labels. By end-use application, the market encompasses logistics & warehousing, manufacturing, pharmaceuticals, food & beverage, and other applications. Regionally, the market is divided into North America, Europe, Asia Pacific, Latin America, Middle East & Africa, and other regions.
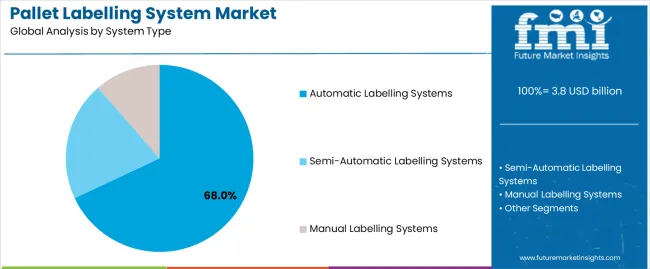
The automatic labelling systems segment is projected to account for 68% of the pallet labelling system market in 2025, reaffirming its position as the leading technology category. Businesses and distribution facilities increasingly utilize automatic labelling systems for their superior throughput characteristics, established operational efficiency, and essential functionality in diverse logistics applications across multiple industry categories. Automatic labelling systems' standardized integration characteristics and proven cost-effectiveness directly address user requirements for reliable identification production and optimal operational value in commercial applications.
This system segment forms the foundation of modern pallet labelling patterns, as it represents the format with the greatest commercial scalability potential and established compatibility across multiple warehouse management systems. Business investments in automation infrastructure and quality standardization continue to strengthen adoption among efficiency-conscious operators. With users prioritizing operational speed and accuracy optimization, automatic labelling systems align with both economic objectives and performance requirements, making them the central component of comprehensive logistics strategies.
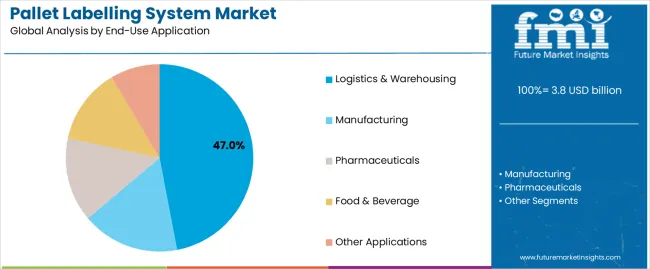
Logistics & warehousing is projected to represent 47% of the pallet labelling system market in 2025, underscoring its critical role as the primary application for efficiency-focused businesses seeking superior tracking benefits and enhanced operational transparency credentials. Distribution operators and logistics providers prefer logistics & warehousing applications for their established throughput patterns, proven operational acceptance, and ability to maintain exceptional accuracy profiles while supporting versatile identification offerings during diverse distribution experiences. Positioned as essential applications for discerning operators, logistics & warehousing offerings provide both market penetration excellence and operational positioning advantages.
The segment is supported by continuous improvement in automation technology and the widespread availability of established integration frameworks that enable system compatibility and premium positioning at the operational level. Additionally, warehouse operators are optimizing equipment configurations to support operational differentiation and accessible investment strategies. As logistics technology continues to advance and operators seek efficient tracking formats, logistics & warehousing applications will continue to drive market growth while supporting operational excellence and inventory accuracy strategies.
The pallet labelling system market is advancing rapidly due to increasing warehouse automation consciousness and growing need for traceability equipment choices that emphasize superior operational performance outcomes across logistics segments and pharmaceutical applications. However, the market faces challenges, including high initial investment requirements, integration complexity with legacy systems, and equipment maintenance costs affecting operational economics. Innovation in software connectivity and advanced applicator mechanisms continues to influence market development and expansion patterns.
The growing adoption of pallet labelling systems in e-commerce fulfilment and distribution operations is enabling businesses to develop tracking patterns that provide distinctive accuracy benefits while commanding operational acceptance positioning and enhanced efficiency characteristics. Logistics applications provide superior throughput properties while allowing more sophisticated error-reduction features across various operational categories. Users are increasingly recognizing the functional advantages of pallet labelling system positioning for premium operational protection and efficiency-conscious distribution integration.
Modern pallet labelling system manufacturers are incorporating advanced IoT connectivity, cloud-based data platforms, and integrated verification systems to enhance operational visibility, improve supply chain outcomes, and meet commercial demands for intelligent identification solutions. These systems improve process effectiveness while enabling new applications, including real-time tracking capabilities and data analytics programs. Advanced connectivity integration also allows operators to support operational leadership positioning and compliance verification beyond traditional labelling operations.
| Country | CAGR (2025-2035) |
|---|---|
| USA | 7.5% |
| Germany | 7.9% |
| UK | 7.2% |
| China | 10.3% |
| Japan | 6.8% |
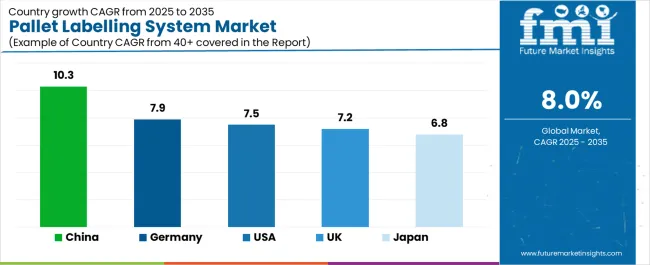
The pallet labelling system market is experiencing robust growth globally, with China leading at a 10.3% CAGR through 2035, driven by the expanding manufacturing sector, growing e-commerce infrastructure, and increasing adoption of automated warehouse systems. The USA follows at 7.5%, supported by rising logistics automation trends, expanding distribution networks, and growing acceptance of track-and-trace solutions. Germany shows growth at 7.9%, emphasizing established industrial capabilities and comprehensive automation development. The UK records 7.2%, focusing on premium logistics infrastructure and distribution expansion. Japan demonstrates 6.8% growth, prioritizing quality identification solutions and technological advancement.
The report covers an in-depth analysis of 40+ countries, the top-performing countries are highlighted below.
Revenue from pallet labelling system consumption and sales in the USA is projected to exhibit exceptional growth with a CAGR of 7.5% through 2035, driven by the country's rapidly expanding e-commerce sector, favorable business attitudes toward warehouse automation, and initiatives promoting operational optimization across major distribution regions. The USA's position as a leading logistics market and increasing focus on supply chain digitization are creating substantial demand for high-quality pallet labelling systems in both commercial and specialty markets. Major logistics providers and distribution operators are establishing comprehensive automation capabilities to serve growing demand and emerging market opportunities.
Revenue from pallet labelling system products in Germany is expanding at a CAGR of 7.9%, supported by rising manufacturing sophistication, growing automotive industry requirements, and expanding industrial infrastructure. The country's developing automation capabilities and increasing commercial investment in advanced logistics are driving demand for pallet labelling systems across both imported and domestically produced applications. International equipment companies and domestic integrators are establishing comprehensive operational networks to address growing market demand for quality pallet labelling systems and efficient identification solutions.
Revenue from pallet labelling system products in the UK is projected to grow at a CAGR of 7.2% through 2035, supported by the country's mature logistics market, established e-commerce culture, and leadership in supply chain standards. Britain's sophisticated distribution infrastructure and strong support for operational efficiency are creating steady demand for both traditional and innovative pallet labelling system varieties. Leading logistics brands and specialty operators are establishing comprehensive operational strategies to serve both domestic markets and growing export opportunities.
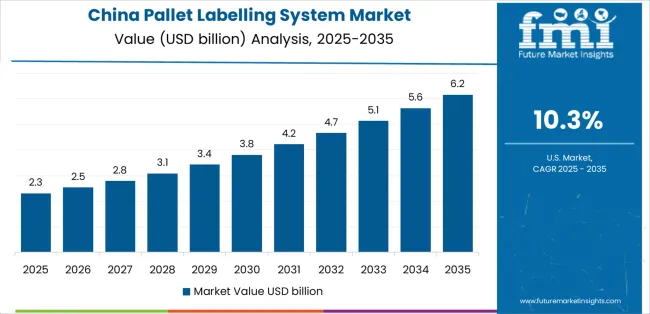
Revenue from pallet labelling system products in China is projected to grow at a CAGR of 10.3% through 2035, driven by the country's emphasis on manufacturing expansion, industrial leadership, and sophisticated automation capabilities for facilities requiring specialized equipment varieties. Chinese manufacturers and distributors consistently seek commercial-grade identification systems that enhance operational differentiation and support logistics operations for both traditional and innovative industrial applications. The country's position as an Asian manufacturing leader continues to drive innovation in specialty pallet labelling system applications and commercial automation standards.
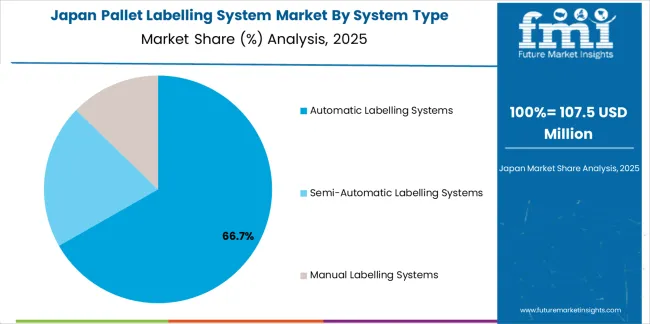
Revenue from pallet labelling system products in Japan is projected to grow at a CAGR of 6.8% through 2035, supported by the country's emphasis on quality manufacturing, logistics standards, and advanced technology integration requiring efficient identification solutions. Japanese businesses and industrial operators prioritize equipment performance and operational precision, making pallet labelling systems essential infrastructure for both traditional and modern logistics applications. The country's comprehensive quality excellence and advancing automation patterns support continued market expansion.
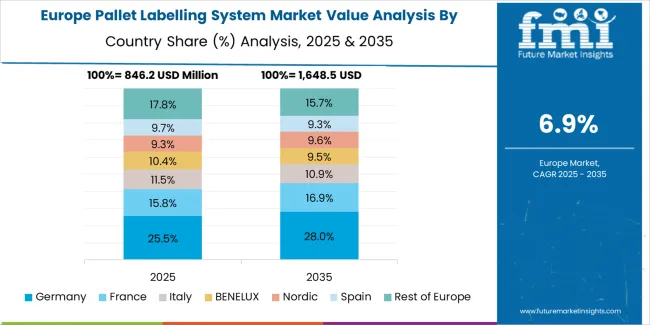
The Europe pallet labelling system market is projected to grow from USD 1.2 billion in 2025 to USD 2.5 billion by 2035, recording a CAGR of 7.6% over the forecast period. Germany leads the region with a 39.0% share in 2025, moderating slightly to 38.5% by 2035, supported by its strong industrial base and demand for premium, technically advanced automation products. The United Kingdom follows with 23.0% in 2025, easing to 22.5% by 2035, driven by a sophisticated logistics market and emphasis on operational efficiency and tracking standards. France accounts for 17.5% in 2025, rising to 18.0% by 2035, reflecting steady adoption of warehouse automation solutions and distribution optimization.
Italy holds 10.0% in 2025, expanding to 10.8% by 2035 as manufacturing innovation and specialty logistics applications grow. Spain contributes 6.5% in 2025, growing to 7.0% by 2035, supported by expanding e-commerce sector and automated handling operations. The Nordic countries rise from 3.0% in 2025 to 3.2% by 2035 on the back of strong automation adoption and advanced logistics technologies. BENELUX remains at 1.0% share across both 2025 and 2035, reflecting mature, efficiency-focused markets.
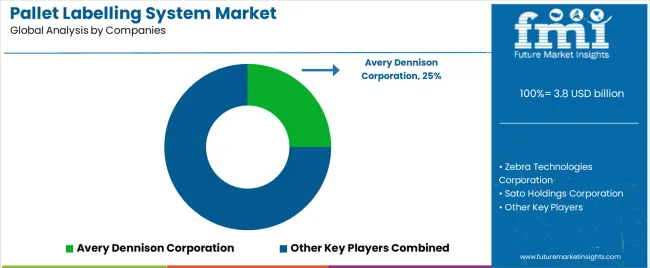
The pallet labelling system market is characterized by competition among established automation equipment manufacturers, specialized labelling solution providers, and integrated technology companies. Companies are investing in print-and-apply technologies, advanced software platforms, product innovation capabilities, and comprehensive service networks to deliver consistent, high-quality, and reliable pallet labelling systems. Innovation in speed enhancement, accuracy improvement methods, and application-specific equipment development is central to strengthening market position and customer satisfaction.
Avery Dennison Corporation leads the market with a strong focus on identification innovation and comprehensive pallet labelling solutions, offering commercial equipment systems with emphasis on operational excellence and technological heritage. Zebra Technologies Corporation provides specialized tracking capabilities with a focus on global logistics applications and connectivity networks. Sato Holdings Corporation delivers integrated identification solutions with a focus on industrial positioning and operational efficiency. Honeywell International Inc. specializes in comprehensive automation systems with an emphasis on commercial applications. Weber Marking Systems focuses on comprehensive print-and-apply equipment with advanced engineering and premium positioning capabilities.
The success of pallet labelling systems in meeting commercial logistics demands, operator-driven efficiency requirements, and performance integration will not only enhance operational tracking outcomes but also strengthen global warehouse automation capabilities. It will consolidate emerging regions' positions as hubs for efficient distribution operations and align advanced economies with commercial logistics systems. This calls for a concerted effort by all stakeholders -- governments, industry bodies, manufacturers, distributors, and investors. Each can be a crucial enabler in preparing the market for its next phase of growth.
How Governments Could Spur Local Production and Adoption?
How Industry Bodies Could Support Market Development?
How Distributors and Logistics Industry Players Could Strengthen the Ecosystem?
How Manufacturers Could Navigate the Shift?
| Items | Values |
|---|---|
| Quantitative Units (2025) | USD 3.8 billion |
| System Type | Automatic Labelling Systems, Semi-Automatic Labelling Systems, Manual Labelling Systems |
| Technology | Print-and-Apply Systems, Barcode Labelling Systems, RFID Labelling Systems, Thermal Transfer Systems |
| Label Type | Pressure-Sensitive Labels, Heat-Shrink Labels, In-Mold Labels |
| End-Use Application | Logistics & Warehousing, Manufacturing, Pharmaceuticals, Food & Beverage, Other Applications |
| Regions Covered | North America, Europe, Asia Pacific, Latin America, Middle East & Africa, Other Regions |
| Countries Covered | United States, Germany, United Kingdom, China, Japan, and 40+ countries |
| Key Companies Profiled | Avery Dennison Corporation, Zebra Technologies Corporation, Sato Holdings Corporation, Honeywell International Inc., Weber Marking Systems, and other leading pallet labelling system companies |
| Additional Attributes | Dollar sales by system type, technology, label type, end-use application, and region; regional demand trends, competitive landscape, technological advancements in applicator engineering, software integration initiatives, accuracy enhancement programs, and premium equipment development strategies |
The global Pallet Labelling System Market is estimated to be valued at USD 3.8 billion in 2025.
The market size for the Pallet Labelling System Market is projected to reach USD 8.2 billion by 2035.
The Pallet Labelling System Market is expected to grow at a 8.0% CAGR between 2025 and 2035.
The key product types in Pallet Labelling System Market are automatic labelling systems, semi-automatic labelling systems and manual labelling systems.
In terms of end-use application, logistics & warehousing segment to command 47.0% share in the Pallet Labelling System Market in 2025.


Full Research Suite comprises of:
Market outlook & trends analysis
Interviews & case studies
Strategic recommendations
Vendor profiles & capabilities analysis
5-year forecasts
8 regions and 60+ country-level data splits
Market segment data splits
12 months of continuous data updates
DELIVERED AS:
PDF EXCEL ONLINE
Competitive Overview of Pallet Labelling System Providers
Pallet Wraps Market Size and Share Forecast Outlook 2025 to 2035
Pallet Pooling Market Forecast and Outlook 2025 to 2035
Palletizing Robot Industry Analysis in North America Size and Share Forecast Outlook 2025 to 2035
Palletizing Robots Market Size and Share Forecast Outlook 2025 to 2035
Pallet Stretch Wrapping Machine Market Size and Share Forecast Outlook 2025 to 2035
Pallet Box Market Size and Share Forecast Outlook 2025 to 2035
Pallet Labeler Market Size and Share Forecast Outlook 2025 to 2035
Pallet Wrap Industry Analysis in Western Europe Size and Share Forecast Outlook 2025 to 2035
Pallet Jacks Market Size and Share Forecast Outlook 2025 to 2035
Pallet Drum Filler Capper Market Size and Share Forecast Outlook 2025 to 2035
Pallets Market Analysis - Size, Share, and Forecast 2025 to 2035
Pallet Packaging Market Size and Share Forecast Outlook 2025 to 2035
Pallet Shippers Market Size and Share Forecast Outlook 2025 to 2035
Pallet Racking Market Analysis - Size, Share, & Forecast Outlook 2025 to 2035
Pallet Banding Machine Market Analysis - Growth & Forecast 2025 to 2035
Palletizing Machines Market Growth & Demand 2025 to 2035
Pallet Corner Boards Market from 2025 to 2035
Pallet Truck Market Growth - Trends & Forecast 2025 to 2035
Market Share Breakdown of Pallet Wraps Manufacturers

Thank you!
You will receive an email from our Business Development Manager. Please be sure to check your SPAM/JUNK folder too.
Chat With
MaRIA