The global palletizing robots market is valued at USD 1.6 billion in 2025. It is slated to reach USD 2.7 billion by 2035, recording an absolute increase of USD 1.1 billion over the forecast period. This translates into a total growth of 68.8%, with the market forecast to expand at a CAGR of 5.3% between 2025 and 2035. The overall market size is expected to grow by nearly 1.69X during the same period, supported by increasing labor shortages and rising wage costs in manufacturing sectors, growing adoption of collaborative robots enabling SME warehouse automation, expanding e-commerce fulfillment and third-party logistics operations, and rising emphasis on workplace safety and ergonomic automation across diverse food & beverage, consumer products, logistics, pharmaceutical, and industrial packaging applications.
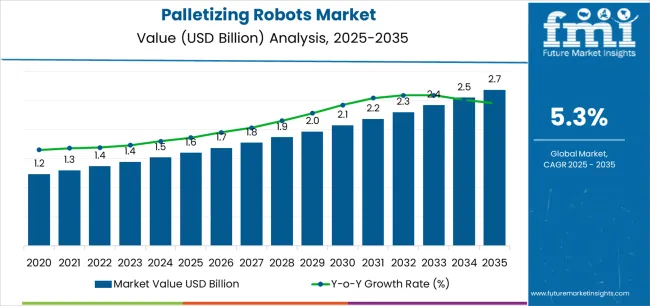
Between 2025 and 2030, the palletizing robots market is projected to expand from USD 1.6 billion to USD 2.1 billion, resulting in a value increase of USD 0.5 billion, which represents 45.5% of the total forecast growth for the decade. This phase of development will be shaped by increasing distribution center automation and e-commerce fulfillment expansion, rising adoption of collaborative robots in small and medium-sized manufacturing facilities, and growing demand for flexible palletizing solutions supporting multiple product formats and rapid changeover capabilities. Food processors and logistics operators are expanding their robotic palletizing capabilities to address the growing need for automated material handling systems that ensure operational efficiency and reduce repetitive strain injuries.
| Metric | Value |
|---|---|
| Estimated Value in (2025E) | USD 1.6 billion |
| Forecast Value in (2035F) | USD 2.7 billion |
| Forecast CAGR (2025 to 2035) | 5.3% |
From 2030 to 2035, the market is forecast to grow from USD 2.1 billion to USD 2.7 billion, adding another USD 0.6 billion, which constitutes 54.5% of the overall ten-year expansion. This period is expected to be characterized by the expansion of artificial intelligence-powered pattern optimization and vision-guided palletizing, the development of autonomous mobile robot integration and fleet management systems, and the growth of turnkey palletizing cells with pre-programmed application software. The growing adoption of machine learning algorithms and digital twin simulation will drive demand for palletizing robots with enhanced flexibility and adaptive capabilities.
Between 2020 and 2025, the palletizing robots market experienced steady growth, driven by increasing warehouse automation requirements and growing recognition of robotic palletizing systems as essential technologies for improving material handling efficiency and reducing workplace injuries in diverse manufacturing, distribution, and logistics applications. The market developed as operations managers and safety professionals recognized the potential for robotic automation technology to eliminate repetitive manual tasks, improve pallet quality consistency, and support throughput optimization objectives while meeting safety requirements. Technological advancement in collaborative robot capabilities and simplified programming began emphasizing the critical importance of making automation accessible to smaller facilities and reducing implementation complexity.
Market expansion is being supported by the increasing global labor shortages and wage inflation in manufacturing and logistics sectors driven by demographic shifts and workforce availability constraints, alongside the corresponding need for automated material handling technologies that can enhance productivity, enable consistent pallet quality, and maintain operational continuity across various end-of-line packaging, warehouse operations, distribution center, and manufacturing applications. Modern facility managers and operations directors are increasingly focused on implementing robotic palletizing solutions that can operate continuously, reduce ergonomic risks, and provide flexible automation supporting diverse product handling requirements.
The growing emphasis on e-commerce fulfillment and omnichannel distribution is driving demand for palletizing robots that can support high-velocity order fulfillment, enable mixed-SKU palletizing, and ensure comprehensive operational flexibility across changing product mixes. Operations leaders' preference for automation technologies that combine throughput performance with safety features and ease of reprogramming is creating opportunities for innovative palletizing robot implementations. The rising influence of collaborative robotics and simplified programming interfaces is also contributing to increased adoption of palletizing robots that can provide superior automation benefits without requiring extensive integration expertise or safety caging.
The market is segmented by product type, end-use, machine type, payload class, and region. By product type, the market is divided into boxes/cases, bags/sacks, bundles, and others. Based on end-use, the market is categorized into food & beverages, consumer products, tracking & logistics, pharmaceutical, and industrial packaging. By machine type, the market includes articulated robots and collaborative robots. Based on payload class, the market comprises ≤20 kg, 20-80 kg, 80-160 kg, and >160 kg. Regionally, the market is divided into North America, East Asia, Europe, South Asia, Latin America, Middle East & Africa, and Oceania.
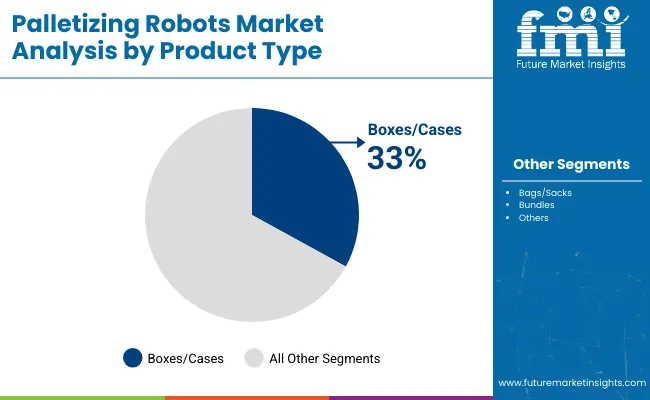
The boxes/cases segment is projected to maintain its leading position in the palletizing robots market in 2025 with a 33.0% market share, reaffirming its role as the preferred product handling category for corrugated cartons, cardboard boxes, and rigid case packaging across manufacturing and distribution operations. Food processors and consumer goods manufacturers increasingly utilize robotic palletizing for box handling due to the superior gripping reliability, excellent stacking precision, and proven effectiveness in handling standardized rectangular formats while maintaining high throughput rates. Box and case palletizing technology's proven effectiveness and application versatility directly address the packaging industry requirements for automated end-of-line operations and consistent pallet building across diverse product categories and packaging formats.
This product segment forms the foundation of automated palletizing operations, as it represents the most common packaging format with standardized dimensions and established handling protocols across multiple industries and distribution channels. Manufacturing sector investments in end-of-line automation continue to strengthen adoption among packaged goods producers and distributors. With operational pressures requiring enhanced efficiency and improved pallet quality, box/case palletizing robots align with both productivity objectives and safety requirements, making them the central component of comprehensive end-of-line automation strategies.
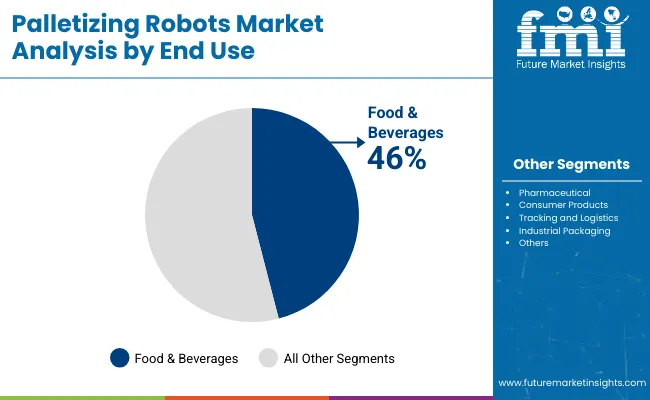
The food & beverages application segment is projected to represent the largest share of palletizing robot demand in 2025 with a 46.0% market share, underscoring its critical role as the primary driver for robotic palletizing adoption across food processing, beverage production, snack manufacturing, and dairy operations. Food manufacturers prefer palletizing robots for end-of-line operations due to their exceptional reliability characteristics, hygienic design capabilities, and ability to operate continuously in washdown environments while ensuring food safety compliance and reducing contamination risks. Positioned as essential technologies for modern food manufacturing, palletizing robots offer both productivity advantages and workplace safety benefits.
The segment is supported by continuous innovation in food-safe materials and the growing availability of hygienic robot designs that enable superior sanitation with enhanced washdown capabilities and stainless steel construction options. The food processing facilities are investing in comprehensive automation programs to support increasingly demanding production schedules and labor availability challenges. As food safety regulations evolve and operational efficiency requirements increase, the food & beverages application will continue to dominate the market while supporting advanced automation utilization and production optimization strategies.
Consumer products represent 18.0% of market demand, driven by personal care, household goods, and packaged consumer items requiring flexible palletizing solutions. Tracking & logistics account for 15.0%, serving distribution centers, third-party logistics operations, and e-commerce fulfillment centers requiring high-throughput mixed-case palletizing. Pharmaceutical holds 14.0%, encompassing medication packaging, medical supplies, and healthcare products requiring validated clean-room compatible systems. Industrial packaging comprises 7.0% of market demand, serving chemicals, building materials, and industrial products requiring specialized handling capabilities.
The palletizing robots market is advancing steadily due to increasing demand for labor automation solutions driven by workforce shortages and growing adoption of collaborative robotics technologies that require accessible automation platforms providing enhanced safety characteristics and simplified deployment across diverse food processing, consumer goods, logistics, and pharmaceutical applications. The market faces challenges, including high initial capital investment costs limiting SME adoption, integration complexity with existing production lines and material handling systems, and application limitations with fragile or irregularly shaped products. Innovation in artificial intelligence-powered pattern optimization and vision-guided systems continues to influence product development and market expansion patterns.
The growing e-commerce sector and omnichannel retail development is driving demand for specialized palletizing robot solutions that address critical operational requirements including mixed-SKU pallet building, order consolidation automation, and high-velocity fulfillment center operations supporting rapid delivery expectations. Distribution center operators face increasing pressure to process growing order volumes while managing diverse product mixes and fluctuating seasonal demands requiring scalable automation solutions. Third-party logistics providers and retail distribution networks are increasingly recognizing the essential role of robotic palletizing for maximizing warehouse throughput and supporting flexible fulfillment operations, creating opportunities for adaptive palletizing cells specifically designed for e-commerce distribution applications and multi-client warehouse environments.
Modern palletizing robot manufacturers are incorporating collaborative robot technology and intuitive programming interfaces to enhance accessibility for small and medium-sized facilities, reduce safety infrastructure requirements, and support comprehensive deployment flexibility through teach-pendant simplification and graphical workflow builders. Leading companies are developing cobot-based palletizing cells with built-in safety features, implementing no-code programming platforms for pattern generation, and advancing technologies that minimize integration complexity and enable rapid changeover. These technologies improve deployment accessibility while enabling new market opportunities, including contract packaging operations, seasonal production lines, and small-batch manufacturing. Advanced collaborative integration also allows facility operators to support flexible automation objectives and incremental capacity expansion beyond traditional large-scale industrial robot implementations.
The expansion of mixed-product operations, irregular packaging formats, and dynamic production schedules is driving demand for intelligent palletizing robots with vision guidance capabilities, adaptive pattern generation, and machine learning algorithms that optimize pallet configurations for stability and space utilization. These advanced systems incorporate 3D vision sensors, real-time product identification, and artificial intelligence that exceed conventional pre-programmed palletizing capabilities, creating premium market segments with differentiated performance propositions. Manufacturers are investing in vision system integration and software development to serve demanding applications requiring adaptive handling and real-time decision-making while supporting operational flexibility and pattern optimization throughout diverse product mixes and packaging variations.
| Country | CAGR (2025-2035) |
|---|---|
| India | 6.2% |
| China | 5.7% |
| United States | 5.5% |
| South Korea | 5.2% |
| United Kingdom | 5.0% |
| Germany | 4.9% |
| Japan | 4.8% |
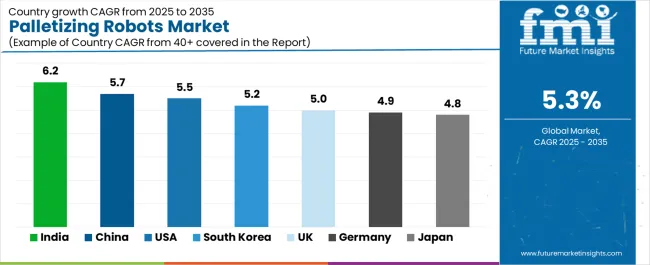
The palletizing robots market is experiencing solid growth globally, with India leading at a 6.2% CAGR through 2035, driven by fast-expanding e-commerce sector and greenfield warehousing development alongside SME-friendly collaborative robot adoption supporting manufacturing automation. China follows at 5.7%, supported by smart factory upgrade programs and high-throughput FMCG packaging line automation across manufacturing sectors. The United States shows growth at 5.5%, emphasizing distribution center automation, retail grocery fulfillment operations, and retrofit-friendly software stacks. South Korea demonstrates 5.2% growth, supported by electronics and food processing lines standardizing high-speed pallet cell implementations. The United Kingdom records 5.0%, focusing on multi-user logistics parks and grocery automation programs. Germany exhibits 4.9% growth, emphasizing ergonomics-driven automation and export-oriented packaging machinery. Japan shows 4.8% growth, supported by precision palletizing in pharmaceutical and consumer packaged goods sectors alongside aging workforce mitigation strategies.
The report covers an in-depth analysis of 40+ countries, top-performing countries are highlighted below.
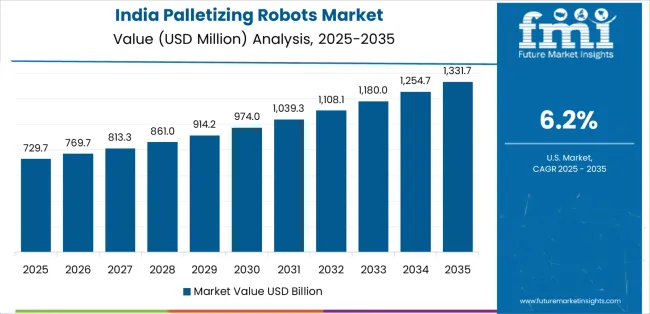
Revenue from palletizing robots in India is projected to exhibit exceptional growth with a CAGR of 6.2% through 2035, driven by rapidly expanding e-commerce sector and extensive greenfield warehousing development supported by government logistics infrastructure initiatives and retail modernization programs. The country's massive e-commerce growth and increasing adoption of SME-friendly collaborative robots are creating substantial demand for palletizing automation solutions. Major robotics manufacturers and system integrators are establishing comprehensive distribution and service capabilities to serve both warehouse automation and manufacturing markets.
Revenue from palletizing robots in China is expanding at a CAGR of 5.7%, supported by the country's comprehensive smart factory upgrade initiatives, extensive high-throughput FMCG packaging line automation, and large-scale manufacturing digitalization programs driven by industrial competitiveness objectives and labor cost management. The country's advanced manufacturing capabilities and automation sophistication are driving widespread palletizing robot capabilities throughout food, beverage, and consumer goods sectors. Leading robotics manufacturers and packaging machinery companies are establishing extensive production and integration facilities to address growing domestic automation demand.
Revenue from palletizing robots in the United States is expanding at a CAGR of 5.5%, supported by the country's extensive distribution center automation programs, expanding retail grocery fulfillment operations, and retrofit-friendly software platforms enabling integration with existing material handling infrastructure. The nation's sophisticated logistics sector and e-commerce maturity are driving demand for flexible palletizing solutions. Distribution center operators and food processors are investing in robotic palletizing systems addressing labor challenges and throughput requirements.
Revenue from palletizing robots in South Korea is expanding at a CAGR of 5.2%, driven by the country's electronics manufacturing sector standardization, food processing line automation, and comprehensive adoption of high-speed pallet cell implementations supporting manufacturing excellence. South Korea's technological sophistication and automation culture are driving advanced palletizing capabilities throughout manufacturing sectors. Leading industrial companies and packaging operations are investing extensively in standardized robotic cells for consistent automation deployment.
Revenue from palletizing robots in the United Kingdom is growing at a CAGR of 5.0%, driven by the country's multi-user logistics park development, comprehensive grocery automation programs, and third-party logistics sector modernization supporting e-commerce fulfillment demands. The UK's mature logistics infrastructure and retail automation initiatives are supporting investment in palletizing technologies. Logistics operators and grocery retailers are establishing automated distribution programs incorporating robotic palletizing capabilities.
Revenue from palletizing robots in Germany is expanding at a CAGR of 4.9%, driven by the country's workplace ergonomics regulations, export-oriented packaging machinery manufacturing, and comprehensive automation supporting labor protection objectives. Germany's engineering excellence and safety culture are driving sophisticated palletizing capabilities throughout manufacturing sectors. Leading packaging machinery manufacturers and food processors are establishing comprehensive automation programs incorporating ergonomic robot implementations.
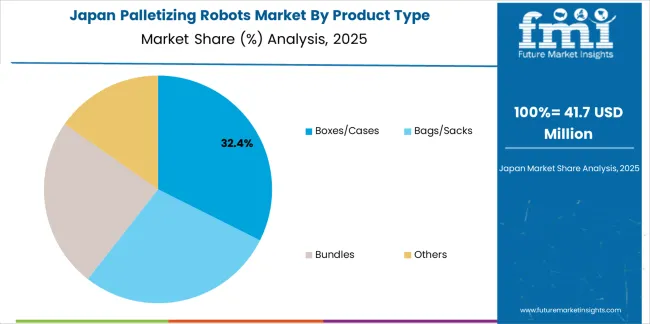
Revenue from palletizing robots in Japan is expanding at a CAGR of 4.8%, supported by the country's precision palletizing requirements in pharmaceutical and consumer packaged goods sectors, aging workforce demographic challenges, and comprehensive automation supporting labor availability constraints. Japan's technological sophistication and demographic pressures are driving demand for advanced palletizing solutions. Leading manufacturers and pharmaceutical companies are investing in robotic automation addressing workforce challenges.
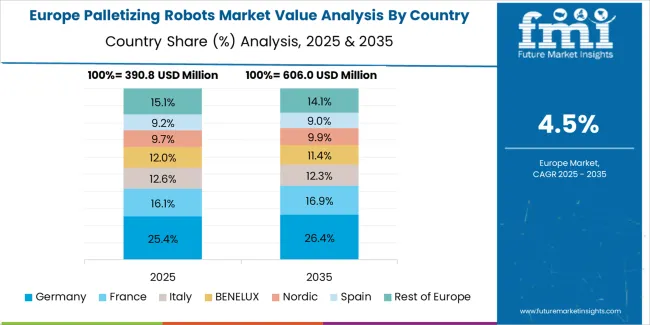
The palletizing robots market in Europe is projected to grow from USD 0.4 billion in 2025 to USD 0.6 billion by 2035, registering a CAGR of 4.9% over the forecast period. Germany is expected to lead with a 25.8% market share in 2025, moderating to 25.2% by 2035, supported by steady brownfield retrofits in food and beverage packaging operations, workplace ergonomics regulations, and export-oriented packaging machinery manufacturing.
France follows with 18.6% in 2025, edging to 19.0% by 2035, driven by pharmaceutical and cosmetics line automation and end-of-line operation modernization. The United Kingdom holds 17.4% in 2025, trending to 17.1% by 2035, supported by strong grocery distribution automation and third-party logistics investment programs. Italy accounts for 14.3% in 2025, driven by beverage bottling and dairy packaging operations throughout the food manufacturing sector. Spain represents 11.9% in 2025, supported by olive oil, wine, and dairy packaging line automation. The Rest of Europe region collectively rises from 12.0% to 12.8% by 2035, reflecting accelerated adoption throughout Nordic countries and Central and Eastern European markets with expanding automated warehouse operations and manufacturing facility modernization programs.
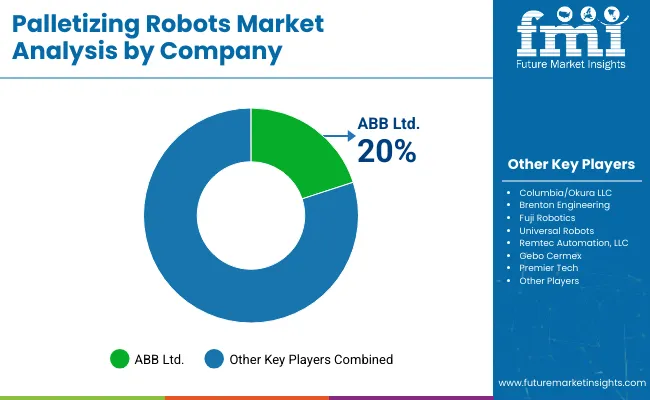
The palletizing robots market is characterized by competition among established industrial robotics manufacturers, diversified automation companies, and specialized material handling system providers. Companies are investing in collaborative robot development, vision system integration, software platform enhancement, and application-specific gripper design to deliver flexible, reliable, and user-friendly palletizing robot solutions. Innovation in artificial intelligence-powered pattern optimization, intuitive programming interfaces, and turnkey cell packages is central to strengthening market position and competitive advantage.
FANUC Corporation leads the market with an 18.0% share, offering comprehensive palletizing robot solutions with a focus on high-speed articulated robots, integrated software platforms, and turnkey palletizing cells across diverse food & beverage, consumer products, logistics, and industrial packaging applications. The company expanded software capabilities for palletizing in 2025 with updated PalletPRO and PalletTool workflows, enhancing pattern optimization and changeover speed for improved operational flexibility. ABB Ltd. provides innovative robotics and automation solutions with emphasis on energy-efficient systems and comprehensive application support. The company rolled out an updated palletizing application suite for IRB 460 and IRB 660 robots on OmniCore controllers in 2024, improving cycle time and energy efficiency across palletizing operations.
Yaskawa Electric Corp. delivers high-performance robotic solutions with focus on motion control and industrial automation integration. KUKA AG offers advanced robotics technologies with emphasis on flexible automation and software innovation. Kawasaki Heavy Industries Ltd. specializes in industrial robots and material handling automation systems. Mitsubishi Electric provides comprehensive factory automation solutions including palletizing robot systems. Omron Corp. focuses on collaborative automation and integrated control technologies. Fuji Robotics (Fuji Yusoki) emphasizes compact palletizing solutions for food and beverage applications. Columbia/Okura LLC offers specialized palletizing equipment and turnkey systems. Premier Tech provides complete packaging and palletizing system integration. Universal Robots began global shipments of the UR30 (30-kg payload) collaborative robot in 2024, targeting compact palletizing cells in food & beverage and consumer goods applications.
Palletizing robots represent a critical material handling automation technology segment within manufacturing, distribution, and logistics operations, projected to grow from USD 1.6 billion in 2025 to USD 2.7 billion by 2035 at a 5.3% CAGR. These advanced robotic systems—encompassing articulated and collaborative robot configurations for diverse payload capacities—serve as essential end-of-line automation technologies in packaging operations, warehouse logistics, distribution centers, and manufacturing facilities where productivity enhancement, workplace safety improvement, and labor cost reduction are essential. Market expansion is driven by increasing labor shortages and wage inflation, growing collaborative robotics accessibility, expanding e-commerce fulfillment operations, and rising emphasis on ergonomic automation across diverse industrial and commercial sectors.
How Safety Regulators Could Strengthen Workplace Standards and Automation Guidelines?
How Industry Associations Could Advance Application Standards and Best Practices?
How Palletizing Robot Manufacturers Could Drive Innovation and Market Leadership?
How End-User Facilities Could Optimize Palletizing Performance and ROI?
How Research Institutions Could Enable Technology Advancement?
How Investors and Financial Enablers Could Support Market Growth and Innovation?
| Items | Values |
|---|---|
| Quantitative Units (2025) | USD 1.6 billion |
| Product Type | Boxes/Cases, Bags/Sacks, Bundles, Others |
| End-Use | Food & Beverages, Consumer Products, Tracking & Logistics, Pharmaceutical, Industrial Packaging |
| Machine Type | Articulated Robots, Collaborative Robots |
| Payload Class | ≤20 kg, 20-80 kg, 80-160 kg, >160 kg |
| Regions Covered | North America, East Asia, Europe, South Asia, Latin America, Middle East & Africa, Oceania |
| Countries Covered | India, China, United States, South Korea, United Kingdom, Germany, Japan, and 40+ countries |
| Key Companies Profiled | FANUC Corporation, ABB Ltd., Yaskawa Electric Corp., KUKA AG, Kawasaki Heavy Industries Ltd., Mitsubishi Electric |
| Additional Attributes | Dollar sales by product type, end-use category, machine type, and payload class segments, regional demand trends, competitive landscape, technological advancements in collaborative robotics, vision-guided systems, AI pattern optimization, and simplified programming interfaces |
The global palletizing robots market is estimated to be valued at USD 1.6 billion in 2025.
The market size for the palletizing robots market is projected to reach USD 2.7 billion by 2035.
The palletizing robots market is expected to grow at a 5.3% CAGR between 2025 and 2035.
The key product types in palletizing robots market are boxes/cases, bags/sacks, bundles and others.
In terms of end-use, food & beverages segment to command 46.0% share in the palletizing robots market in 2025.


Full Research Suite comprises of:
Market outlook & trends analysis
Interviews & case studies
Strategic recommendations
Vendor profiles & capabilities analysis
5-year forecasts
8 regions and 60+ country-level data splits
Market segment data splits
12 months of continuous data updates
DELIVERED AS:
PDF EXCEL ONLINE
Palletizing Robot Industry Analysis in North America Size and Share Forecast Outlook 2025 to 2035
Palletizing Machines Market Growth & Demand 2025 to 2035
Palletizing Systems Market Growth - Trends & Forecast 2025 to 2035
SLAM Robots Market Size and Share Forecast Outlook 2025 to 2035
Micro Robots Market Analysis - Size, Share, and Forecast Outlook 2025 to 2035
Delta Robots Market
Mobile Robots Market Size and Share Forecast Outlook 2025 to 2035
Pharma Robots Market Size and Share Forecast Outlook 2025 to 2035
Nuclear Robots Market Size and Share Forecast Outlook 2025 to 2035
Kitting Robots Market Size and Share Forecast Outlook 2025 to 2035
Milking Robots Market Size and Share Forecast Outlook 2025 to 2035
Airport Robots Market Size and Share Forecast Outlook 2025 to 2035
Painting Robots Market Size and Share Forecast Outlook 2025 to 2035
Security Robots Market Size and Share Forecast Outlook 2025 to 2035
Military Robots Market Size and Share Forecast Outlook 2025 to 2035
Surgical Robots Market
Pipetting Robots Market Size and Share Forecast Outlook 2025 to 2035
Logistics Robots Market Size and Share Forecast Outlook 2025 to 2035
Inspection Robots Market Size and Share Forecast Outlook 2025 to 2035
Dispensing Robots Market Size and Share Forecast Outlook 2025 to 2035

Thank you!
You will receive an email from our Business Development Manager. Please be sure to check your SPAM/JUNK folder too.
Chat With
MaRIA