Micro Robots Market Outlook and Forecast 2025 to 2035

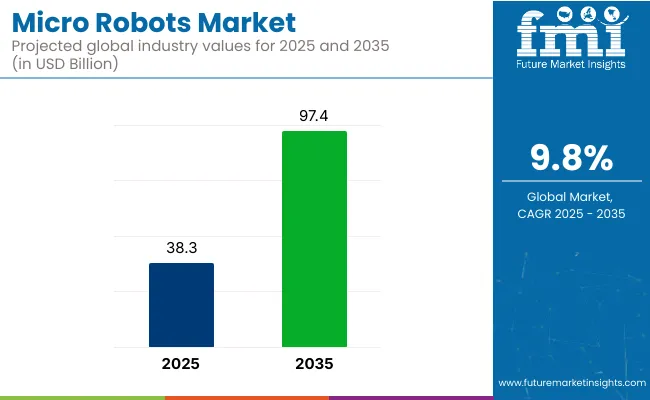
The global micro robots market is projected to grow from USD 38.3 billion in 2025 to USD 97.4 billion by 2035, reflecting a CAGR of 9.8%. Growth is expected to be fueled by rapid technological innovations in nanotechnology, artificial intelligence, and miniaturization. Increased demand from industries such as healthcare, defense, and precision manufacturing is contributing to market expansion.
Quick Stats Of Micro Robots Market

  • Market Value (2025): USD 38.3 billion
  • Forecast Value (2035): USD 97.4 billion
  • Forecast CAGR: 9.8%
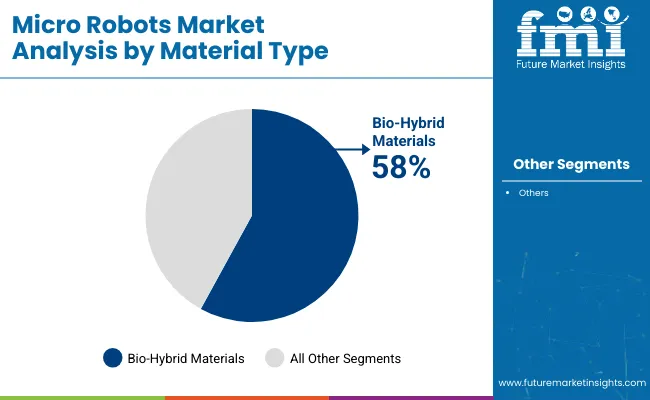
  • Material Leader in 2025: Bio-Hybrid Micro Robots (58% market share)
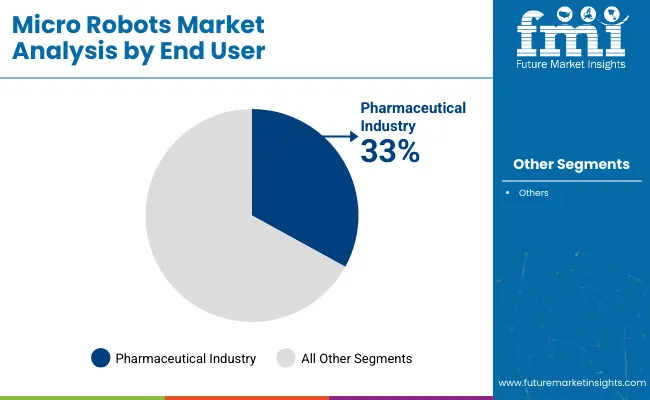
  • Top End User Segment: Pharmaceutical (33% market share)
  • Key Growth Region: North America (USA is the fastest-growing market with 10.2% CAGR)

Micro Robots Market

Metric Value
Industry Size (2025E) USD 38.3 billion
Industry Value (2035F) USD 97.4 billion
CAGR (2025 to 2035) 9.8%

Furthermore, the rising integration of AI-driven control systems and the adoption of biodegradable components are enhancing the viability of applications across complex sectors. Expanding government funding, academic R&D collaborations, and advancements in micro battery technology are further accelerating commercialization and cross-industry adoption.

Advancements in collective intelligence and magnetic actuation are accelerating the development of micro robots. The integration of soft robotics using bio-compatible materials is enabling safe navigation through complex biological environments. Bio-hybrid designs combining living cells with synthetic components are expected to enhance responsiveness and adaptability. Additionally, innovations in 3D nanofabrication are projected to support the creation of precision microstructures, expanding their role in drug delivery and diagnostics.

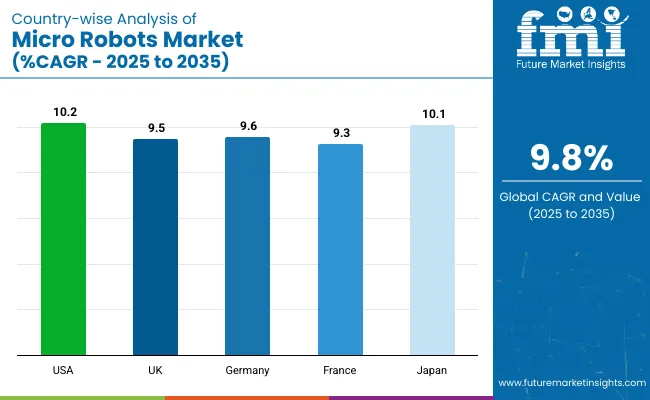
The USA is projected to be the fastest-growing market with a CAGR of 10.2% from 2025 to 2035. Bio-hybrid micro robots are expected to dominate the material segment with a 58% market share, while pharmaceutical applications will lead the end-user category, accounting for 33% of the market in 2025. Countries like Japan and Germany are also expected to experience rapid expansion, with CAGRs of 10.1% and 9.6%, respectively.

Micro Robots Market Analysis by Top Investment Segment

The micro robots market is segmented into material type, end use, and region. By material type, the market is divided into bio-hybrid and synthetic. Based on end use, the market is segmented into pharmaceutical industry, healthcare industry, automotive industry, manufacturing industry, and military. Regionally, the market is classified into North America, Latin America, Western Europe, Eastern Europe, East Asia, South Asia, and the Middle East and Africa (MEA).

Bio-Hybrid Materials to Lead the Material Type Segment with 58% Market Share

The bio-hybrid segment is expected to lead, accounting for approximately 58% of the global market share in 2025.
  • This dominance is being driven by increasing environmental awareness, stricter regulations on biocompatibility and bio-safe materials in medical and pharmaceutical applications.
  • Bio-hybrid micro robots are being engineered using living cells and soft materials, allowing them to function effectively within human biological systems.

Micro Robots Market Analysis By Material Type

Pharmaceutical Industry to Lead the End User Segment with 33% Market Share

The pharmaceutical industry is projected to grow this segment, capturing approximately 33% of the global market share by 2025, driven by growing demand for precision drug delivery and minimally invasive treatment solutions.
  • Micro robots are being utilized for targeted delivery of medications directly to diseased cells or tissues.
  • High precision and minimal side effects are being achieved through controlled navigation inside the human body.
  • Applications in chronic disease management, cancer therapy, and neurological treatment are expanding rapidly.
  • Pharmaceutical R&D pipelines are being enhanced through the incorporation of drug testing and micromanipulation.

Micro Robots Market Analysis By End User

Top Micro Robots Market Dynamics

The global microrobots market is being driven by advancements in nanotechnology and artificial intelligence, as well as the rising demand for precision healthcare and industrial automation. However, it is also being challenged by high production costs, strict regulatory frameworks, and ethical concerns surrounding the autonomous deployment of robots.

Recent Trends in the Micro Robots Market

  • Advanced AI and machine learning algorithms are being integrated to enhance autonomous decision-making.
  • Swarm robotics concepts are being applied for coordinated multi-robot operations in surveillance and logistics.
  • Bio-hybrid robots are being developed using living cells for improved adaptability in medical applications.

Challenges in the Micro Robots Market

  • High production and R&D costs are being faced due to the complexity of miniaturized components.
  • Regulatory approvals for medical and defense applications are being delayed by stringent safety standards.
  • Integration with legacy industrial systems is being hindered by compatibility and scalability issues.

Analyzing Top Countries Manufacturing, Distributing, and Supplying the Micro Robots

Country Wise Analysis Of Micro Robots Market Cagr 2025 To 2035

USA Micro Robots Market Analysis

The USA micro robots market is projected to grow at a CAGR of 10.2% from 2025 to 2035, making it the fastest-growing market globally. Strong investments by the Department of Defense and National Science Foundation, coupled with rising healthcare automation and semiconductor innovations, are expected to accelerate adoption across multiple sectors, including defense, healthcare, and precision manufacturing.

  • Advanced micro-robots are being deployed in robotic-assisted surgeries and diagnostics.
  • Defense applications are being supported through funding from DARPA and other agencies.
  • AI-powered micro bot swarms are being developed for surveillance and exploration.
  • Leading players like iRobot and SRI International are expanding research investments.

Micro Robots Market Analysis in the UK

The UK micro robots market is forecasted to expand at a CAGR of 9.5% between 2025 and 2035. Growth is being supported by government initiatives that promote medical robotics, defense innovation, and smart factory automation, along with a rising demand for micro-scale solutions in hazardous and nuclear environments.

  • The NHS is adopting micro-robots in oncology and elderly care procedures.
  • Industrial automation is being enhanced with micro bots in aerospace and automotive.
  • Micro robots are being used for nuclear decommissioning and safety inspections.
  • Government-backed AI and robotics programs are receiving public-private funding.

Germany Micro Robots Market Analysis

Germany’s micro robots market is estimated to grow at a CAGR of 9.6% during the forecast period, driven by robust industrial automation, automotive innovation, and smart manufacturing frameworks. The country’s leadership in precision engineering is positioning it as a key player in both healthcare and industrial micro robotics.

  • Industry 4.0 standards are accelerating micro-robot integration in factories.
  • Micro bots are being used in endoscopy, drug delivery, and prosthetic enhancements.
  • Automotive OEMs are incorporating micro-robots for precision assembly.
  • German research institutes are advancing nanorobotics and swarm systems.

France Micro Robots Sales Analysis

France’s micro robots market is forecasted to grow at a CAGR of 9.3% from 2025 to 2035, as applications grow across defense, healthcare, and environmental monitoring. The French government’s investments in robotics innovation, sustainability, and AI ethics are fostering a well-regulated, high-growth environment.

  • Defense robotics is being prioritized for surveillance and reconnaissance.
  • Healthcare applications include diagnostics, surgical aids, and lab automation.
  • Funding is being provided through national AI and innovation roadmaps.
  • Energy-efficient micro bots are being developed for ecological studies.

Micro Robots Demand Analysis in Japan

Japan’s micro robots market is expected to expand at a CAGR of 10.1% between 2025 and 2035, supported by a strong foundation in miniaturization, healthcare robotics, and industrial precision systems. Its aging population and high-tech R&D ecosystem are positioning Japan as a global hub for innovation in medical and consumer micro-robots.

  • Nanorobots are being developed for targeted drug delivery and diagnostics.
  • Elderly care robots are being designed for personalized medical assistance.
  • Semiconductor firms are leveraging micro bots in fabrication and testing.
  • Government grants are boosting autonomous robotic systems and AI labs.

Leading Micro Robots Suppliers and Manufacturers

The micro robots market is characterized by a fragmented yet increasingly competitive landscape. While top-tier companies hold significant shares, substantial opportunities remain for niche innovators to carve out specialized roles. Pricing, innovation, and strategic partnerships are being deployed as key strategies, as established players leverage scale and R&D budgets. At the same time, agile firms focus on breakthrough technologies, including AI, bio-hybrids, and swarm systems, to differentiate themselves.

Top companies are competing through various strategies, and firms like ABB and Omron are pursuing pricing advantages in industrial segments. In contrast, innovation is being prioritized by players such as SRI International and Boston Dynamics. Partnerships are being formed to accelerate product development, e.g., ABB partnering with Agilent Technologies for lab automation. Geographic expansion into emerging regions is being supported through targeted alliances and local R&D setups.

Recent Micro Robots Market News

  • In May 2025, a new edge-computing AI framework, NeuroEdge, is being launched by SRI to improve micro-robot operational efficiency.
  • In April 2025, Boston Dynamics, the global leader in mobile robotics, and Hyundai Motor Group (the Group) entered a new chapter together to increase manufacturing capabilities, expand collaboration to produce more robots, and build a vibrant robotics ecosystem in the USA
  • In March 2025, Boston Dynamics expanded its collaboration with NVIDIA, integrating the Jetson Thor/Isaac platforms to elevate AI capabilities in its humanoid and quadruped robots.

Micro Robots Market Report Scope

Report Attributes Details
Market Size (2025) USD 38.3 billion
Projected Market Size (2035) USD 97.4 billion
CAGR (2025 to 2035) 9.8%
Base Year for Estimation 2024
Historical Period 2020 to 2024
Projections Period 2025 to 2035
Report Parameter Revenue in USD billion/Units
By Material Type Bio-Hybrid Micro Robots, and Synthetic Micro Robots
By End Use Pharmaceutical Industry, Healthcare Industry, Automotive Industry, Manufacturing Industry, and Military
Regions Covered North America, Latin America, Europe, East Asia, South Asia & Pacific, Middle East & Africa
Countries Covered United States, Canada, United Kingdom, Germany, France, China, Japan, South Korea, Brazil, Australia
Key Players ABB Ltd., iRobot Corporation, SRI International, Omron Corporation, Boston Dynamics, Microbot Medical, Cyborg Nest, KUKA AG, Seiko Epson Corporation, FANUC Corporation
Additional Attributes Dollar sales by value, market share analysis by region, and country-wise analysis.

Market Segmentation

By Material Type:

In terms of Material type, the industry is divided into Bio-Hybrid, Synthetic

By End User:

In terms of End User, the industry is divided into Pharmaceutical Industry, Healthcare Industry, Automotive Industry, Manufacturing Industry, Military

By Region:

The report covers key regions, including North America, Latin America, Western Europe, Eastern Europe, East Asia, South Asia, and the Middle East and Africa (MEA).

Table of Content

  1. Executive Summary
    • Global Market Outlook
    • Demand-side Trends
    • Supply-side Trends
    • Technology Roadmap Analysis
    • Analysis and Recommendations
  2. Market Overview
    • Market Coverage / Taxonomy
    • Market Definition / Scope / Limitations
  3. Market Background
    • Market Dynamics
      • Drivers
      • Restraints
      • Opportunity
      • Trends
    • Scenario Forecast
      • Demand in Optimistic Scenario
      • Demand in Likely Scenario
      • Demand in Conservative Scenario
    • Opportunity Map Analysis
    • Product Life Cycle Analysis
    • Supply Chain Analysis
      • Supply Side Participants and their Roles
        • Producers
        • Mid-Level Participants (Traders/ Agents/ Brokers)
        • Wholesalers and Distributors
      • Value Added and Value Created at Node in the Supply Chain
      • List of Raw Material Suppliers
      • List of Existing and Potential Buyer’s
    • Investment Feasibility Matrix
    • Value Chain Analysis
      • Profit Margin Analysis
      • Wholesalers and Distributors
      • Retailers
    • PESTLE and Porter’s Analysis
    • Regulatory Landscape
      • By Key Regions
      • By Key Countries
    • Regional Parent Market Outlook
    • Production and Consumption Statistics
    • Import and Export Statistics
  4. Global Market Analysis 2020 to 2024 and Forecast, 2025 to 2035
    • Historical Market Size Value (USD Billion) & Volume (Units) Analysis, 2020 to 2024
    • Current and Future Market Size Value (USD Billion) & Volume (Units) Projections, 2025 to 2035
      • Y-o-Y Growth Trend Analysis
      • Absolute $ Opportunity Analysis
  5. Global Market Pricing Analysis 2020 to 2024 and Forecast 2025 to 2035
  6. Global Market Analysis 2020 to 2024 and Forecast 2025 to 2035, By Material Type
    • Introduction / Key Findings
    • Historical Market Size Value (USD Billion) & Volume (Units) Analysis By Material Type, 2020 to 2024
    • Current and Future Market Size Value (USD Billion) & Volume (Units) Analysis and Forecast By Material Type, 2025 to 2035
      • Bio-Hybrid
      • Synthetic
    • Y-o-Y Growth Trend Analysis By Material Type, 2020 to 2024
    • Absolute $ Opportunity Analysis By Material Type, 2025 to 2035
  7. Global Market Analysis 2020 to 2024 and Forecast 2025 to 2035, By End Use
    • Introduction / Key Findings
    • Historical Market Size Value (USD Billion) & Volume (Units) Analysis By End Use, 2020 to 2024
    • Current and Future Market Size Value (USD Billion) & Volume (Units) Analysis and Forecast By End Use, 2025 to 2035
      • Pharmaceutical Industry
      • Healthcare Industry
      • Automotive Industry
      • Manufacturing Industry
      • Military
    • Y-o-Y Growth Trend Analysis By End Use, 2020 to 2024
    • Absolute $ Opportunity Analysis By End Use, 2025 to 2035
  8. Global Market Analysis 2020 to 2024 and Forecast 2025 to 2035, By Region
    • Introduction
    • Historical Market Size Value (USD Billion) & Volume (Units) Analysis By Region, 2020 to 2024
    • Current Market Size Value (USD Billion) & Volume (Units) Analysis and Forecast By Region, 2025 to 2035
      • North America
      • Latin America
      • Western Europe
      • Eastern Europe
      • East Asia
      • South Asia & Pacific
      • Middle East and Africa
    • Market Attractiveness Analysis By Region
  9. North America Market Analysis 2020 to 2024 and Forecast 2025 to 2035, By Country
    • Historical Market Size Value (USD Billion) & Volume (Units) Trend Analysis By Market Taxonomy, 2020 to 2024
    • Market Size Value (USD Billion) & Volume (Units) Forecast By Market Taxonomy, 2025 to 2035
      • By Country
        • USA
        • Canada
        • Mexico
      • By Material Type
      • By End Use
    • Market Attractiveness Analysis
      • By Country
      • By Material Type
      • By End Use
    • Key Takeaways
  10. Latin America Market Analysis 2020 to 2024 and Forecast 2025 to 2035, By Country
    • Historical Market Size Value (USD Billion) & Volume (Units) Trend Analysis By Market Taxonomy, 2020 to 2024
    • Market Size Value (USD Billion) & Volume (Units) Forecast By Market Taxonomy, 2025 to 2035
      • By Country
        • Brazil
        • Argentina
        • Rest of LATAM
      • By Material Type
      • By End Use
    • Market Attractiveness Analysis
      • By Country
      • By Material Type
      • By End Use
    • Key Takeaways
  11. Western Europe Market Analysis 2020 to 2024 and Forecast 2025 to 2035, By Country
    • Historical Market Size Value (USD Billion) & Volume (Units) Trend Analysis By Market Taxonomy, 2020 to 2024
    • Market Size Value (USD Billion) & Volume (Units) Forecast By Market Taxonomy, 2025 to 2035
      • By Country
        • Germany
        • Italy
        • France
        • UK
        • Spain
        • BENELUX
        • Nordic
        • Rest of W.Europe
      • By Material Type
      • By End Use
    • Market Attractiveness Analysis
      • By Country
      • By Material Type
      • By End Use
    • Key Takeaways
  12. Eastern Europe Market Analysis 2020 to 2024 and Forecast 2025 to 2035, By Country
    • Historical Market Size Value (USD Billion) & Volume (Units) Trend Analysis By Market Taxonomy, 2020 to 2024
    • Market Size Value (USD Billion) & Volume (Units) Forecast By Market Taxonomy, 2025 to 2035
      • By Country
        • Russia
        • Hungary
        • Poland
        • Balkan & Baltics
        • Rest of E. Europe
      • By Material Type
      • By End Use
    • Market Attractiveness Analysis
      • By Country
      • By Material Type
      • By End Use
    • Key Takeaways
  13. East Asia Market Analysis 2020 to 2024 and Forecast 2025 to 2035, By Country
    • Historical Market Size Value (USD Billion) & Volume (Units) Trend Analysis By Market Taxonomy, 2020 to 2024
    • Market Size Value (USD Billion) & Volume (Units) Forecast By Market Taxonomy, 2025 to 2035
      • By Country
        • China
        • Japan
        • South Korea
      • By Material Type
      • By End Use
    • Market Attractiveness Analysis
      • By Country
      • By Material Type
      • By End Use
    • Key Takeaways
  14. South Asia & Pacific Market Analysis 2020 to 2024 and Forecast 2025 to 2035, By Country
    • Historical Market Size Value (USD Billion) & Volume (Units) Trend Analysis By Market Taxonomy, 2020 to 2024
    • Market Size Value (USD Billion) & Volume (Units) Forecast By Market Taxonomy, 2025 to 2035
      • By Country
        • India
        • Australia & New Zealand
        • ASEAN
        • Rest of SAP
      • By Material Type
      • By End Use
    • Market Attractiveness Analysis
      • By Country
      • By Material Type
      • By End Use
    • Key Takeaways
  15. Middle East and Africa Market Analysis 2020 to 2024 and Forecast 2025 to 2035, By Country
    • Historical Market Size Value (USD Billion) & Volume (Units) Trend Analysis By Market Taxonomy, 2020 to 2024
    • Market Size Value (USD Billion) & Volume (Units) Forecast By Market Taxonomy, 2025 to 2035
      • By Country
        • GCC Countries
        • Northern Africa
        • South Africa
        • Turkiye
        • Rest of MEA
      • By Material Type
      • By End Use
    • Market Attractiveness Analysis
      • By Country
      • By Material Type
      • By End Use
    • Key Takeaways
  16. Key Countries Market Analysis
    • USA
      • Pricing Analysis
      • Market Share Analysis, 2024
        • By Material Type
        • By End Use
    • Canada
      • Pricing Analysis
      • Market Share Analysis, 2024
        • By Material Type
        • By End Use
    • Brazil
      • Pricing Analysis
      • Market Share Analysis, 2024
        • By Material Type
        • By End Use
    • Mexico
      • Pricing Analysis
      • Market Share Analysis, 2024
        • By Material Type
        • By End Use
    • Argentina
      • Pricing Analysis
      • Market Share Analysis, 2024
        • By Material Type
        • By End Use
  17. Market Structure Analysis
    • Competition Dashboard
    • Competition Benchmarking
    • Market Share Analysis of Top Players
      • By Regional
      • By Material Type
      • By End Use
  18. Competition Analysis
    • Competition Deep Dive
      • ABB Ltd.
        • Overview
        • Product Portfolio
        • Profitability by Market Segments (Product/Age /Sales Channel/Region)
        • Sales Footprint
        • Strategy Overview
          • Marketing Strategy
          • Product Strategy
          • Channel Strategy
      • iRobot Corporation
        • Overview
        • Product Portfolio
        • Profitability by Market Segments (Product/Age /Sales Channel/Region)
        • Sales Footprint
        • Strategy Overview
          • Marketing Strategy
          • Product Strategy
          • Channel Strategy
      • SRI International
        • Overview
        • Product Portfolio
        • Profitability by Market Segments (Product/Age /Sales Channel/Region)
        • Sales Footprint
        • Strategy Overview
          • Marketing Strategy
          • Product Strategy
          • Channel Strategy
      • Omron Corporation
        • Overview
        • Product Portfolio
        • Profitability by Market Segments (Product/Age /Sales Channel/Region)
        • Sales Footprint
        • Strategy Overview
          • Marketing Strategy
          • Product Strategy
          • Channel Strategy
      • Boston Dynamics
        • Overview
        • Product Portfolio
        • Profitability by Market Segments (Product/Age /Sales Channel/Region)
        • Sales Footprint
        • Strategy Overview
          • Marketing Strategy
          • Product Strategy
          • Channel Strategy
      • Microbot Medical
        • Overview
        • Product Portfolio
        • Profitability by Market Segments (Product/Age /Sales Channel/Region)
        • Sales Footprint
        • Strategy Overview
          • Marketing Strategy
          • Product Strategy
          • Channel Strategy
      • Cyborg Nest
        • Overview
        • Product Portfolio
        • Profitability by Market Segments (Product/Age /Sales Channel/Region)
        • Sales Footprint
        • Strategy Overview
          • Marketing Strategy
          • Product Strategy
          • Channel Strategy
      • KUKA AG
        • Overview
        • Product Portfolio
        • Profitability by Market Segments (Product/Age /Sales Channel/Region)
        • Sales Footprint
        • Strategy Overview
          • Marketing Strategy
          • Product Strategy
          • Channel Strategy
      • Seiko Epson Corporation
        • Overview
        • Product Portfolio
        • Profitability by Market Segments (Product/Age /Sales Channel/Region)
        • Sales Footprint
        • Strategy Overview
          • Marketing Strategy
          • Product Strategy
          • Channel Strategy
      • FANUC Corporation
        • Overview
        • Product Portfolio
        • Profitability by Market Segments (Product/Age /Sales Channel/Region)
        • Sales Footprint
        • Strategy Overview
          • Marketing Strategy
          • Product Strategy
          • Channel Strategy
  19. Assumptions & Acronyms Used
  20. Research Methodology

List of Tables

  • Table 1: Global Market Value (USD Billion) Forecast by Region, 2020 to 2035
  • Table 2: Global Market Volume (Units) Forecast by Region, 2020 to 2035
  • Table 3: Global Market Value (USD Billion) Forecast by Material Type, 2020 to 2035
  • Table 4: Global Market Volume (Units) Forecast by Material Type, 2020 to 2035
  • Table 5: Global Market Value (USD Billion) Forecast by End Use, 2020 to 2035
  • Table 6: Global Market Volume (Units) Forecast by End Use, 2020 to 2035
  • Table 7: North America Market Value (USD Billion) Forecast by Country, 2020 to 2035
  • Table 8: North America Market Volume (Units) Forecast by Country, 2020 to 2035
  • Table 9: North America Market Value (USD Billion) Forecast by Material Type, 2020 to 2035
  • Table 10: North America Market Volume (Units) Forecast by Material Type, 2020 to 2035
  • Table 11: North America Market Value (USD Billion) Forecast by End Use, 2020 to 2035
  • Table 12: North America Market Volume (Units) Forecast by End Use, 2020 to 2035
  • Table 13: Latin America Market Value (USD Billion) Forecast by Country, 2020 to 2035
  • Table 14: Latin America Market Volume (Units) Forecast by Country, 2020 to 2035
  • Table 15: Latin America Market Value (USD Billion) Forecast by Material Type, 2020 to 2035
  • Table 16: Latin America Market Volume (Units) Forecast by Material Type, 2020 to 2035
  • Table 17: Latin America Market Value (USD Billion) Forecast by End Use, 2020 to 2035
  • Table 18: Latin America Market Volume (Units) Forecast by End Use, 2020 to 2035
  • Table 19: Western Europe Market Value (USD Billion) Forecast by Country, 2020 to 2035
  • Table 20: Western Europe Market Volume (Units) Forecast by Country, 2020 to 2035
  • Table 21: Western Europe Market Value (USD Billion) Forecast by Material Type, 2020 to 2035
  • Table 22: Western Europe Market Volume (Units) Forecast by Material Type, 2020 to 2035
  • Table 23: Western Europe Market Value (USD Billion) Forecast by End Use, 2020 to 2035
  • Table 24: Western Europe Market Volume (Units) Forecast by End Use, 2020 to 2035
  • Table 25: Eastern Europe Market Value (USD Billion) Forecast by Country, 2020 to 2035
  • Table 26: Eastern Europe Market Volume (Units) Forecast by Country, 2020 to 2035
  • Table 27: Eastern Europe Market Value (USD Billion) Forecast by Material Type, 2020 to 2035
  • Table 28: Eastern Europe Market Volume (Units) Forecast by Material Type, 2020 to 2035
  • Table 29: Eastern Europe Market Value (USD Billion) Forecast by End Use, 2020 to 2035
  • Table 30: Eastern Europe Market Volume (Units) Forecast by End Use, 2020 to 2035
  • Table 31: East Asia Market Value (USD Billion) Forecast by Country, 2020 to 2035
  • Table 32: East Asia Market Volume (Units) Forecast by Country, 2020 to 2035
  • Table 33: East Asia Market Value (USD Billion) Forecast by Material Type, 2020 to 2035
  • Table 34: East Asia Market Volume (Units) Forecast by Material Type, 2020 to 2035
  • Table 35: East Asia Market Value (USD Billion) Forecast by End Use, 2020 to 2035
  • Table 36: East Asia Market Volume (Units) Forecast by End Use, 2020 to 2035
  • Table 37: South Asia & Pacific Market Value (USD Billion) Forecast by Country, 2020 to 2035
  • Table 38: South Asia & Pacific Market Volume (Units) Forecast by Country, 2020 to 2035
  • Table 39: South Asia & Pacific Market Value (USD Billion) Forecast by Material Type, 2020 to 2035
  • Table 40: South Asia & Pacific Market Volume (Units) Forecast by Material Type, 2020 to 2035
  • Table 41: South Asia & Pacific Market Value (USD Billion) Forecast by End Use, 2020 to 2035
  • Table 42: South Asia & Pacific Market Volume (Units) Forecast by End Use, 2020 to 2035
  • Table 43: Middle East and Africa Market Value (USD Billion) Forecast by Country, 2020 to 2035
  • Table 44: Middle East and Africa Market Volume (Units) Forecast by Country, 2020 to 2035
  • Table 45: Middle East and Africa Market Value (USD Billion) Forecast by Material Type, 2020 to 2035
  • Table 46: Middle East and Africa Market Volume (Units) Forecast by Material Type, 2020 to 2035
  • Table 47: Middle East and Africa Market Value (USD Billion) Forecast by End Use, 2020 to 2035
  • Table 48: Middle East and Africa Market Volume (Units) Forecast by End Use, 2020 to 2035

List of Figures

  • Figure 1: Global Market Volume (Units) Forecast 2020 to 2035
  • Figure 2: Global Market Pricing Analysis
  • Figure 3: Global Market Value (USD Billion) Forecast 2020 to 2035
  • Figure 4: Global Market Value Share and BPS Analysis by Material Type, 2025 and 2035
  • Figure 5: Global Market Y-o-Y Growth Comparison by Material Type, 2025 to 2035
  • Figure 6: Global Market Attractiveness Analysis by Material Type
  • Figure 7: Global Market Value Share and BPS Analysis by End Use, 2025 and 2035
  • Figure 8: Global Market Y-o-Y Growth Comparison by End Use, 2025 to 2035
  • Figure 9: Global Market Attractiveness Analysis by End Use
  • Figure 10: Global Market Value (USD Billion) Share and BPS Analysis by Region, 2025 and 2035
  • Figure 11: Global Market Y-o-Y Growth Comparison by Region, 2025 to 2035
  • Figure 12: Global Market Attractiveness Analysis by Region
  • Figure 13: North America Market Incremental $ Opportunity, 2025 to 2035
  • Figure 14: Latin America Market Incremental $ Opportunity, 2025 to 2035
  • Figure 15: Western Europe Market Incremental $ Opportunity, 2025 to 2035
  • Figure 16: Eastern Europe Market Incremental $ Opportunity, 2025 to 2035
  • Figure 17: East Asia Market Incremental $ Opportunity, 2025 to 2035
  • Figure 18: South Asia & Pacific Market Incremental $ Opportunity, 2025 to 2035
  • Figure 19: Middle East and Africa Market Incremental $ Opportunity, 2025 to 2035
  • Figure 20: North America Market Value Share and BPS Analysis by Country, 2025 and 2035
  • Figure 21: North America Market Value Share and BPS Analysis by Material Type, 2025 and 2035
  • Figure 22: North America Market Y-o-Y Growth Comparison by Material Type, 2025 to 2035
  • Figure 23: North America Market Attractiveness Analysis by Material Type
  • Figure 24: North America Market Value Share and BPS Analysis by End Use, 2025 and 2035
  • Figure 25: North America Market Y-o-Y Growth Comparison by End Use, 2025 to 2035
  • Figure 26: North America Market Attractiveness Analysis by End Use
  • Figure 27: Latin America Market Value Share and BPS Analysis by Country, 2025 and 2035
  • Figure 28: Latin America Market Value Share and BPS Analysis by Material Type, 2025 and 2035
  • Figure 29: Latin America Market Y-o-Y Growth Comparison by Material Type, 2025 to 2035
  • Figure 30: Latin America Market Attractiveness Analysis by Material Type
  • Figure 31: Latin America Market Value Share and BPS Analysis by End Use, 2025 and 2035
  • Figure 32: Latin America Market Y-o-Y Growth Comparison by End Use, 2025 to 2035
  • Figure 33: Latin America Market Attractiveness Analysis by End Use
  • Figure 34: Western Europe Market Value Share and BPS Analysis by Country, 2025 and 2035
  • Figure 35: Western Europe Market Value Share and BPS Analysis by Material Type, 2025 and 2035
  • Figure 36: Western Europe Market Y-o-Y Growth Comparison by Material Type, 2025 to 2035
  • Figure 37: Western Europe Market Attractiveness Analysis by Material Type
  • Figure 38: Western Europe Market Value Share and BPS Analysis by End Use, 2025 and 2035
  • Figure 39: Western Europe Market Y-o-Y Growth Comparison by End Use, 2025 to 2035
  • Figure 40: Western Europe Market Attractiveness Analysis by End Use
  • Figure 41: Eastern Europe Market Value Share and BPS Analysis by Country, 2025 and 2035
  • Figure 42: Eastern Europe Market Value Share and BPS Analysis by Material Type, 2025 and 2035
  • Figure 43: Eastern Europe Market Y-o-Y Growth Comparison by Material Type, 2025 to 2035
  • Figure 44: Eastern Europe Market Attractiveness Analysis by Material Type
  • Figure 45: Eastern Europe Market Value Share and BPS Analysis by End Use, 2025 and 2035
  • Figure 46: Eastern Europe Market Y-o-Y Growth Comparison by End Use, 2025 to 2035
  • Figure 47: Eastern Europe Market Attractiveness Analysis by End Use
  • Figure 48: East Asia Market Value Share and BPS Analysis by Country, 2025 and 2035
  • Figure 49: East Asia Market Value Share and BPS Analysis by Material Type, 2025 and 2035
  • Figure 50: East Asia Market Y-o-Y Growth Comparison by Material Type, 2025 to 2035
  • Figure 51: East Asia Market Attractiveness Analysis by Material Type
  • Figure 52: East Asia Market Value Share and BPS Analysis by End Use, 2025 and 2035
  • Figure 53: East Asia Market Y-o-Y Growth Comparison by End Use, 2025 to 2035
  • Figure 54: East Asia Market Attractiveness Analysis by End Use
  • Figure 55: South Asia & Pacific Market Value Share and BPS Analysis by Country, 2025 and 2035
  • Figure 56: South Asia & Pacific Market Value Share and BPS Analysis by Material Type, 2025 and 2035
  • Figure 57: South Asia & Pacific Market Y-o-Y Growth Comparison by Material Type, 2025 to 2035
  • Figure 58: South Asia & Pacific Market Attractiveness Analysis by Material Type
  • Figure 59: South Asia & Pacific Market Value Share and BPS Analysis by End Use, 2025 and 2035
  • Figure 60: South Asia & Pacific Market Y-o-Y Growth Comparison by End Use, 2025 to 2035
  • Figure 61: South Asia & Pacific Market Attractiveness Analysis by End Use
  • Figure 62: Middle East and Africa Market Value Share and BPS Analysis by Country, 2025 and 2035
  • Figure 63: Middle East and Africa Market Value Share and BPS Analysis by Material Type, 2025 and 2035
  • Figure 64: Middle East and Africa Market Y-o-Y Growth Comparison by Material Type, 2025 to 2035
  • Figure 65: Middle East and Africa Market Attractiveness Analysis by Material Type
  • Figure 66: Middle East and Africa Market Value Share and BPS Analysis by End Use, 2025 and 2035
  • Figure 67: Middle East and Africa Market Y-o-Y Growth Comparison by End Use, 2025 to 2035
  • Figure 68: Middle East and Africa Market Attractiveness Analysis by End Use
  • Figure 69: Global Market - Tier Structure Analysis
  • Figure 70: Global Market - Company Share Analysis

Frequently Asked Questions

What is the projected size of the micro robots market by 2035?

The market is expected to reach USD 97.4 billion by 2035.

What is the CAGR of the micro robots market from 2025 to 2035?

The market is forecasted to grow at a CAGR of 9.8% during the period.

Which segment holds the largest share in the micro robots market?

The bio-hybrid segment leads with a 58% share due to its biocompatibility.

Which region is the fastest-growing in the micro robots market?

The USA is the fastest-growing region, with a 10.2% CAGR.

Which are the key players in the micro robots industry?

Key players include ABB Ltd., iRobot Corporation, SRI International, and Boston Dynamics.

Explore Similar Insights

Future Market Insights

Micro Robots Market