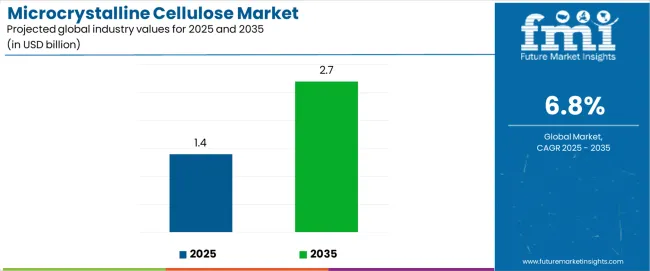
The global microcrystalline cellulose market is valued at USD 1.4 billion in 2025. It is slated to reach USD 2.7 billion by 2035, recording an absolute increase of USD 1.3 billion over the forecast period. This translates into a total growth of 92.9%, with the market forecast to expand at a compound annual growth rate (CAGR) of 6.8% between 2025 and 2035. According to validated data from FMI’s Chemical Industry Analytics, tracking raw material price and sustainability drivers, the overall market size is expected to grow by nearly 1.93X during the same period, supported by increasing demand for pharmaceutical excipients in solid-dose formulations, growing adoption of clean-label food ingredients across processed food categories, and rising emphasis on natural functional additives across diverse pharmaceutical, nutraceutical, food, and personal care applications.
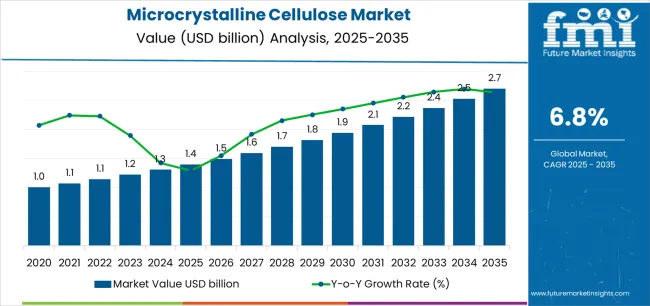
Between 2025 and 2030, the microcrystalline cellulose market is projected to expand from USD 1.4 billion to USD 1.9 billion, resulting in a value increase of USD 0.5 billion, which represents 38.5% of the total forecast growth for the decade. This phase of development will be shaped by increasing generic pharmaceutical production and solid-dose manufacturing capacity expansion, rising adoption of clean-label food ingredients and natural texture modifiers, and growing demand for nitrosamine-risk-mitigating excipients that ensure pharmaceutical quality and regulatory compliance. Pharmaceutical manufacturers and food processors are expanding their microcrystalline cellulose capabilities to address the growing demand for high-purity excipients and functional ingredients supporting tablet production, capsule filling, and food texture optimization.
| Metric | Value |
|---|---|
| Estimated Value in (2025E) | USD 1.4 billion |
| Forecast Value in (2035F) | USD 2.7 billion |
| Forecast CAGR (2025 to 2035) | 6.8% |
From 2030 to 2035, the market is forecast to grow from USD 1.9 billion to USD 2.7 billion, adding another USD 0.8 billion, which constitutes 61.5% of the overall ten-year expansion. This period is expected to be characterized by the expansion of sustainable and non-wood cellulose sources including agricultural residues and bamboo, the development of advanced particle engineering technologies enabling optimized flow properties and dissolution profiles, and the growth of specialized applications for orally disintegrating tablets, functional beverages, and sustainable packaging materials. The growing adoption of pharmaceutical quality-by-design principles and clean-label food formulation strategies will drive demand for microcrystalline cellulose with enhanced functional properties, comprehensive analytical documentation, and verified sustainability credentials.
Between 2020 and 2025, the microcrystalline cellulose market experienced steady growth, driven by increasing pharmaceutical manufacturing capacity in emerging markets and growing consumer preference for natural food ingredients over synthetic alternatives in processed foods and functional beverages. The market developed as pharmaceutical formulators and food technologists recognized the potential for microcrystalline cellulose to deliver superior binding, disintegration, and texture modification properties while maintaining excellent safety profiles and regulatory acceptance globally. Technological advancement in particle size engineering and surface modification began emphasizing the critical importance of maintaining consistent functional performance and meeting stringent purity specifications in pharmaceutical and food applications.
Market expansion is being supported by the increasing global demand for pharmaceutical excipients in solid-dose formulations and the corresponding need for multifunctional binders, disintegrants, and diluents that can support direct compression tableting, enhance drug bioavailability, and ensure robust manufacturing processes across various generic pharmaceuticals, branded drugs, and nutraceutical products. Modern pharmaceutical manufacturers and contract development organizations are increasingly focused on implementing excipient solutions that can simplify formulation development, reduce processing costs, and provide consistent quality across batch production while meeting stringent regulatory requirements. Microcrystalline cellulose's proven ability to deliver excellent compressibility, support rapid disintegration, and maintain chemical inertness makes it an essential excipient for contemporary solid-dose pharmaceutical manufacturing.
The growing emphasis on clean-label food formulations and natural ingredient preferences is driving demand for microcrystalline cellulose as a versatile texture modifier, fat replacer, and stabilizer that can support reduced-calorie products, improve mouthfeel in low-fat formulations, and provide natural origin claims appealing to health-conscious consumers. Food manufacturers' preference for multifunctional ingredients that combine technical performance with consumer-friendly labeling is creating opportunities for innovative microcrystalline cellulose applications across dairy alternatives, baked goods, and functional beverages. The rising influence of pharmaceutical quality improvements and nitrosamine risk mitigation initiatives is also contributing to increased adoption of low-nitrite microcrystalline cellulose grades that can minimize impurity-related risks while supporting comprehensive pharmaceutical quality assurance programs.
The market is segmented by material, product grade, end use, and region. By material, the market is divided into wood-based MCC and non-wood-based MCC (including cotton linters, bamboo, and agricultural residues). Based on product grade, the market is categorized into pharmaceutical grade, food grade, and industrial/technical grade. By end use, the market covers pharmaceuticals & nutraceuticals, food & beverages, personal care & cosmetics, and other industrial applications (including chemicals, electronics, and animal nutrition). Regionally, the market is divided into Asia Pacific, North America, Europe, Latin America, and the Middle East & Africa.
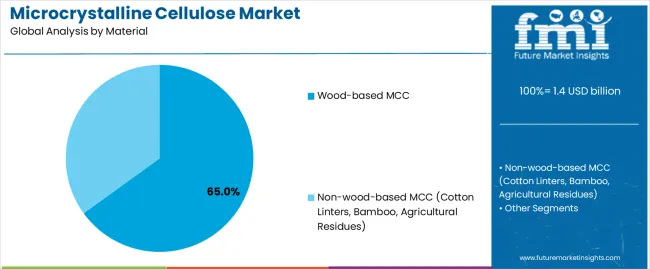
The wood-based MCC segment is projected to maintain its leading position in the microcrystalline cellulose market in 2025 with a commanding 65% market share, reaffirming its role as the preferred raw material source for commercial microcrystalline cellulose production due to established supply chains, consistent quality characteristics, and cost-competitive manufacturing economics. Pharmaceutical and food manufacturers increasingly utilize wood-based microcrystalline cellulose for its reliable functional properties, comprehensive regulatory acceptance across global markets, and well-documented safety profiles supported by decades of commercial use and extensive toxicological evaluation. Wood-based cellulose's proven effectiveness in delivering consistent particle morphology and predictable performance directly addresses industry requirements for reproducible excipient quality and manufacturing reliability in regulated applications.
This material segment forms the foundation of commercial microcrystalline cellulose production, as it represents the feedstock with the greatest supply availability and established processing infrastructure across major producing regions in North America, Europe, and Asia. Pharmaceutical investments in wood-based excipients continue to strengthen adoption among formulators and quality assurance professionals. With manufacturing processes requiring consistent raw material properties and predictable processing behavior, wood-based microcrystalline cellulose aligns with both quality objectives and supply security requirements, making it the central component of comprehensive excipient sourcing strategies supporting global pharmaceutical and food manufacturing operations.
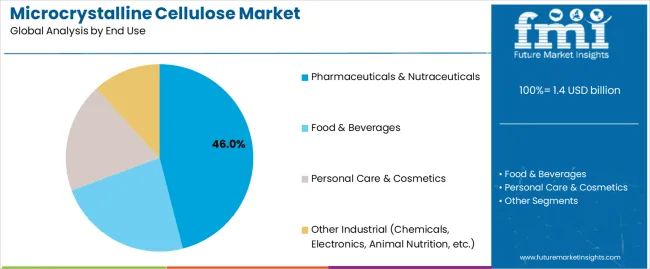
The pharmaceuticals & nutraceuticals end-use segment commands the largest market share at 46% in 2025, reflecting its established position as the most demanding and value-creating application category requiring stringent quality specifications, comprehensive analytical documentation, and consistent functional performance across direct compression tableting, wet granulation, capsule filling, and specialized delivery systems. This segment benefits from microcrystalline cellulose's unique combination of properties including excellent binding capacity, controlled disintegration behavior, chemical inertness with active pharmaceutical ingredients, and global regulatory acceptance enabling worldwide product distribution. The extensive use of microcrystalline cellulose as a primary excipient in immediate-release tablets, orally disintegrating formulations, and dietary supplements supports segment dominance.
Food & beverages follow with 33% share, utilizing microcrystalline cellulose for texture modification, fat replacement, stabilization, and clean-label ingredient positioning across processed foods, dairy alternatives, and functional beverages. Personal care & cosmetics account for 12%, leveraging microcrystalline cellulose for texture enhancement, suspension stabilization, and natural ingredient claims in skincare, color cosmetics, and oral care products. Other industrial applications hold 9% share, encompassing chemical processing aids, electronics applications, animal nutrition, and emerging uses in sustainable materials. The pharmaceuticals & nutraceuticals segment's leadership is reinforced by continuous growth in generic drug manufacturing, expanding nutraceutical markets globally, and increasing quality requirements driving adoption of premium excipient grades with superior purity and functionality supporting robust pharmaceutical manufacturing processes.
The microcrystalline cellulose market is advancing steadily due to increasing pharmaceutical manufacturing capacity expansion in emerging markets and growing adoption of clean-label food ingredients that provide natural functionality and consumer-friendly labeling across diverse pharmaceutical, nutraceutical, food, and personal care applications. However, the market faces challenges, including competition from alternative excipients and texture modifiers offering specialized functionality, price pressures from commodity ingredient markets affecting food-grade applications, and sustainability concerns regarding wood-sourcing practices driving demand for non-wood alternatives including agricultural residue-based cellulose. Innovation in low-nitrite grades and sustainable sourcing continues to influence product development and market expansion patterns.
The growing focus on nitrosamine impurity control in pharmaceutical products is enabling microcrystalline cellulose manufacturers to develop and commercialize ultra-low-nitrite grades that minimize nitrosamine formation risk in drug products containing secondary or tertiary amine functional groups, supporting pharmaceutical quality assurance and regulatory compliance with evolving ICH M7 guidelines. Advanced purification technologies and specialized manufacturing controls provide nitrite content below 0.1 ppm while maintaining functional properties required for tableting and capsule applications. Pharmaceutical manufacturers are increasingly recognizing the risk mitigation advantages of low-nitrite excipients for formulation safety, regulatory risk management, and proactive quality excellence across development and commercial manufacturing operations.
Modern microcrystalline cellulose producers are incorporating non-wood cellulose sources including cotton linters, bamboo fiber, and agricultural residues to enhance environmental sustainability credentials, reduce dependency on forest resources, and support circular economy principles through valorization of agricultural byproducts and textile industry waste streams. These alternative feedstocks improve environmental performance metrics while enabling differentiated product positioning addressing sustainability-focused customers and supporting corporate environmental responsibility objectives. Advanced processing technologies also allow manufacturers to achieve pharmaceutical and food-grade quality specifications from non-wood sources, creating competitive advantages in sustainability-conscious procurement decisions and supporting long-term feedstock diversification strategies mitigating supply chain concentration risks.
The emergence of advanced particle engineering techniques including spray drying, agglomeration, and surface modification is creating specialized microcrystalline cellulose grades with optimized flow properties for high-speed tableting, enhanced compressibility enabling reduced excipient loading, improved moisture management supporting stability in humid environments, and tailored dissolution profiles addressing bioavailability optimization requirements. Leading excipient suppliers are investing in proprietary manufacturing processes that create differentiated product portfolios addressing specific formulation challenges, supporting premium pricing realization, and strengthening technical partnerships with innovative pharmaceutical companies developing next-generation solid-dose products across therapeutic categories and patient populations.
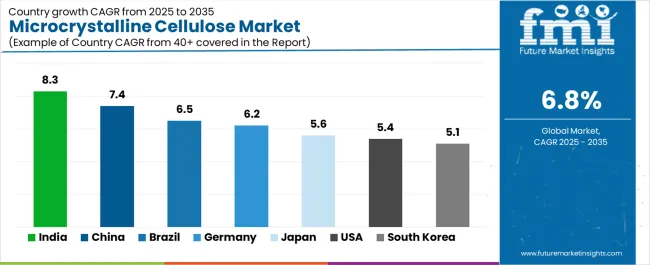
| Country | CAGR (2025-2035) |
|---|---|
| India | 8.3% |
| China | 7.4% |
| Brazil | 6.5% |
| Germany | 6.2% |
| Japan | 5.6% |
| USA | 5.4% |
| South Korea | 5.1% |
The microcrystalline cellulose market is experiencing robust growth globally, with India leading at an 8.3% CAGR through 2035, driven by expansion in generic pharmaceutical manufacturing and nutraceutical production, rising domestic excipient manufacturing capacity reducing import dependency, and fast growth in clean-label food categories addressing health-conscious consumer preferences. China follows at 7.4%, supported by large-scale pharmaceutical tableting operations serving domestic and export markets, processed foods growth driven by urbanization and convenience trends, and investments in bio-based cellulose production supporting domestic supply chain development. Brazil shows growth at 6.5%, emphasizing local pharmaceutical and nutraceutical capacity ramp-up, convenience foods penetration across expanding middle-class consumers, and import substitution strategies in pharmaceutical excipients. Germany records 6.2%, focusing on high-specification pharmaceutical demand and strong personal care formulation expertise with shift to certified low-nitrite microcrystalline cellulose grades. Japan demonstrates 5.6% growth, supported by aging-care formulations including orally disintegrating tablets, functional foods focus addressing health maintenance, and premium quality standards throughout pharmaceutical and food supply chains. The United States exhibits 5.4% growth, emphasizing strict FDA excipient control and protein/meal-replacement adoption. South Korea shows 5.1% growth, supported by K-beauty texture systems innovation and solid-dose innovation with functional foods and supplements expansion.
The report covers an in-depth analysis of 40+ countries, the top-performing countries are highlighted below.
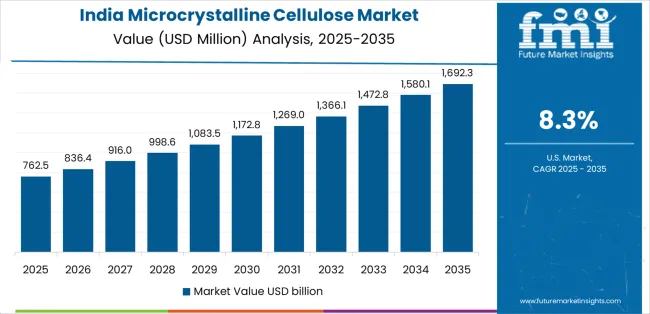
Revenue from microcrystalline cellulose in India is projected to exhibit exceptional growth with a CAGR of 8.3% through 2035, driven by rapid expansion in generic pharmaceutical manufacturing serving domestic healthcare needs and global export markets, rising domestic excipient production capacity reducing historical import dependency and supporting pharmaceutical industry cost competitiveness, and fast growth in clean-label food categories addressing increasingly health-conscious urban consumers demanding natural ingredients. The country's position as a global generics manufacturing hub and expanding food processing sector are creating substantial demand for pharmaceutical and food-grade microcrystalline cellulose across diverse applications and quality tiers. Major international excipient suppliers and domestic cellulose manufacturers are establishing comprehensive microcrystalline cellulose production and distribution capabilities to serve both domestic pharmaceutical markets and export opportunities.
Revenue from microcrystalline cellulose in China is expanding at a CAGR of 7.4%, supported by the country's enormous pharmaceutical manufacturing scale serving the world's largest population and significant generic drug export capabilities, processed foods growth driven by urbanization, rising incomes, and convenience-seeking consumers, and investments in bio-based cellulose production infrastructure supporting domestic raw material security and environmental sustainability objectives. The country's integrated pharmaceutical and food manufacturing ecosystems and government support for industry upgrading are driving demand for diverse microcrystalline cellulose grades. International excipient companies and Chinese cellulose producers are establishing extensive manufacturing and technical service capabilities to address growing microcrystalline cellulose demand.
Revenue from microcrystalline cellulose in Brazil is growing at a CAGR of 6.5%, driven by local pharmaceutical and nutraceutical manufacturing capacity ramp-up addressing domestic healthcare requirements and regional export opportunities, convenience foods penetration driven by urbanization and expanding middle-class purchasing power, and import substitution strategies in pharmaceutical excipients supporting domestic industry development and supply chain security. The country's large healthcare market and growing food processing sector are supporting demand for pharmaceutical and food-grade microcrystalline cellulose across applications. International excipient suppliers and domestic chemical companies are establishing comprehensive capabilities to serve Brazilian microcrystalline cellulose markets.
Revenue from microcrystalline cellulose in Germany is expanding at a CAGR of 6.2%, supported by the country's high-specification pharmaceutical demand requiring ultra-high purity and comprehensive analytical documentation for branded and generic drug manufacturing, strong personal care formulation expertise driving innovative texture system development, and shift to certified low-nitrite microcrystalline cellulose grades addressing proactive nitrosamine risk mitigation in pharmaceutical quality management. Germany's leadership in pharmaceutical quality standards and advanced cosmetic formulation are driving demand for premium microcrystalline cellulose grades. Leading excipient suppliers and specialty cellulose manufacturers are investing in specialized capabilities to serve German quality requirements and innovation-driven markets.
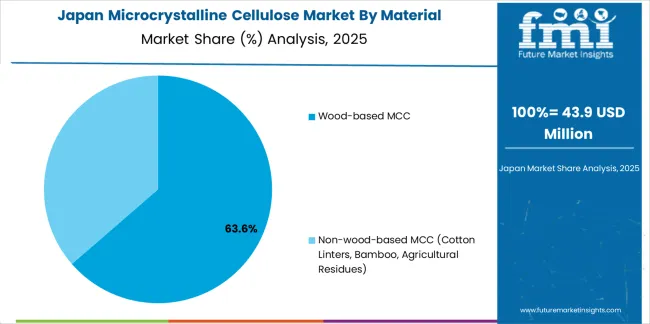
Revenue from microcrystalline cellulose in Japan is expanding at a CAGR of 5.6%, supported by the country's focus on aging-care formulations including orally disintegrating tablets addressing swallowing difficulties in elderly populations, functional foods emphasis supporting health maintenance and disease prevention through nutritional intervention, and premium quality standards requiring exceptional purity, consistent functionality, and comprehensive documentation throughout pharmaceutical and food supply chains. Japan's sophisticated healthcare system and quality-conscious consumers are driving demand for specialized microcrystalline cellulose grades. Leading Japanese pharmaceutical companies and excipient suppliers are investing in specialized capabilities to serve domestic quality requirements and demographic trends.
Revenue from microcrystalline cellulose in the United States is expanding at a CAGR of 5.4%, supported by the country's strict FDA excipient control requiring comprehensive quality documentation and regulatory compliance supporting pharmaceutical product quality and patient safety, protein and meal-replacement adoption driving functional beverage and nutritional bar development utilizing microcrystalline cellulose for texture and suspension properties, and steady contract development and manufacturing organization demand supporting pharmaceutical outsourcing trends and formulation development services. The nation's mature pharmaceutical market and innovative food technology sectors are driving demand for diverse microcrystalline cellulose applications. Major excipient suppliers and food ingredient companies are investing in comprehensive microcrystalline cellulose supply chains to serve both pharmaceutical and food markets.
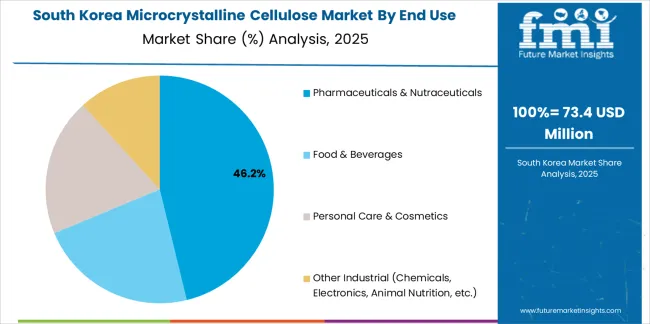
Revenue from microcrystalline cellulose in South Korea is growing at a CAGR of 5.1%, driven by the country's influential K-beauty industry's adoption of microcrystalline cellulose in texture systems for cushion foundations, pressed powders, and skincare formulations emphasizing smooth application and natural finish, solid-dose pharmaceutical innovation addressing domestic healthcare needs and export opportunities in generic and specialty pharmaceuticals, and functional foods and supplements expansion driven by health-conscious consumers and preventive healthcare culture. The country's dynamic beauty industry and advanced pharmaceutical sector are supporting investment in microcrystalline cellulose capabilities. Korean cosmetic companies and pharmaceutical manufacturers are establishing comprehensive microcrystalline cellulose formulation expertise to support product innovation and export growth.
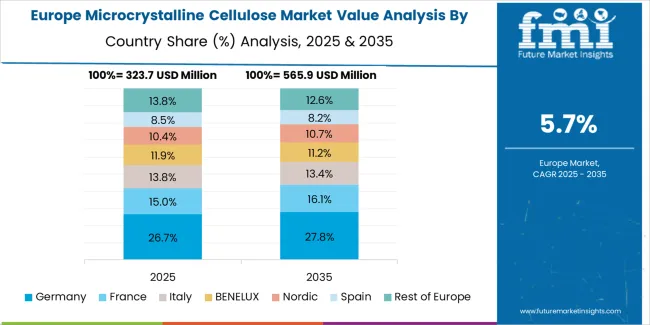
The microcrystalline cellulose market in Europe is projected to grow from USD 412 million in 2025 to USD 692 million by 2035, registering a CAGR of 5.3% over the forecast period. Germany is expected to maintain its leadership position with a 22.4% market share in 2025, holding at 22.4% by 2035, supported by its large prescription and over-the-counter pharmaceutical manufacturing base, strict excipient quality regimes, and strong tableting capacity in North Rhine-Westphalia and Bavaria industrial regions.
The United Kingdom follows with 16.3% in 2025, projected to reach 16.5% by 2035, driven by branded generics manufacturing, contract development and manufacturing organization activity, and high clean-label food adoption among health-conscious consumers. France holds 14.6% in 2025, rising to 14.8% by 2035, supported by broad pharmaceutical manufacturing and premium cosmetics usage across beauty and personal care applications. Italy commands 10.2% in 2025, projected to reach 10.4% by 2035, driven by solid-dose pharmaceutical hubs in Lombardy and Emilia-Romagna regions. Spain accounts for 7.5% in 2025, expected to reach 7.7% by 2035, supported by growing nutraceuticals sector and food applications. The Netherlands maintains 5.9% in 2025, growing to 6% by 2035, driven by food technology expertise and pharmaceutical distribution strengths. The Rest of Europe region, including Nordic countries, Central and Eastern Europe, Benelux excluding Netherlands, Ireland, Switzerland, Austria, and other markets, holds 23.1% in 2025, moderating to 22.2% by 2035, attributed to momentum in specialty pharmaceutical manufacturing, dairy applications, and sustainable packaging fiber development across emerging markets implementing advanced excipient standards and clean-label food formulations.
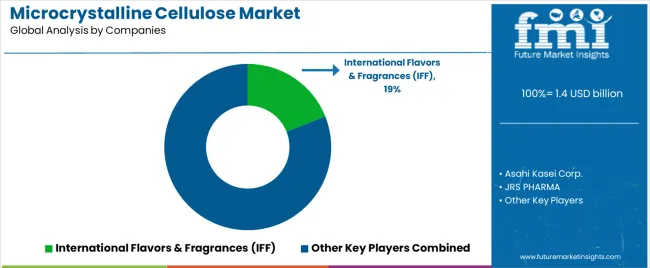
The microcrystalline cellulose market is characterized by competition among established pharmaceutical excipient manufacturers, integrated cellulose producers, and specialized functional ingredient suppliers. Companies are investing in advanced particle engineering research, quality assurance excellence, sustainable sourcing development, and comprehensive product portfolios to deliver high-purity, consistent, and certified microcrystalline cellulose solutions. Innovation in low-nitrite grades, non-wood sourcing, and functionality-optimized products is central to strengthening market position and competitive advantage.
International Flavors & Fragrances (IFF) leads the market with a commanding 19% market share through its Pharma Solutions division offering the Avicel® brand microcrystalline cellulose portfolio, with advanced grades including low-nitrite variants addressing nitrosamine risk mitigation and comprehensive technical support across pharmaceutical, food, and personal care applications. Asahi Kasei Corp. provides premium Ceolus™ microcrystalline cellulose with ultra-low nitrite specifications emphasizing pharmaceutical quality and regulatory compliance. JRS PHARMA specializes in pharmaceutical excipients with emphasis on particle-engineered grades and co-processed formulations. DFE Pharma offers comprehensive excipient solutions with focus on direct compression applications and formulation support services. Roquette Frères delivers integrated pharmaceutical and food ingredients with emphasis on natural sourcing and sustainability credentials. Mingtai Chemical focuses on cost-competitive Asian production serving pharmaceutical and industrial markets. Sigachi Industries specializes in Indian pharmaceutical excipient manufacturing with emphasis on domestic market leadership and export growth. Accent Microcell provides North American pharmaceutical-grade production with technical service capabilities. Anhui Shanhe Pharma Accessories offers Chinese pharmaceutical excipient manufacturing supporting domestic generics industry. Chemfield Cellulose focuses on specialized cellulose derivatives and microcrystalline cellulose applications across diverse end uses.
Microcrystalline cellulose represents a specialized functional ingredient segment within pharmaceutical excipients and food additives, projected to grow from USD 1.4 billion in 2025 to USD 2.7 billion by 2035 at a 6.8% CAGR. This purified, partially depolymerized cellulose primarily wood-based pharmaceutical grades for solid-dose applications is produced through acid hydrolysis and spray drying processes to serve as a multifunctional excipient providing binding, disintegration, and flow properties in pharmaceutical tablets and capsules, a texture modifier and fat replacer in food products, and a rheology modifier in personal care formulations. Market expansion is driven by increasing generic pharmaceutical manufacturing capacity, growing clean-label food ingredient demand, expanding nutraceutical production, and rising emphasis on pharmaceutical quality improvement including nitrosamine risk mitigation across diverse pharmaceutical, food, and personal care applications.
| Items | Values |
|---|---|
| Quantitative Units (2025) | USD 1.4 billion |
| Material | Wood-based MCC, Non-wood-based MCC (Cotton Linters, Bamboo, Agricultural Residues) |
| Product Grade | Pharmaceutical Grade, Food Grade, Industrial/Technical Grade |
| End Use | Pharmaceuticals & Nutraceuticals, Food & Beverages, Personal Care & Cosmetics, Other Industrial (Chemicals, Electronics, Animal Nutrition) |
| Regions Covered | Asia Pacific, North America, Europe, Latin America, Middle East & Africa |
| Countries Covered | India, China, Brazil, Germany, Japan, United States, South Korea, and 40+ countries |
| Key Companies Profiled | IFF, Asahi Kasei, JRS PHARMA, DFE Pharma, Roquette Frères, Mingtai Chemical |
| Additional Attributes | Dollar sales by material, product grade, and end-use categories, regional demand trends, competitive landscape, technological advancements in particle engineering, low-nitrite grade development, sustainable sourcing innovation, and pharmaceutical quality optimization |
The global microcrystalline cellulose market is estimated to be valued at USD 1.4 billion in 2025.
The market size for the microcrystalline cellulose market is projected to reach USD 2.7 billion by 2035.
The microcrystalline cellulose market is expected to grow at a 6.8% CAGR between 2025 and 2035.
The key product types in microcrystalline cellulose market are wood-based mcc and non-wood-based mcc (cotton linters, bamboo, agricultural residues).
In terms of end use, pharmaceuticals & nutraceuticals segment to command 46.0% share in the microcrystalline cellulose market in 2025.
Explore Similar Insights

Thank you!
You will receive an email from our Business Development Manager. Please be sure to check your SPAM/JUNK folder too.
Chat With
MaRIA