Reports

- Global Locations -

Headquarters

Future Market Insights, Inc.

Christiana Corporate, 200
Continental Drive, Suite 401,
Newark, Delaware - 19713,
United States

T: +1-845-579-5705

Americas

Future Market Insights, Inc.

616 Corporate Way, Suite 2-9018,
Valley Cottage, NY 10989, United States

T: +1-347-918-3531

MEA

Future Market Insights

1602-6 Jumeirah Bay X2 Tower, Plot No: JLT-PH2-X2A,
Jumeirah Lakes Towers, Dubai,
United Arab Emirates

Europe

Future Market Insights

3rd Floor, 207 Regent Street,
W1B 3HH London
United Kingdom

T: + 44 (0) 20 8123 9659
D: +44 (0) 20 3287 4268

Asia Pacific

Future Market Insights

IndiaLand Global Tech Park, Unit UG-1, Behind Grand HighStreet, Phase 1, Hinjawadi, MH, Pune – 411057, India

Cellulose Fiber Market Outlook

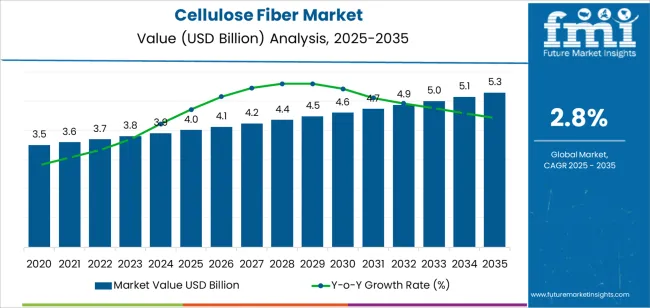
The global cellulose fiber market is predicted to have matured from its estimated US$ 3.9 billion in 2024 to US$ 5.2 billion by 2034. Between 2024 and 2034, a 2.8% CAGR is projected for the sales revenue of cellulose fiber.

Demand for cellulose fibers is rising, which is expected to encourage the expansion of the cellulose fiber market throughout the forecast period. Manufacturers of cellulose fiber are searching for eco-friendly and biodegradable fiber alternatives to those derived from petrochemicals.

The global textile and clothing industries are expanding, raising demand for cellulose fiber and is anticipated to advance the cellulose fiber market. This is because cellulose fibers are widely used in these industries.

Attributes Details
Market Value for 2024 US$ 3.9 billion
Market Value for 2034 US$ 5.2 billion
Market CAGR from 2024 to 2034 2.8%

Don't pay for what you don't need

Customize your report by selecting specific countries or regions and save 30%!

Natural Fibers Paving the Way for Greener Industries

The growing demand for natural fibers across textile and construction industries, is the main driving force compelling the market expansion of cellulose fiber for textiles. Utilizing natural fibers, oils, and resins as eco-composite engineering components presents a range of novel opportunities for agricultural practices.

Applications such as papermaking, better drainage, and enhanced refinability have been made possible by applying cellulases to cellulose fibers. The bacterial cellulose material used by the burgeoning firm reduces discomfort and acts as a biological barrier against bacterial invasion. The cellulose fiber for filtration market is growing due to all these advancements and advantageous features.

Attributes Details
Market Value for 2019 US$ 3.5 billion
Market Value for 2023 US$ 3.8 billion
Market CAGR from 2019 to 2023 1.9%

The Integration of Cellulose Fibers in Modern Building Practices

The construction industry makes substantial demand for cellulose fibers. In order to protect structures from outside damage, they are extensively utilized in the building and construction industry.

The global papermaking fiber market is growing at a rapid pace due to the rise in end-use industries, urbanization, and population. Market value growth is facilitated by the rising industrialization and urbanization of emerging nations like China, India, and Southeast Asia.

Ismail Sutaria
Ismail Sutaria

Principal Consultant

Talk to Analyst

Find your sweet spots for generating winning opportunities in this market.

Challenges in the Cellulose Fiber Industry

One of the main obstacles to the cellulose fiber industry's growth has been the price of cellulose fiber. The utilization of raw materials in large-scale firms is constrained due to their frequent fluctuations in price, which are inherent in the manufacturing of cellulose fiber.

The cellulose fiber sector requires a large commitment of money and expertise, making it capital-intensive. The cellulose fiber industry's primary barrier is the substantial expenditure on research and development activities to create new technology. Several obstacles to overcome include fluctuating raw material prices, dwindling cotton supplies, and government-imposed strict environmental laws about forests.

Comparative View of Adjacent Cellulose Fiber Market

The powdered cellulose market and the dietary fiber market have both been studied by Future Market Insights (FMI). The data depict the projected growth of the cellulose fiber market from 2024 to 2034 with regard to other markets. It showcases the potential for revenue in the additional markets shown below.

Cellulose Fiber Market:

Attributes Cellulose Fiber Market
Value-based CAGR (2024 to 2034) 2.8%
Growth Factor Technological developments boost manufacturing efficiency and support the growth of the cellulose fiber market.
Market Trend The demand for cellulose fiber is growing faster due to the textile and packaging sectors' shift to renewable solutions in the textile fiber market.
Market Restraint The benefits of cellulose fiber are not well known by consumers, which restricts market expansion.

Powdered Cellulose Market:

Attributes Powdered Cellulose Market
Value-based CAGR (2024 to 2034) 4.9%
Growth Factor The demand for powdered cellulose is partly due to the global expansion of the food and beverage industry.
Market Trend Powdered cellulose market growth is driven by rising consumer awareness of the health advantages of dietary fibers.
Market Restraint Market expansion is hampered by regulations limiting the maximum amounts of powdered cellulose used in food items.

Dietary Fiber Market:

Attributes Dietary Fiber Market
Value-based CAGR (2024 to 2034) 10.3%
Growth Factor Dietary fiber products are in high demand due to the growing prevalence of lifestyle-related disorders including diabetes and obesity.
Market Trend The dietary fiber market expansion is aided by government programs that support dietary standards and good eating habits.
Market Restraint Manufacturers of dietary fiber face hurdles with complex regulations and dietary fiber content labeling requirements.

Get the data you need at a Fraction of the cost

Personalize your report by choosing insights you need
and save 40%!

Category-wise Outlook

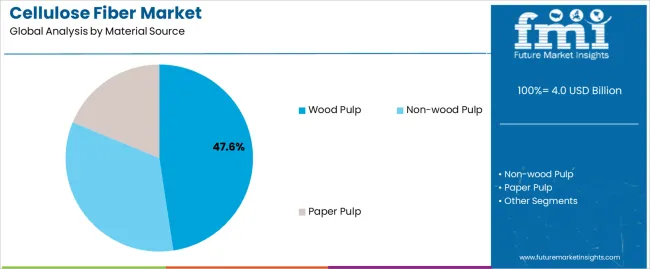
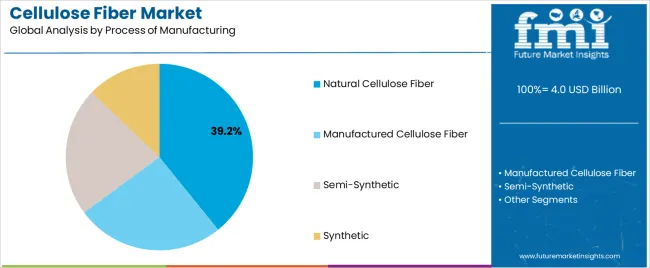
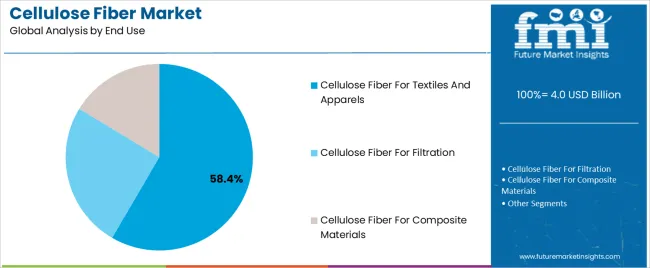
The segmented market analysis of cellulose fiber is included in the following subsection. Based on comprehensive studies, the paper pulp sector is leading the material sources category, and the textile and apparels segment is commanding the category.

The Dominance of Paper Pulp in Cellulose Fiber Sales

Segment Paper Pulp
Share (2024) 31.3%
  • The expanding market trend towards eco-friendly and renewable resources is in line with the popularity of paper pulp, which is encouraged by concerns about sustainability.
  • Paper pulp continues to lead in cellulose fiber sales due to consumer demands for lightweight, high-performance materials that also appeal to various businesses.
  • Due to its affordability, paper pulp is a favored option for cellulose fiber providers looking for low-cost solutions.

Textiles and Apparels Propel Cellulose Fiber Market

Segment Textiles and Apparels
Share (2024) 28.3%
  • The textiles and apparels segment’s growing focus on biodegradable and sustainable solutions makes cellulose fibers a top option for companies looking for environmentally friendly materials.
  • Cellulose fibers are widely used in textiles and apparels segment because of their innate breathability, comfort, and durability, which supports their dominance in sales.
  • By utilizing the significance of cellulose fibers in the industry, manufacturers leverage the growing demand for sustainable textiles and apparels and profit from the market trend.

Country-wise Analysis

The cellulose fiber market can be observed in the subsequent tables, which focus on the leading regions in North America, Europe, and Asia Pacific. A comprehensive evaluation demonstrates that Asia Pacific has enormous market opportunities for cellulose fiber.

Sales Analysis of Cellulose Fiber in North America

Countries CAGR (2024 to 2034)
United States 1.6%
Canada 1.3%

United States Lyocell Fiber Market Outlook

  • The cellulose fiber market is expanding across a variety of applications because of government initiatives that support bio-based products.
  • The textile industry's increasing demand for cellulose fibers, especially for eco-friendly apparel, is a major factor sustaining the United States cellulose fiber market expansion.

Canada Regenerated Cellulose Fiber Market Outlook

  • Demand for cellulose fibers is rising in Canada across several industries, including the packaging and automotive sectors, as people become more aware of its benefits for the environment.
  • Technological developments in the production are allowing Canadian cellulose fiber producers to provide premium and affordable goods to international consumers.

Opportunities for Cellulose Fiber Market in Europe

Countries CAGR (2024 to 2034)
Germany 1%
United Kingdom 1.3%
France 1.9%
Italy 1.4%
Spain 2.5%

Germany Rayon Fiber Market Outlook

  • Germany is positioned as a major participant in developing high-performance cellulose-based products owing to its advanced manufacturing capabilities and innovation-focused approach.
  • Germany is a major hub for cellulose fiber manufacturing and distribution in Europe, partly due to its strategic location and easy access to important markets.

United Kingdom Cotton Alternative Market Outlook

  • The cellulose fiber market has growth and innovation opportunities due to the United Kingdom's dedication to lowering carbon emissions and encouraging renewable resources.
  • The United Kingdom is at the forefront of developing specialty cellulose fibers for niche markets due to technological innovation and a commitment to high-quality products.

France Rayon Fiber Market Outlook

  • Cellulose fiber adoption in France's manufacturing industry is driven by consumer demand for sustainable materials and growing awareness of environmental issues.
  • The development of bio-based products and the shift towards a circular economy, backed by the government, open up favorable regulatory conditions for the French cellulose fiber industry to flourish.

Italy Cotton Alternative Market Outlook

  • A trained staff and a well-established manufacturing infrastructure in the Italian cellulose fiber sector support high-quality production techniques.
  • Due to Italy's leadership in the fashion and design sectors, there are prospects for integrating cellulose fibers into high-value products, like clothing and accessories.

Spain Biodegradable Fiber Market Outlook

  • The production and adoption of cellulose fibers are supported by investments and initiatives spearheaded by the Spanish government due to its emphasis on renewable solutions in the textile fiber market.
  • The thriving agricultural sector in Spain fosters the industry's expansion by supplying raw materials for cellulose fiber production.

Opportunities in the Asia Pacific Cellulose Fiber Industry

Countries CAGR (2024 to 2034)
India 5.5%
China 4.4%
Japan 1.5%
South Korea 1.9%
Thailand 3.9%

India Sustainable Fiber Market Outlook

  • The Indian textile and packaging industries' demand for cellulose fibers is fostered by the country's rapid urbanization and shifting consumer tastes.
  • The production of cellulose fiber benefits from technological improvements that make Indian firms more competitive in the international market.

China Biodegradable Fiber Market Outlook

  • China's demand for cellulose fibers is driven by shifting lifestyles and rising disposable income across various industries.
  • Investments in the cellulose fiber sector are bolstered by China's strategic goal of becoming a global leader in green technology, promoting sustainable growth.

Japan Papermaking Fiber Market Outlook

  • The aging population in Japan is generating potential for the adoption of cellulose fiber in the medical and healthcare industries, particularly in wound care and hygiene goods.
  • The Japanese cellulose fiber industry is seeing an increase in investment and innovation because of government assistance for developing bio-based materials.

South Korea Sustainable Fiber Market Outlook

  • The adoption of cellulose fibers in various applications is spreading throughout South Korea due to a focus on environmental responsibility and sustainability.
  • Cellulose fibers are being more widely used in high-tech industries like electronics and aerospace because of South Korea's reputation as a global center of innovation and technology.

Thailand Natural Fiber Market Outlook

  • The need in Thailand for environmentally friendly products, such as cellulose fibers, is driven by rising consumer awareness of environmental issues.
  • The adoption of cellulose fibers in Thailand's manufacturing industry is propelled by government programs encouraging using bio-based materials.

Competitive Analysis

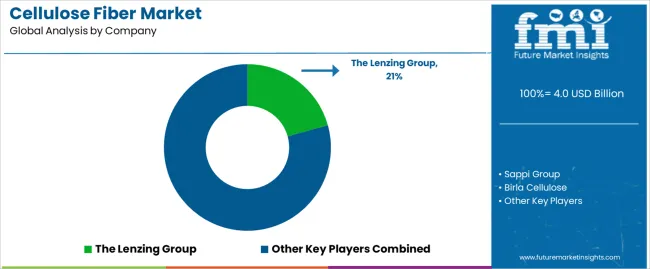
Leading producers of cellulose fiber, like Tembec Inc., Birla Cellulose, and Sappi Group, have made a name for themselves in the market by fostering innovation and establishing standards for sustainability and quality. The Lenzing Group, Tangshan Sanyou Group Xingda Chemical Fiber Co. Ltd., and Thai Rayon Public Co. Ltd. all have important roles to play in the wide range of technological products and innovations in wood pulp fiber market.

Emerging vendors of cellulose fiber, such as Ioncell and Bacterial Cellulose Solutions, are expanding the realm of applications, questioning conventional wisdom, and providing fresh viewpoints and technological innovations. Fulida Group Holding Co., LTD. and Manasi Aoyang Technology Co. Ltd. achieved noteworthy progress in this competitive arena, enhancing the market with their distinctive goods and tactics.

With a constant focus on innovation, sustainability, and satisfying the changing needs of both industries and customers, cellulose fiber providers face intense competition as they navigate the continually evolving market.

Notable Advancements

Company Details
Confederation of Paper Industries (CPI) The Confederation of Paper Industries (CPI) declared in May 2023 the opening of a new service to assess the recyclability of products and materials made of fiber for packaging. Users analyze their products online with Papercycle, a new assessment and certification program.
Sappi Sappi pledged 2022 to contribute to the solution and is trying to decarbonize its activities. Next, in its long-term global commitment to climate preservation and sustainable production, it stopped using coal at its German facility in Stockstadt. The mill only ran on natural gas and renewable biomass after demolishing its coal-fired Boiler 9.
Birla cellulose A garment designed by Lee Mathews and manufactured by Tree-Rree NullarborTM lyocell unveiled by Nanollose at the fashion summit in June 2022 in collaboration with Birla Cellulose.
IoncellOy IoncellOy stated in May 2022 that it would begin to commercialize the manufacturing of eco-friendly textile fiber innovations.
Birla Cellulose Birla Cellulose and Renewcell, a Swedish company that develops textile-to-textile recycling, inked a Letter of Intent in March 2022 to begin a long-term business relationship to produce artificial cellulosic fiber.

Pivotal Cellulose Fiber Manufacturers

  • Sappi Group
  • Birla Cellulose
  • Tembec Inc.
  • The Lenzing Group
  • Thai Rayon Public Co. Ltd.
  • Tangshan Sanyou Group Xingda Chemical Fiber Co. Ltd.
  • Ioncell
  • Bacterial Cellulose Solutions
  • Fulida Group Holding Co., LTD.
  • Manasi Aoyang Technology Co. Ltd.

Key Coverage in Cellulose Fiber Market Report

  • Trending Forces Advancing the Cellulose Fiber Market
  • Constraints on Market Growth of Cellulose Fiber
  • The Market Accelerators of Growth of The Cellulose Fiber in North America
  • Future Developments Facilitating Asia Pacific Market Growth of Organic Cellulose Fibers
  • Opportunities That the Cellulose Fiber Vendors Encounter

Key Segments

By Material Source:

  • Wood Pulp
  • Non-wood Pulp
  • Paper pulp

By Process of Manufacturing:

  • Natural Cellulose Fiber
    • Plant-based
      • Cotton
      • Flax (Linen)
      • Jute
    • Wood-based
    • Animal-based
    • Alpaca-based
    • Silk-based
  • Manufactured Cellulose Fiber:
  • Semi-Synthetic
    • Rayon or Viscose
    • Modal
  • Synthetic
    • Nylon
    • Polyester

By End Use:

  • Cellulose Fiber for Textiles and Apparels
  • Cellulose Fiber for Filtration
  • Cellulose Fiber for Composite Materials

By Region:

  • North America
  • Latin America
  • Europe
  • Asia Pacific
  • Middle East and Africa

Frequently Asked Questions

What is Current Cellulose Fiber Market Valuation?

The natural fiber market to secure a valuation US$ 3.9 billion in 2024.

How Big Can the Cellulose Fiber Market Be by 2034?

The biodegradable fiber market is estimated to reach US$ 5.2 billion by 2034.

What is the Growth Potential of the Cellulose Fiber Market?

Through 2034, the sustainable fiber market is anticipated to expand at a 2.8% CAGR.

What Was the Historical Outlook of The Cellulose Fiber Market?

From 2019 to 2023, the viscose fiber market recorded a 1.9% CAGR.

Which Material Source Segment to Dominate in the Cellulose Fiber Market?

The paper pulp sector is set to attain a market share of 31.3% in 2024.

Which End Use Segment to Lead the Cellulose Fiber Market?

A 28.3% market share is expected for the textiles and apparels sector in 2024.

Table of Content

1. Executive Summary

    1.1. Global Market Outlook

    1.2. Demand-side Trends

    1.3. Supply-side Trends

    1.4. Technology Roadmap Analysis

    1.5. Analysis and Recommendations

2. Market Overview

    2.1. Market Coverage / Taxonomy

    2.2. Market Definition / Scope / Limitations

3. Market Background

    3.1. Market Dynamics

        3.1.1. Drivers

        3.1.2. Restraints

        3.1.3. Opportunity

        3.1.4. Trends

    3.2. Scenario Forecast

        3.2.1. Demand in Optimistic Scenario

        3.2.2. Demand in Likely Scenario

        3.2.3. Demand in Conservative Scenario

    3.3. Opportunity Map Analysis

    3.4. Product Life Cycle Analysis

    3.5. Supply Chain Analysis

        3.5.1. Supply Side Participants and their Roles

            3.5.1.1. Manufacturer

            3.5.1.2. Mid-Level Participants (Traders)

            3.5.1.3. Distributors

        3.5.2. Value Added and Value Created at Node in the Supply Chain

        3.5.3. List of Raw Material Suppliers

        3.5.4. List of Existing and Potential Buyer’s

    3.6. Investment Feasibility Matrix

    3.7. Value Chain Analysis

        3.7.1. Profit Margin Analysis

        3.7.2. Distributors

    3.8. PESTLE and Porter’s Analysis

    3.9. Regulatory Landscape

        3.9.1. By Key Regions

        3.9.2. By Key Countries

    3.10. Regional Parent Market Outlook

    3.11. Production and Consumption Statistics

    3.12. Import and Export Statistics

4. Global Market Analysis 2019 to 2023 and Forecast, 2024 to 2034

    4.1. Historical Market Size Value (US$ Million) & Volume (Tons) Analysis, 2019 to 2023

    4.2. Current and Future Market Size Value (US$ Million) & Volume (Tons) Projections, 2024 to 2034

        4.2.1. Y-o-Y Growth Trend Analysis

        4.2.2. Absolute $ Opportunity Analysis

5. Global Market Analysis 2019 to 2023 and Forecast 2024 to 2034, By Product Type

    5.1. Introduction / Key Findings

    5.2. Historical Market Size Value (US$ Million) & Volume (Tons) Analysis By Product Type, 2019 to 2023

    5.3. Current and Future Market Size Value (US$ Million) & Volume (Tons) Analysis and Forecast By Product Type, 2024 to 2034

        5.3.1. Natural

        5.3.2. Synthetic

    5.4. Y-o-Y Growth Trend Analysis By Product Type, 2019 to 2023

    5.5. Absolute $ Opportunity Analysis By Product Type, 2024 to 2034

6. Global Market Analysis 2019 to 2023 and Forecast 2024 to 2034, By Application

    6.1. Introduction / Key Findings

    6.2. Historical Market Size Value (US$ Million) & Volume (Tons) Analysis By Application, 2019 to 2023

    6.3. Current and Future Market Size Value (US$ Million) & Volume (Tons) Analysis and Forecast By Application, 2024 to 2034

        6.3.1. Textile Products

        6.3.2. Apparel Products

        6.3.3. Filtration Products

        6.3.4. Industrial Products

        6.3.5. Others

    6.4. Y-o-Y Growth Trend Analysis By Application, 2019 to 2023

    6.5. Absolute $ Opportunity Analysis By Application, 2024 to 2034

7. Global Market Analysis 2019 to 2023 and Forecast 2024 to 2034, By Region

    7.1. Introduction

    7.2. Historical Market Size Value (US$ Million) & Volume (Tons) Analysis By Region, 2019 to 2023

    7.3. Current Market Size Value (US$ Million) & Volume (Tons) Analysis and Forecast By Region, 2024 to 2034

        7.3.1. North America

        7.3.2. Latin America

        7.3.3. Western Europe

        7.3.4. Eastern Europe

        7.3.5. South Asia and Pacific

        7.3.6. East Asia

        7.3.7. Middle East and Africa

    7.4. Market Attractiveness Analysis By Region

8. North America Market Analysis 2019 to 2023 and Forecast 2024 to 2034, By Country

    8.1. Historical Market Size Value (US$ Million) & Volume (Tons) Trend Analysis By Market Taxonomy, 2019 to 2023

    8.2. Market Size Value (US$ Million) & Volume (Tons) Forecast By Market Taxonomy, 2024 to 2034

        8.2.1. By Country

            8.2.1.1. USA

            8.2.1.2. Canada

        8.2.2. By Product Type

        8.2.3. By Application

    8.3. Market Attractiveness Analysis

        8.3.1. By Country

        8.3.2. By Product Type

        8.3.3. By Application

    8.4. Key Takeaways

9. Latin America Market Analysis 2019 to 2023 and Forecast 2024 to 2034, By Country

    9.1. Historical Market Size Value (US$ Million) & Volume (Tons) Trend Analysis By Market Taxonomy, 2019 to 2023

    9.2. Market Size Value (US$ Million) & Volume (Tons) Forecast By Market Taxonomy, 2024 to 2034

        9.2.1. By Country

            9.2.1.1. Brazil

            9.2.1.2. Mexico

            9.2.1.3. Rest of Latin America

        9.2.2. By Product Type

        9.2.3. By Application

    9.3. Market Attractiveness Analysis

        9.3.1. By Country

        9.3.2. By Product Type

        9.3.3. By Application

    9.4. Key Takeaways

10. Western Europe Market Analysis 2019 to 2023 and Forecast 2024 to 2034, By Country

    10.1. Historical Market Size Value (US$ Million) & Volume (Tons) Trend Analysis By Market Taxonomy, 2019 to 2023

    10.2. Market Size Value (US$ Million) & Volume (Tons) Forecast By Market Taxonomy, 2024 to 2034

        10.2.1. By Country

            10.2.1.1. Germany

            10.2.1.2. UK

            10.2.1.3. France

            10.2.1.4. Spain

            10.2.1.5. Italy

            10.2.1.6. Rest of Western Europe

        10.2.2. By Product Type

        10.2.3. By Application

    10.3. Market Attractiveness Analysis

        10.3.1. By Country

        10.3.2. By Product Type

        10.3.3. By Application

    10.4. Key Takeaways

11. Eastern Europe Market Analysis 2019 to 2023 and Forecast 2024 to 2034, By Country

    11.1. Historical Market Size Value (US$ Million) & Volume (Tons) Trend Analysis By Market Taxonomy, 2019 to 2023

    11.2. Market Size Value (US$ Million) & Volume (Tons) Forecast By Market Taxonomy, 2024 to 2034

        11.2.1. By Country

            11.2.1.1. Poland

            11.2.1.2. Russia

            11.2.1.3. Czech Republic

            11.2.1.4. Romania

            11.2.1.5. Rest of Eastern Europe

        11.2.2. By Product Type

        11.2.3. By Application

    11.3. Market Attractiveness Analysis

        11.3.1. By Country

        11.3.2. By Product Type

        11.3.3. By Application

    11.4. Key Takeaways

12. South Asia and Pacific Market Analysis 2019 to 2023 and Forecast 2024 to 2034, By Country

    12.1. Historical Market Size Value (US$ Million) & Volume (Tons) Trend Analysis By Market Taxonomy, 2019 to 2023

    12.2. Market Size Value (US$ Million) & Volume (Tons) Forecast By Market Taxonomy, 2024 to 2034

        12.2.1. By Country

            12.2.1.1. India

            12.2.1.2. Bangladesh

            12.2.1.3. Australia

            12.2.1.4. New Zealand

            12.2.1.5. Rest of South Asia and Pacific

        12.2.2. By Product Type

        12.2.3. By Application

    12.3. Market Attractiveness Analysis

        12.3.1. By Country

        12.3.2. By Product Type

        12.3.3. By Application

    12.4. Key Takeaways

13. East Asia Market Analysis 2019 to 2023 and Forecast 2024 to 2034, By Country

    13.1. Historical Market Size Value (US$ Million) & Volume (Tons) Trend Analysis By Market Taxonomy, 2019 to 2023

    13.2. Market Size Value (US$ Million) & Volume (Tons) Forecast By Market Taxonomy, 2024 to 2034

        13.2.1. By Country

            13.2.1.1. China

            13.2.1.2. Japan

            13.2.1.3. South Korea

        13.2.2. By Product Type

        13.2.3. By Application

    13.3. Market Attractiveness Analysis

        13.3.1. By Country

        13.3.2. By Product Type

        13.3.3. By Application

    13.4. Key Takeaways

14. Middle East and Africa Market Analysis 2019 to 2023 and Forecast 2024 to 2034, By Country

    14.1. Historical Market Size Value (US$ Million) & Volume (Tons) Trend Analysis By Market Taxonomy, 2019 to 2023

    14.2. Market Size Value (US$ Million) & Volume (Tons) Forecast By Market Taxonomy, 2024 to 2034

        14.2.1. By Country

            14.2.1.1. GCC Countries

            14.2.1.2. South Africa

            14.2.1.3. Israel

            14.2.1.4. Rest of MEA

        14.2.2. By Product Type

        14.2.3. By Application

    14.3. Market Attractiveness Analysis

        14.3.1. By Country

        14.3.2. By Product Type

        14.3.3. By Application

    14.4. Key Takeaways

15. Key Countries Market Analysis

    15.1. USA

        15.1.1. Pricing Analysis

        15.1.2. Market Share Analysis, 2023

            15.1.2.1. By Product Type

            15.1.2.2. By Application

    15.2. Canada

        15.2.1. Pricing Analysis

        15.2.2. Market Share Analysis, 2023

            15.2.2.1. By Product Type

            15.2.2.2. By Application

    15.3. Brazil

        15.3.1. Pricing Analysis

        15.3.2. Market Share Analysis, 2023

            15.3.2.1. By Product Type

            15.3.2.2. By Application

    15.4. Mexico

        15.4.1. Pricing Analysis

        15.4.2. Market Share Analysis, 2023

            15.4.2.1. By Product Type

            15.4.2.2. By Application

    15.5. Germany

        15.5.1. Pricing Analysis

        15.5.2. Market Share Analysis, 2023

            15.5.2.1. By Product Type

            15.5.2.2. By Application

    15.6. UK

        15.6.1. Pricing Analysis

        15.6.2. Market Share Analysis, 2023

            15.6.2.1. By Product Type

            15.6.2.2. By Application

    15.7. France

        15.7.1. Pricing Analysis

        15.7.2. Market Share Analysis, 2023

            15.7.2.1. By Product Type

            15.7.2.2. By Application

    15.8. Spain

        15.8.1. Pricing Analysis

        15.8.2. Market Share Analysis, 2023

            15.8.2.1. By Product Type

            15.8.2.2. By Application

    15.9. Italy

        15.9.1. Pricing Analysis

        15.9.2. Market Share Analysis, 2023

            15.9.2.1. By Product Type

            15.9.2.2. By Application

    15.10. Poland

        15.10.1. Pricing Analysis

        15.10.2. Market Share Analysis, 2023

            15.10.2.1. By Product Type

            15.10.2.2. By Application

    15.11. Russia

        15.11.1. Pricing Analysis

        15.11.2. Market Share Analysis, 2023

            15.11.2.1. By Product Type

            15.11.2.2. By Application

    15.12. Czech Republic

        15.12.1. Pricing Analysis

        15.12.2. Market Share Analysis, 2023

            15.12.2.1. By Product Type

            15.12.2.2. By Application

    15.13. Romania

        15.13.1. Pricing Analysis

        15.13.2. Market Share Analysis, 2023

            15.13.2.1. By Product Type

            15.13.2.2. By Application

    15.14. India

        15.14.1. Pricing Analysis

        15.14.2. Market Share Analysis, 2023

            15.14.2.1. By Product Type

            15.14.2.2. By Application

    15.15. Bangladesh

        15.15.1. Pricing Analysis

        15.15.2. Market Share Analysis, 2023

            15.15.2.1. By Product Type

            15.15.2.2. By Application

    15.16. Australia

        15.16.1. Pricing Analysis

        15.16.2. Market Share Analysis, 2023

            15.16.2.1. By Product Type

            15.16.2.2. By Application

    15.17. New Zealand

        15.17.1. Pricing Analysis

        15.17.2. Market Share Analysis, 2023

            15.17.2.1. By Product Type

            15.17.2.2. By Application

    15.18. China

        15.18.1. Pricing Analysis

        15.18.2. Market Share Analysis, 2023

            15.18.2.1. By Product Type

            15.18.2.2. By Application

    15.19. Japan

        15.19.1. Pricing Analysis

        15.19.2. Market Share Analysis, 2023

            15.19.2.1. By Product Type

            15.19.2.2. By Application

    15.20. South Korea

        15.20.1. Pricing Analysis

        15.20.2. Market Share Analysis, 2023

            15.20.2.1. By Product Type

            15.20.2.2. By Application

    15.21. GCC Countries

        15.21.1. Pricing Analysis

        15.21.2. Market Share Analysis, 2023

            15.21.2.1. By Product Type

            15.21.2.2. By Application

    15.22. South Africa

        15.22.1. Pricing Analysis

        15.22.2. Market Share Analysis, 2023

            15.22.2.1. By Product Type

            15.22.2.2. By Application

    15.23. Israel

        15.23.1. Pricing Analysis

        15.23.2. Market Share Analysis, 2023

            15.23.2.1. By Product Type

            15.23.2.2. By Application

16. Market Structure Analysis

    16.1. Competition Dashboard

    16.2. Competition Benchmarking

    16.3. Market Share Analysis of Top Players

        16.3.1. By Regional

        16.3.2. By Product Type

        16.3.3. By Application

17. Competition Analysis

    17.1. Competition Deep Dive

        17.1.1. Sappi Group

            17.1.1.1. Overview

            17.1.1.2. Product Portfolio

            17.1.1.3. Profitability by Market Segments

            17.1.1.4. Sales Footprint

            17.1.1.5. Strategy Overview

                17.1.1.5.1. Marketing Strategy

                17.1.1.5.2. Product Strategy

                17.1.1.5.3. Channel Strategy

        17.1.2. Birla Cellulose

            17.1.2.1. Overview

            17.1.2.2. Product Portfolio

            17.1.2.3. Profitability by Market Segments

            17.1.2.4. Sales Footprint

            17.1.2.5. Strategy Overview

                17.1.2.5.1. Marketing Strategy

                17.1.2.5.2. Product Strategy

                17.1.2.5.3. Channel Strategy

        17.1.3. Tembec Inc.

            17.1.3.1. Overview

            17.1.3.2. Product Portfolio

            17.1.3.3. Profitability by Market Segments

            17.1.3.4. Sales Footprint

            17.1.3.5. Strategy Overview

                17.1.3.5.1. Marketing Strategy

                17.1.3.5.2. Product Strategy

                17.1.3.5.3. Channel Strategy

        17.1.4. The Lenzing Group

            17.1.4.1. Overview

            17.1.4.2. Product Portfolio

            17.1.4.3. Profitability by Market Segments

            17.1.4.4. Sales Footprint

            17.1.4.5. Strategy Overview

                17.1.4.5.1. Marketing Strategy

                17.1.4.5.2. Product Strategy

                17.1.4.5.3. Channel Strategy

        17.1.5. Thai Rayon Public Co. Ltd.

            17.1.5.1. Overview

            17.1.5.2. Product Portfolio

            17.1.5.3. Profitability by Market Segments

            17.1.5.4. Sales Footprint

            17.1.5.5. Strategy Overview

                17.1.5.5.1. Marketing Strategy

                17.1.5.5.2. Product Strategy

                17.1.5.5.3. Channel Strategy

        17.1.6. Tangshan Sanyou Group Xingda Chemical Fiber Co. Ltd.

            17.1.6.1. Overview

            17.1.6.2. Product Portfolio

            17.1.6.3. Profitability by Market Segments

            17.1.6.4. Sales Footprint

            17.1.6.5. Strategy Overview

                17.1.6.5.1. Marketing Strategy

                17.1.6.5.2. Product Strategy

                17.1.6.5.3. Channel Strategy

        17.1.7. Ioncell

            17.1.7.1. Overview

            17.1.7.2. Product Portfolio

            17.1.7.3. Profitability by Market Segments

            17.1.7.4. Sales Footprint

            17.1.7.5. Strategy Overview

                17.1.7.5.1. Marketing Strategy

                17.1.7.5.2. Product Strategy

                17.1.7.5.3. Channel Strategy

        17.1.8. Bacterial Cellulose Solutions

            17.1.8.1. Overview

            17.1.8.2. Product Portfolio

            17.1.8.3. Profitability by Market Segments

            17.1.8.4. Sales Footprint

            17.1.8.5. Strategy Overview

                17.1.8.5.1. Marketing Strategy

                17.1.8.5.2. Product Strategy

                17.1.8.5.3. Channel Strategy

        17.1.9. Fulida Group Holding Co., LTD.

            17.1.9.1. Overview

            17.1.9.2. Product Portfolio

            17.1.9.3. Profitability by Market Segments

            17.1.9.4. Sales Footprint

            17.1.9.5. Strategy Overview

                17.1.9.5.1. Marketing Strategy

                17.1.9.5.2. Product Strategy

                17.1.9.5.3. Channel Strategy

        17.1.10. Manasi Aoyang Technology Co. Ltd.

            17.1.10.1. Overview

            17.1.10.2. Product Portfolio

            17.1.10.3. Profitability by Market Segments

            17.1.10.4. Sales Footprint

            17.1.10.5. Strategy Overview

                17.1.10.5.1. Marketing Strategy

                17.1.10.5.2. Product Strategy

                17.1.10.5.3. Channel Strategy

18. Assumptions & Acronyms Used

19. Research Methodology

List of Tables

Table 1: Global Market Value (US$ Million) Forecast by Region, 2019 to 2034

Table 2: Global Market Volume (Tons) Forecast by Region, 2019 to 2034

Table 3: Global Market Value (US$ Million) Forecast by Product Type, 2019 to 2034

Table 4: Global Market Volume (Tons) Forecast by Product Type, 2019 to 2034

Table 5: Global Market Value (US$ Million) Forecast by Application, 2019 to 2034

Table 6: Global Market Volume (Tons) Forecast by Application, 2019 to 2034

Table 7: North America Market Value (US$ Million) Forecast by Country, 2019 to 2034

Table 8: North America Market Volume (Tons) Forecast by Country, 2019 to 2034

Table 9: North America Market Value (US$ Million) Forecast by Product Type, 2019 to 2034

Table 10: North America Market Volume (Tons) Forecast by Product Type, 2019 to 2034

Table 11: North America Market Value (US$ Million) Forecast by Application, 2019 to 2034

Table 12: North America Market Volume (Tons) Forecast by Application, 2019 to 2034

Table 13: Latin America Market Value (US$ Million) Forecast by Country, 2019 to 2034

Table 14: Latin America Market Volume (Tons) Forecast by Country, 2019 to 2034

Table 15: Latin America Market Value (US$ Million) Forecast by Product Type, 2019 to 2034

Table 16: Latin America Market Volume (Tons) Forecast by Product Type, 2019 to 2034

Table 17: Latin America Market Value (US$ Million) Forecast by Application, 2019 to 2034

Table 18: Latin America Market Volume (Tons) Forecast by Application, 2019 to 2034

Table 19: Western Europe Market Value (US$ Million) Forecast by Country, 2019 to 2034

Table 20: Western Europe Market Volume (Tons) Forecast by Country, 2019 to 2034

Table 21: Western Europe Market Value (US$ Million) Forecast by Product Type, 2019 to 2034

Table 22: Western Europe Market Volume (Tons) Forecast by Product Type, 2019 to 2034

Table 23: Western Europe Market Value (US$ Million) Forecast by Application, 2019 to 2034

Table 24: Western Europe Market Volume (Tons) Forecast by Application, 2019 to 2034

Table 25: Eastern Europe Market Value (US$ Million) Forecast by Country, 2019 to 2034

Table 26: Eastern Europe Market Volume (Tons) Forecast by Country, 2019 to 2034

Table 27: Eastern Europe Market Value (US$ Million) Forecast by Product Type, 2019 to 2034

Table 28: Eastern Europe Market Volume (Tons) Forecast by Product Type, 2019 to 2034

Table 29: Eastern Europe Market Value (US$ Million) Forecast by Application, 2019 to 2034

Table 30: Eastern Europe Market Volume (Tons) Forecast by Application, 2019 to 2034

Table 31: South Asia and Pacific Market Value (US$ Million) Forecast by Country, 2019 to 2034

Table 32: South Asia and Pacific Market Volume (Tons) Forecast by Country, 2019 to 2034

Table 33: South Asia and Pacific Market Value (US$ Million) Forecast by Product Type, 2019 to 2034

Table 34: South Asia and Pacific Market Volume (Tons) Forecast by Product Type, 2019 to 2034

Table 35: South Asia and Pacific Market Value (US$ Million) Forecast by Application, 2019 to 2034

Table 36: South Asia and Pacific Market Volume (Tons) Forecast by Application, 2019 to 2034

Table 37: East Asia Market Value (US$ Million) Forecast by Country, 2019 to 2034

Table 38: East Asia Market Volume (Tons) Forecast by Country, 2019 to 2034

Table 39: East Asia Market Value (US$ Million) Forecast by Product Type, 2019 to 2034

Table 40: East Asia Market Volume (Tons) Forecast by Product Type, 2019 to 2034

Table 41: East Asia Market Value (US$ Million) Forecast by Application, 2019 to 2034

Table 42: East Asia Market Volume (Tons) Forecast by Application, 2019 to 2034

Table 43: Middle East and Africa Market Value (US$ Million) Forecast by Country, 2019 to 2034

Table 44: Middle East and Africa Market Volume (Tons) Forecast by Country, 2019 to 2034

Table 45: Middle East and Africa Market Value (US$ Million) Forecast by Product Type, 2019 to 2034

Table 46: Middle East and Africa Market Volume (Tons) Forecast by Product Type, 2019 to 2034

Table 47: Middle East and Africa Market Value (US$ Million) Forecast by Application, 2019 to 2034

Table 48: Middle East and Africa Market Volume (Tons) Forecast by Application, 2019 to 2034

List of Charts

Figure 1: Global Market Value (US$ Million) by Product Type, 2024 to 2034

Figure 2: Global Market Value (US$ Million) by Application, 2024 to 2034

Figure 3: Global Market Value (US$ Million) by Region, 2024 to 2034

Figure 4: Global Market Value (US$ Million) Analysis by Region, 2019 to 2034

Figure 5: Global Market Volume (Tons) Analysis by Region, 2019 to 2034

Figure 6: Global Market Value Share (%) and BPS Analysis by Region, 2024 to 2034

Figure 7: Global Market Y-o-Y Growth (%) Projections by Region, 2024 to 2034

Figure 8: Global Market Value (US$ Million) Analysis by Product Type, 2019 to 2034

Figure 9: Global Market Volume (Tons) Analysis by Product Type, 2019 to 2034

Figure 10: Global Market Value Share (%) and BPS Analysis by Product Type, 2024 to 2034

Figure 11: Global Market Y-o-Y Growth (%) Projections by Product Type, 2024 to 2034

Figure 12: Global Market Value (US$ Million) Analysis by Application, 2019 to 2034

Figure 13: Global Market Volume (Tons) Analysis by Application, 2019 to 2034

Figure 14: Global Market Value Share (%) and BPS Analysis by Application, 2024 to 2034

Figure 15: Global Market Y-o-Y Growth (%) Projections by Application, 2024 to 2034

Figure 16: Global Market Attractiveness by Product Type, 2024 to 2034

Figure 17: Global Market Attractiveness by Application, 2024 to 2034

Figure 18: Global Market Attractiveness by Region, 2024 to 2034

Figure 19: North America Market Value (US$ Million) by Product Type, 2024 to 2034

Figure 20: North America Market Value (US$ Million) by Application, 2024 to 2034

Figure 21: North America Market Value (US$ Million) by Country, 2024 to 2034

Figure 22: North America Market Value (US$ Million) Analysis by Country, 2019 to 2034

Figure 23: North America Market Volume (Tons) Analysis by Country, 2019 to 2034

Figure 24: North America Market Value Share (%) and BPS Analysis by Country, 2024 to 2034

Figure 25: North America Market Y-o-Y Growth (%) Projections by Country, 2024 to 2034

Figure 26: North America Market Value (US$ Million) Analysis by Product Type, 2019 to 2034

Figure 27: North America Market Volume (Tons) Analysis by Product Type, 2019 to 2034

Figure 28: North America Market Value Share (%) and BPS Analysis by Product Type, 2024 to 2034

Figure 29: North America Market Y-o-Y Growth (%) Projections by Product Type, 2024 to 2034

Figure 30: North America Market Value (US$ Million) Analysis by Application, 2019 to 2034

Figure 31: North America Market Volume (Tons) Analysis by Application, 2019 to 2034

Figure 32: North America Market Value Share (%) and BPS Analysis by Application, 2024 to 2034

Figure 33: North America Market Y-o-Y Growth (%) Projections by Application, 2024 to 2034

Figure 34: North America Market Attractiveness by Product Type, 2024 to 2034

Figure 35: North America Market Attractiveness by Application, 2024 to 2034

Figure 36: North America Market Attractiveness by Country, 2024 to 2034

Figure 37: Latin America Market Value (US$ Million) by Product Type, 2024 to 2034

Figure 38: Latin America Market Value (US$ Million) by Application, 2024 to 2034

Figure 39: Latin America Market Value (US$ Million) by Country, 2024 to 2034

Figure 40: Latin America Market Value (US$ Million) Analysis by Country, 2019 to 2034

Figure 41: Latin America Market Volume (Tons) Analysis by Country, 2019 to 2034

Figure 42: Latin America Market Value Share (%) and BPS Analysis by Country, 2024 to 2034

Figure 43: Latin America Market Y-o-Y Growth (%) Projections by Country, 2024 to 2034

Figure 44: Latin America Market Value (US$ Million) Analysis by Product Type, 2019 to 2034

Figure 45: Latin America Market Volume (Tons) Analysis by Product Type, 2019 to 2034

Figure 46: Latin America Market Value Share (%) and BPS Analysis by Product Type, 2024 to 2034

Figure 47: Latin America Market Y-o-Y Growth (%) Projections by Product Type, 2024 to 2034

Figure 48: Latin America Market Value (US$ Million) Analysis by Application, 2019 to 2034

Figure 49: Latin America Market Volume (Tons) Analysis by Application, 2019 to 2034

Figure 50: Latin America Market Value Share (%) and BPS Analysis by Application, 2024 to 2034

Figure 51: Latin America Market Y-o-Y Growth (%) Projections by Application, 2024 to 2034

Figure 52: Latin America Market Attractiveness by Product Type, 2024 to 2034

Figure 53: Latin America Market Attractiveness by Application, 2024 to 2034

Figure 54: Latin America Market Attractiveness by Country, 2024 to 2034

Figure 55: Western Europe Market Value (US$ Million) by Product Type, 2024 to 2034

Figure 56: Western Europe Market Value (US$ Million) by Application, 2024 to 2034

Figure 57: Western Europe Market Value (US$ Million) by Country, 2024 to 2034

Figure 58: Western Europe Market Value (US$ Million) Analysis by Country, 2019 to 2034

Figure 59: Western Europe Market Volume (Tons) Analysis by Country, 2019 to 2034

Figure 60: Western Europe Market Value Share (%) and BPS Analysis by Country, 2024 to 2034

Figure 61: Western Europe Market Y-o-Y Growth (%) Projections by Country, 2024 to 2034

Figure 62: Western Europe Market Value (US$ Million) Analysis by Product Type, 2019 to 2034

Figure 63: Western Europe Market Volume (Tons) Analysis by Product Type, 2019 to 2034

Figure 64: Western Europe Market Value Share (%) and BPS Analysis by Product Type, 2024 to 2034

Figure 65: Western Europe Market Y-o-Y Growth (%) Projections by Product Type, 2024 to 2034

Figure 66: Western Europe Market Value (US$ Million) Analysis by Application, 2019 to 2034

Figure 67: Western Europe Market Volume (Tons) Analysis by Application, 2019 to 2034

Figure 68: Western Europe Market Value Share (%) and BPS Analysis by Application, 2024 to 2034

Figure 69: Western Europe Market Y-o-Y Growth (%) Projections by Application, 2024 to 2034

Figure 70: Western Europe Market Attractiveness by Product Type, 2024 to 2034

Figure 71: Western Europe Market Attractiveness by Application, 2024 to 2034

Figure 72: Western Europe Market Attractiveness by Country, 2024 to 2034

Figure 73: Eastern Europe Market Value (US$ Million) by Product Type, 2024 to 2034

Figure 74: Eastern Europe Market Value (US$ Million) by Application, 2024 to 2034

Figure 75: Eastern Europe Market Value (US$ Million) by Country, 2024 to 2034

Figure 76: Eastern Europe Market Value (US$ Million) Analysis by Country, 2019 to 2034

Figure 77: Eastern Europe Market Volume (Tons) Analysis by Country, 2019 to 2034

Figure 78: Eastern Europe Market Value Share (%) and BPS Analysis by Country, 2024 to 2034

Figure 79: Eastern Europe Market Y-o-Y Growth (%) Projections by Country, 2024 to 2034

Figure 80: Eastern Europe Market Value (US$ Million) Analysis by Product Type, 2019 to 2034

Figure 81: Eastern Europe Market Volume (Tons) Analysis by Product Type, 2019 to 2034

Figure 82: Eastern Europe Market Value Share (%) and BPS Analysis by Product Type, 2024 to 2034

Figure 83: Eastern Europe Market Y-o-Y Growth (%) Projections by Product Type, 2024 to 2034

Figure 84: Eastern Europe Market Value (US$ Million) Analysis by Application, 2019 to 2034

Figure 85: Eastern Europe Market Volume (Tons) Analysis by Application, 2019 to 2034

Figure 86: Eastern Europe Market Value Share (%) and BPS Analysis by Application, 2024 to 2034

Figure 87: Eastern Europe Market Y-o-Y Growth (%) Projections by Application, 2024 to 2034

Figure 88: Eastern Europe Market Attractiveness by Product Type, 2024 to 2034

Figure 89: Eastern Europe Market Attractiveness by Application, 2024 to 2034

Figure 90: Eastern Europe Market Attractiveness by Country, 2024 to 2034

Figure 91: South Asia and Pacific Market Value (US$ Million) by Product Type, 2024 to 2034

Figure 92: South Asia and Pacific Market Value (US$ Million) by Application, 2024 to 2034

Figure 93: South Asia and Pacific Market Value (US$ Million) by Country, 2024 to 2034

Figure 94: South Asia and Pacific Market Value (US$ Million) Analysis by Country, 2019 to 2034

Figure 95: South Asia and Pacific Market Volume (Tons) Analysis by Country, 2019 to 2034

Figure 96: South Asia and Pacific Market Value Share (%) and BPS Analysis by Country, 2024 to 2034

Figure 97: South Asia and Pacific Market Y-o-Y Growth (%) Projections by Country, 2024 to 2034

Figure 98: South Asia and Pacific Market Value (US$ Million) Analysis by Product Type, 2019 to 2034

Figure 99: South Asia and Pacific Market Volume (Tons) Analysis by Product Type, 2019 to 2034

Figure 100: South Asia and Pacific Market Value Share (%) and BPS Analysis by Product Type, 2024 to 2034

Figure 101: South Asia and Pacific Market Y-o-Y Growth (%) Projections by Product Type, 2024 to 2034

Figure 102: South Asia and Pacific Market Value (US$ Million) Analysis by Application, 2019 to 2034

Figure 103: South Asia and Pacific Market Volume (Tons) Analysis by Application, 2019 to 2034

Figure 104: South Asia and Pacific Market Value Share (%) and BPS Analysis by Application, 2024 to 2034

Figure 105: South Asia and Pacific Market Y-o-Y Growth (%) Projections by Application, 2024 to 2034

Figure 106: South Asia and Pacific Market Attractiveness by Product Type, 2024 to 2034

Figure 107: South Asia and Pacific Market Attractiveness by Application, 2024 to 2034

Figure 108: South Asia and Pacific Market Attractiveness by Country, 2024 to 2034

Figure 109: East Asia Market Value (US$ Million) by Product Type, 2024 to 2034

Figure 110: East Asia Market Value (US$ Million) by Application, 2024 to 2034

Figure 111: East Asia Market Value (US$ Million) by Country, 2024 to 2034

Figure 112: East Asia Market Value (US$ Million) Analysis by Country, 2019 to 2034

Figure 113: East Asia Market Volume (Tons) Analysis by Country, 2019 to 2034

Figure 114: East Asia Market Value Share (%) and BPS Analysis by Country, 2024 to 2034

Figure 115: East Asia Market Y-o-Y Growth (%) Projections by Country, 2024 to 2034

Figure 116: East Asia Market Value (US$ Million) Analysis by Product Type, 2019 to 2034

Figure 117: East Asia Market Volume (Tons) Analysis by Product Type, 2019 to 2034

Figure 118: East Asia Market Value Share (%) and BPS Analysis by Product Type, 2024 to 2034

Figure 119: East Asia Market Y-o-Y Growth (%) Projections by Product Type, 2024 to 2034

Figure 120: East Asia Market Value (US$ Million) Analysis by Application, 2019 to 2034

Figure 121: East Asia Market Volume (Tons) Analysis by Application, 2019 to 2034

Figure 122: East Asia Market Value Share (%) and BPS Analysis by Application, 2024 to 2034

Figure 123: East Asia Market Y-o-Y Growth (%) Projections by Application, 2024 to 2034

Figure 124: East Asia Market Attractiveness by Product Type, 2024 to 2034

Figure 125: East Asia Market Attractiveness by Application, 2024 to 2034

Figure 126: East Asia Market Attractiveness by Country, 2024 to 2034

Figure 127: Middle East and Africa Market Value (US$ Million) by Product Type, 2024 to 2034

Figure 128: Middle East and Africa Market Value (US$ Million) by Application, 2024 to 2034

Figure 129: Middle East and Africa Market Value (US$ Million) by Country, 2024 to 2034

Figure 130: Middle East and Africa Market Value (US$ Million) Analysis by Country, 2019 to 2034

Figure 131: Middle East and Africa Market Volume (Tons) Analysis by Country, 2019 to 2034

Figure 132: Middle East and Africa Market Value Share (%) and BPS Analysis by Country, 2024 to 2034

Figure 133: Middle East and Africa Market Y-o-Y Growth (%) Projections by Country, 2024 to 2034

Figure 134: Middle East and Africa Market Value (US$ Million) Analysis by Product Type, 2019 to 2034

Figure 135: Middle East and Africa Market Volume (Tons) Analysis by Product Type, 2019 to 2034

Figure 136: Middle East and Africa Market Value Share (%) and BPS Analysis by Product Type, 2024 to 2034

Figure 137: Middle East and Africa Market Y-o-Y Growth (%) Projections by Product Type, 2024 to 2034

Figure 138: Middle East and Africa Market Value (US$ Million) Analysis by Application, 2019 to 2034

Figure 139: Middle East and Africa Market Volume (Tons) Analysis by Application, 2019 to 2034

Figure 140: Middle East and Africa Market Value Share (%) and BPS Analysis by Application, 2024 to 2034

Figure 141: Middle East and Africa Market Y-o-Y Growth (%) Projections by Application, 2024 to 2034

Figure 142: Middle East and Africa Market Attractiveness by Product Type, 2024 to 2034

Figure 143: Middle East and Africa Market Attractiveness by Application, 2024 to 2034

Figure 144: Middle East and Africa Market Attractiveness by Country, 2024 to 2034

Recommendations

Packaging

Fiber Based Packaging Market

Published : March 2024

Packaging

Cellulose Film Packaging Market

Published : January 2024

Explore Packaging Insights

View Reports