Powdered Cellulose Market Forecast and Outlook 2025 to 2035

The global powdered cellulose market is valued at USD 202.8 million in 2025 and is anticipated to reach USD 327.2 million by 2035, recording an absolute increase of USD 124.4 million over the forecast period. This translates into a total growth of 61.3%, with the market forecast to expand at a compound annual growth rate (CAGR) of 4.9% between 2025 and 2035.
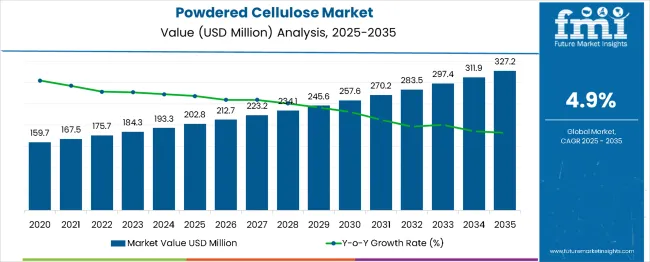
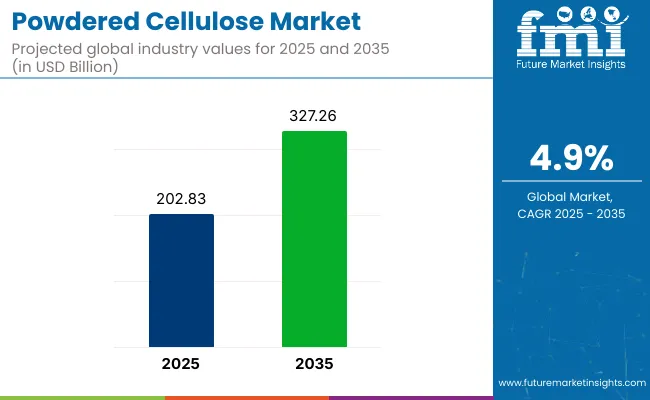
Powdered Cellulose Market Value Analysis

Quick Stats for Powdered Cellulose Market

  • Powdered Cellulose Market Value (2025): USD 202.8 million
  • Powdered Cellulose Market Forecast Value (2035): USD 327.2 million
  • Powdered Cellulose Market Forecast CAGR: 4.9%
  • Leading Grade in Powdered Cellulose Market: Food Grade (40.0%)
  • Key Growth Regions in Powdered Cellulose Market: Asia Pacific, North America, and Europe
  • Key Players in Powdered Cellulose Market: JRS Pharma, Asahi Kasei, IFF (DuPont Nutrition & Biosciences), Ingredion, Ashland Global Specialty Chemicals, Daicel Corporation, Lenzing AG, Nippon Paper Industries, Sappi Limited, Domsjö Fabriker

Powdered Cellulose Market

Powdered Cellulose Market Key Takeaways

Metric Value
Estimated Value in (2025E) USD 202.8 million
Forecast Value in (2035F) USD 327.2 million
Forecast CAGR (2025 to 2035) 4.9%

The overall market size is expected to grow by nearly 1.61X during the same period, supported by increasing demand for natural food additives, growing pharmaceutical excipient applications, and rising adoption of cellulose-based ingredients in clean-label formulations across diverse industrial applications.

Between 2025 and 2030, the powdered cellulose market is projected to expand from USD 202.8 million to USD 257.8 million, resulting in a value increase of USD 55.0 million, which represents 44.2% of the total forecast growth for the decade. This phase of development will be shaped by increasing demand for clean-label food ingredients, rising pharmaceutical excipient requirements, and growing adoption of natural additives in processed food manufacturing. Food manufacturers and pharmaceutical companies are expanding their powdered cellulose utilization to address consumer preferences for natural ingredients and regulatory requirements for safe food additives.

From 2030 to 2035, the market is forecast to grow from USD 257.8 million to USD 327.2 million, adding another USD 69.4 million, which constitutes 55.8% of the overall ten-year expansion. This period is expected to be characterized by the expansion of pharmaceutical-grade applications, the integration of sustainable sourcing practices, and the development of specialized cellulose formulations for advanced industrial applications. The growing emphasis on biodegradable and environmentally friendly ingredients will drive demand for powdered cellulose products derived from sustainable raw materials with enhanced functional properties.

Between 2020 and 2024, the powdered cellulose market experienced steady growth, driven by increasing consumer demand for natural food additives and growing recognition of cellulose's functional benefits as a texturing agent, anti-caking additive, and dietary fiber source. The market developed as food manufacturers recognized the potential for powdered cellulose to improve product texture while meeting clean-label requirements. Technological advancement in processing methods and particle size optimization began emphasizing the critical importance of maintaining functional properties while ensuring food safety and regulatory compliance.

Opportunity Pathways- Powdered Cellulose Market

The coming years are transformative for powdered cellulose. As consumers and regulators push for more natural, sustainable, and health-oriented ingredients, powdered cellulose stands to benefit as a functional, plant-based additive in multiple sectors.

Food & beverage formulators want thickeners, stabilizers, and bulking agents that are clean-label and non-allergenic; pharmaceutical and supplement makers need reliable excipients; personal care brands seek hypoallergenic, plant-derived alternatives; and industrial users demand moisture control, film formation, and binding properties with low environmental impact.

Technological improvements in processing, particle sizing, source variations (non-wood fibers), and cost reduction will amplify uptake. Emerging markets will contribute disproportionately to growth as incomes rise, regulation aligns, and localized production becomes feasible. Regulatory drivers around health (e.g. fiber, reducing synthetic additives) and sustainability (carbon footprint, deforestation) will further push demand.

Why is the Powdered Cellulose Market Growing?

Market expansion is being supported by the increasing global demand for natural and clean-label ingredients and the corresponding shift away from synthetic additives that can provide similar functional benefits while meeting consumer preferences for recognizable and natural food components.

Modern food and pharmaceutical manufacturers are increasingly focused on incorporating powdered cellulose to enhance product functionality while satisfying regulatory requirements and consumer expectations for natural ingredient formulations. Powdered cellulose's proven ability to deliver texture improvement, moisture control, and anti-caking properties makes it an essential ingredient for clean-label product development and functional food applications.

The growing emphasis on pharmaceutical excipient applications is driving demand for high-purity powdered cellulose that can support tablet manufacturing, controlled-release formulations, and specialized drug delivery systems. Manufacturer preference for ingredients that combine functional versatility with regulatory acceptance is creating opportunities for innovative powdered cellulose implementations across pharmaceutical, food, and industrial applications.

The rising influence of sustainability trends and biodegradable material requirements is also contributing to increased adoption of cellulose-based products that can provide environmentally friendly alternatives to synthetic additives.

Segmental Analysis

The market is segmented by grade, source, end-use industry, and region. By grade, the market is divided into food grade, pharmaceutical grade, and industrial grade. Based on the source, the market is categorized into soft & hard wood pulp, cotton linter pulp, bamboo, wheat straw pulp, and other sources.

By end-use industry, the market includes food & beverage, pharmaceuticals, cosmetics, construction industry, chemical industry, leather industry, textile industry, paper industry, and others. Regionally, the market is divided into North America, Europe, East Asia, South Asia & Pacific, Latin America, and the Middle East & Africa.
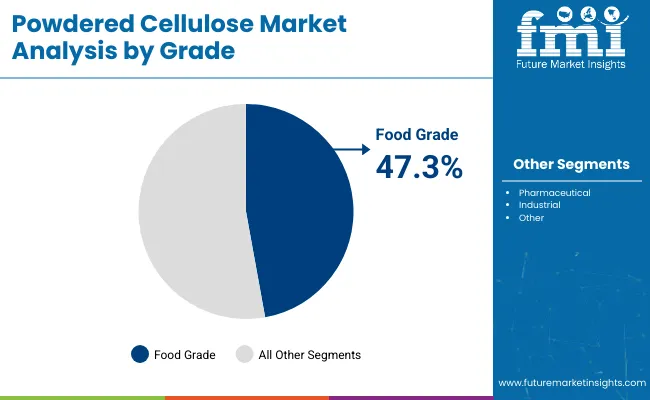
By Grade, Food Grade Segment Accounts for 40.0% Market Share

Powdered Cellulose Market By Grade

The food-grade segment is projected to account for 40.0% of the powdered cellulose market in 2025, reaffirming its position as the leading grade category. Food manufacturers increasingly utilize food-grade powdered cellulose for its excellent anti-caking properties, texture enhancement capabilities, and ability to function as a natural dietary fiber additive while meeting strict food safety regulations. Food-grade cellulose technology's regulatory approval and consumer acceptance directly address the industry requirements for clean-label formulations and natural ingredient positioning.

This grade segment forms the foundation of modern food additive applications, as it represents the category with the greatest regulatory approval and established safety profile across multiple food product categories. Manufacturer investments in purity enhancement and particle size optimization continue to strengthen adoption among food processors.

With food companies prioritizing clean-label positioning and natural ingredients, food-grade powdered cellulose aligns with both consumer preferences and regulatory compliance objectives, making it the central component of comprehensive natural food additive strategies.
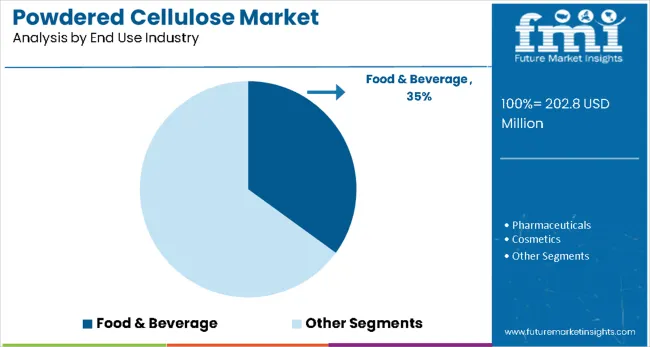
By End-Use Industry, the Food & Beverage Segment Accounts for 35.0% Market Share

Powdered Cellulose Market By End Use Industry

Food & beverage applications are projected to represent 35.0% of powdered cellulose demand in 2025, underscoring their critical role as the primary industrial application for cellulose-based functional additives. Food manufacturers prefer powdered cellulose for its versatile functionality, natural origin, and ability to improve product texture while reducing fat content and enhancing dietary fiber profiles. Positioned as essential ingredients for modern food processing, powdered cellulose offers both functional advantages and clean-label benefits.

The segment is supported by continuous innovation in food formulation technologies and the growing availability of specialized cellulose grades that enable optimized performance in specific food applications. Additionally, food manufacturers are investing in natural ingredient sourcing to support clean-label product development and consumer health positioning.

As natural ingredient demand continues to grow and functional food requirements increase, food & beverage applications will continue to dominate the end-use market while supporting advanced formulation capabilities and health-conscious product development.

What are the Drivers, Restraints, and Key Trends of the Powdered Cellulose Market?

The powdered cellulose market is advancing steadily due to increasing consumer demand for natural food ingredients and growing adoption of cellulose-based excipients in pharmaceutical formulations that provide functional benefits while meeting clean-label and regulatory requirements.

However, the market faces challenges, including raw material price volatility, complex processing requirements for pharmaceutical grades, and competition from alternative natural additives. Innovation in sustainable sourcing and specialized processing technologies continues to influence product development and market expansion patterns.

Expansion of Pharmaceutical Applications

The growing adoption of powdered cellulose in pharmaceutical excipient applications is enabling drug manufacturers to develop tablets, capsules, and controlled-release formulations with improved stability, bioavailability, and manufacturing efficiency.

Pharmaceutical applications provide enhanced product functionality while allowing more sophisticated drug delivery systems across various therapeutic areas and dosage forms. Pharmaceutical companies are increasingly recognizing the competitive advantages of cellulose-based excipients for regulatory compliance and product performance optimization.

Integration of Sustainable Sourcing Practices

Modern powdered cellulose producers are incorporating sustainable raw material sourcing, renewable resource utilization, and environmentally responsible processing methods to enhance product positioning and meet growing demand for eco-friendly ingredients.

These practices improve brand differentiation while enabling new applications, including organic and sustainable product certifications. Advanced sustainability integration also allows manufacturers to support premium market positioning and corporate responsibility objectives beyond traditional cellulose production methods.
Analysis of the Powdered Cellulose Market by Key Country

Powdered Cellulose Market Country Wise Analysis

Country CAGR (2025 to 2035)
India 7.2%
China 6.3%
USA 5.8%
Germany 5.1%
South Korea 5.0%
Japan 4.6%
Spain 4.4%

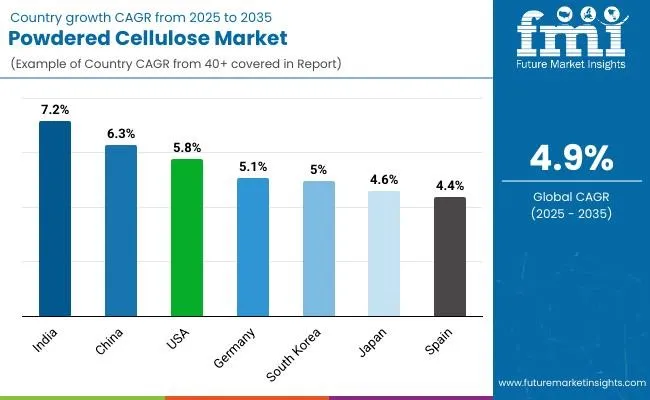
The powdered cellulose market is experiencing robust growth globally, with India leading at a 7.2% CAGR through 2035, driven by the expanding food processing industry, the growing pharmaceutical manufacturing sector, and the increasing adoption of natural food additives in processed food production. China follows at 6.3%, supported by large-scale manufacturing capabilities, growing consumer health awareness, and an expanding pharmaceutical industry.

The USA shows growth at 5.8%, emphasizing clean-label food trends and advanced pharmaceutical applications. Germany records 5.1%, focusing on high-quality pharmaceutical excipients and premium food ingredients. South Korea demonstrates 5.0% growth, prioritizing natural food additive adoption and pharmaceutical market development.

Japan exhibits 4.6% growth, supported by advanced food technology and pharmaceutical innovation. Spain shows 4.4% growth, emphasizing food processing modernization and natural ingredient adoption.

The report covers an in-depth analysis of 40+ countries; seven top-performing countries are highlighted below.

India Leads Global Market Growth with Food Processing Expansion

Revenue from powdered cellulose in India is projected to exhibit exceptional growth with a CAGR of 7.2% through 2035, driven by the rapidly expanding food processing industry and increasing consumer demand for processed foods with natural additives.

The country's growing pharmaceutical manufacturing sector and government support for food processing development are creating substantial demand for high-quality cellulose products. Major food manufacturers and pharmaceutical companies are establishing comprehensive sourcing strategies to serve both domestic consumption and export market requirements.

  • Rising food processing industry development and expanding pharmaceutical manufacturing are driving demand for food-grade and pharmaceutical-grade powdered cellulose across commercial food producers, pharmaceutical companies, and specialty ingredient suppliers throughout India.
  • Strong economic growth and increasing health consciousness are supporting the adoption of natural food additives among manufacturers seeking to meet consumer preferences for clean-label products and functional food ingredients.

China Demonstrates Strong Market Potential with Manufacturing Scale

Revenue from powdered cellulose in China is expanding at a CAGR of 6.3%, supported by large-scale manufacturing infrastructure, growing health awareness among consumers, and the expanding pharmaceutical industry requiring high-quality excipients.

The country's comprehensive supply chain capabilities and cost-effective production methods are driving demand for diverse cellulose applications. International ingredient companies and domestic manufacturers are establishing extensive production and distribution capabilities to address growing domestic and export market demand.

  • Rising pharmaceutical industry development and expanding food processing sector are creating opportunities for powdered cellulose adoption across pharmaceutical manufacturers, food processors, and specialty chemical companies in major industrial regions throughout China.
  • Growing consumer health consciousness and government food safety initiatives are driving the adoption of natural food additives among manufacturers seeking to meet regulatory requirements and consumer expectations for safe and natural ingredients.

USA Maintains Strong Position with Clean-Label Innovation

Revenue from powdered cellulose in the USA is projected to grow at a CAGR of 5.8% through 2035, driven by established clean-label food trends, the advanced pharmaceutical industry, and consumer preference for natural and functional ingredients.

The country's sophisticated regulatory environment and innovation capabilities are creating substantial demand for high-quality cellulose products across food and pharmaceutical applications. Leading ingredient companies and food manufacturers are establishing comprehensive product portfolios to serve evolving market requirements.

  • Strong clean-label trends and natural ingredient preferences are driving demand for food-grade powdered cellulose across food manufacturers, specialty ingredient suppliers, and health-focused food companies seeking to meet consumer expectations for natural products.
  • Advanced pharmaceutical industry and regulatory expertise are supporting the adoption of pharmaceutical-grade cellulose excipients among drug manufacturers seeking to enhance product performance and regulatory compliance.

Germany Anchors Growth with Quality Standards Excellence

Revenue from powdered cellulose in Germany is projected to grow at a CAGR of 5.1% through 2035, supported by the advanced pharmaceutical industry, stringent quality standards, and established food ingredient manufacturing capabilities.

German manufacturers prioritize product quality, regulatory compliance, and technical innovation, making powdered cellulose essential for both pharmaceutical excipients and premium food applications. The country's export-oriented approach continues to drive market development and quality enhancement initiatives.

  • Advanced pharmaceutical manufacturing and quality standards excellence are driving demand for high-purity pharmaceutical-grade cellulose across drug manufacturers, contract manufacturers, and specialty pharmaceutical companies throughout Germany.
  • Strong food ingredient industry and export capabilities are supporting the adoption of premium food-grade cellulose products among food manufacturers seeking to meet international quality standards and regulatory requirements.

South Korea Focuses on Natural Ingredient Development

Revenue from powdered cellulose in South Korea is projected to grow at a CAGR of 5.0% through 2035, supported by the expanding food processing industry, the growing pharmaceutical sector, and increasing consumer awareness of natural ingredient benefits.

The country's abundant raw material resources and developing manufacturing capabilities are creating opportunities for cellulose market expansion. Food manufacturers and pharmaceutical companies are investing in natural ingredient adoption to meet evolving consumer preferences.

  • Expanding food processing industry and growing health consciousness are driving demand for natural food additives, including powdered cellulose, across food manufacturers, beverage producers, and specialty food companies throughout South Korea.
  • Growing pharmaceutical industry and increasing healthcare access are supporting the adoption of cellulose-based excipients among pharmaceutical manufacturers seeking cost-effective and reliable ingredient solutions.

Japan Demonstrates Innovation with Advanced Applications

Revenue from powdered cellulose in Japan is projected to grow at a CAGR of 4.6% through 2035, supported by advanced food technology, innovative pharmaceutical applications, and sophisticated consumer preferences for high-quality ingredients.

Japanese manufacturers' focus on precision and quality creates steady demand for premium cellulose products across both food and pharmaceutical sectors. The country's technical expertise drives continuous innovation in cellulose applications and processing methods.

  • Advanced food technology and innovation capabilities are driving demand for specialized powdered cellulose products across food manufacturers, ingredient suppliers, and research institutions seeking enhanced functional properties and application performance.
  • Sophisticated pharmaceutical industry and regulatory expertise are supporting the adoption of high-quality pharmaceutical-grade cellulose among drug manufacturers focusing on advanced formulation technologies and product optimization.

Spain Strengthens Market with Food Processing Modernization

Revenue from powdered cellulose in Spain is projected to grow at a CAGR of 4.4% through 2035, supported by food processing industry modernization, growing natural ingredient adoption, and expanding pharmaceutical manufacturing capabilities. Spanish food manufacturers are increasingly incorporating natural additives to meet consumer demands for clean-label products and improved nutritional profiles. The country's strategic location supports both domestic consumption and export market development.
  • Food processing modernization and natural ingredient trends are driving demand for food-grade powdered cellulose across food manufacturers, specialty ingredient suppliers, and export-oriented food companies throughout Spain.
  • Growing pharmaceutical manufacturing and healthcare industry development are supporting the adoption of cellulose-based excipients among pharmaceutical companies seeking reliable and cost-effective ingredient solutions for domestic and international markets.

Europe Market Split by Country

Europe Powdered Cellulose Market

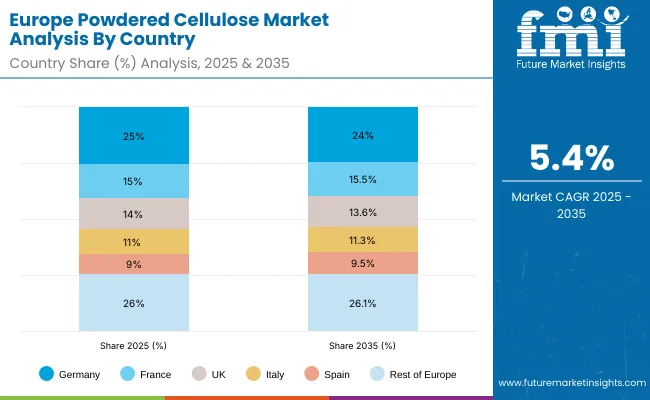
The powdered cellulose market in Europe is projected to grow from USD 40.4 million in 2025 to USD 65.3 million by 2035, registering a CAGR of 4.9% over the forecast period. Germany is expected to maintain its leadership position with a 25.0% market share in 2025, declining slightly to 24.0% by 2035, supported by its strong pharmaceutical formulation industry, advanced food ingredient manufacturing base, and comprehensive quality assurance capabilities serving European and international markets.

France follows with a 15.0% share in 2025, projected to reach 15.5% by 2035, driven by bakery and confectionery innovations, growing specialty food ingredient adoption, and an established pharmaceutical industry requiring high-quality excipients. The United Kingdom holds a 14.0% share in 2025, expected to decrease to 13.6% by 2035, supported by clean-label food trends and pharmaceutical applications but facing challenges from regulatory alignment and post-Brexit trade dynamics.

Italy commands an 11.0% share in 2025, projected to reach 11.3% by 2035, while Spain accounts for 9.0% in 2025, expected to reach 9.5% by 2035. The Netherlands maintains a 4.0% share in 2025, growing to 4.2% by 2035. The Rest of Europe region, including Nordic countries, Eastern Europe, Portugal, Belgium, Switzerland, and Austria, is anticipated to hold 26.0% in 2025, maintaining 26.1% by 2035, attributed to expanding manufacturing capabilities in Eastern European markets, balanced by stabilizing demand in some Western European countries implementing advanced food processing and pharmaceutical manufacturing programs.
Competitive Landscape of the Powdered Cellulose Market

Powdered Cellulose Market By Company

The powdered cellulose market is characterized by competition among established specialty chemical companies, pharmaceutical excipient manufacturers, and integrated cellulose processors. Companies are investing in processing technology research, quality standardization programs, sustainable sourcing initiatives, and comprehensive regulatory compliance to deliver consistent, high-purity, and functionally optimized powdered cellulose products. Innovation in particle size control, surface modification, and application-specific formulations is central to strengthening market position and customer satisfaction.

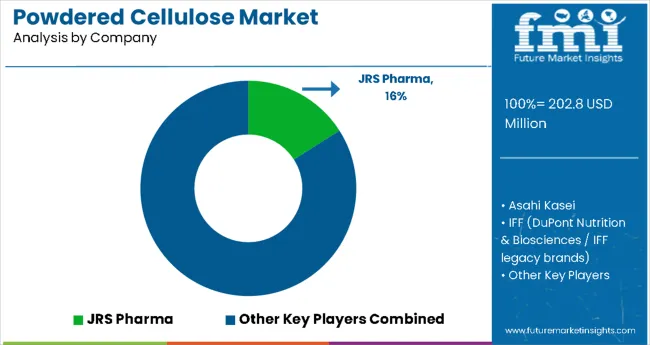
JRS Pharma leads the market with a strong focus on pharmaceutical excipients and functional food ingredients, offering comprehensive cellulose solutions with emphasis on quality assurance and regulatory compliance. Asahi Kasei provides integrated chemical solutions with a focus on advanced processing technologies and global distribution capabilities.

IFF (DuPont Nutrition & Biosciences) delivers innovative ingredient solutions with a focus on food applications and nutritional enhancement. Ingredion focuses on food ingredient development with emphasis on functionality and clean-label positioning. Ashland Global Specialty Chemicals specializes in pharmaceutical excipients with emphasis on performance optimization. Daicel Corporation offers comprehensive cellulose derivatives with a focus on industrial and pharmaceutical applications.

Global Powdered Cellulose Market - Stakeholder Contribution Framework

The success of powdered cellulose, driven by demand for functional food ingredients, pharmaceutical excipients, and sustainable materials, will not only enhance product performance across industries but also strengthen supply chain circularity by valorizing wood and agricultural residues.

It will consolidate emerging markets as suppliers of low-cost cellulose while aligning advanced economies with clean-label and eco-friendly ingredient sourcing. This calls for a concerted effort by all stakeholders: governments, industry bodies, suppliers, OEMs, and investors. Each can be a crucial enabler in preparing the market for its next phase of growth.

How Governments Could Spur Local Production and Adoption?

  • Targeted Incentives: Offer tax credits for processors utilizing agricultural and forestry by-products in cellulose production. Provide subsidies for pharma-grade and food-grade processing facilities.
  • Trade Agreements: Recognize powdered cellulose as a sustainable input in trade deals and harmonize food safety approvals across importing regions.
  • Facilitate Innovation: Fund R&D into nano-cellulose applications, biodegradable packaging blends, and low-energy production technologies.

How Industry Bodies Could Support Market Development?

  • Foster Connectivity: Build industry consortia linking cellulose producers, food companies, pharma firms, and sustainability regulators to align standards and certifications.
  • Promote Exports: Position powdered cellulose as a clean-label thickener, stabilizer, and dietary fiber in food and pharma markets. Organize trade fairs and export campaigns.
  • Upskilling Programs: Train processors and distributors on compliance with pharmaceutical GMP, food safety certifications, and environmental audits.

How OEMs and Tech Players Could Strengthen the Ecosystem?

  • Drive Integration: Develop energy-efficient grinding, milling, and drying technologies optimized for cellulose production.
  • Forge Partnerships: Collaborate with ingredient companies to co-develop custom particle sizes and functionalities for bakery, supplements, and industrial applications.

How Suppliers Could Navigate the Shift?

  • Capture Exports: Expand supply into regions with growing demand for fiber-enriched foods, low-fat formulations, and pharma excipients.
  • Invest in Research: Partner with universities and startups to explore applications in biodegradable plastics, coatings, and specialty composites.
  • Build Capabilities: Train sales and technical teams to demonstrate the functional and sustainability benefits of cellulose to end users.

How Investors Could Catalyze Growth?

  • Deploy Capital: Fund scale-up of integrated biorefineries converting wood pulp and crop residues into cellulose.
  • Support Branding: Invest in ingredient brands highlighting clean-label, non-GMO, and sustainable sourcing attributes.
  • De-Risk Supply Chains: Finance diversification of raw material sources across forestry, crop residues, and recycled streams.

Key Players in the Powdered Cellulose Market

  • JRS Pharma
  • Asahi Kasei
  • IFF (DuPont Nutrition & Biosciences)
  • Ingredion
  • Ashland Global Specialty Chemicals
  • Daicel Corporation
  • Lenzing AG
  • Nippon Paper Industries
  • Sappi Limited
  • Domsjö Fabriker

Scope of the Report

Items Values
Quantitative Units (2025) USD 202.8 Million
Grade Food Grade, Pharmaceutical Grade, Industrial Grade
Source Soft & Hard Wood Pulp, Cotton Linter Pulp, Bamboo, Wheat Straw Pulp, Other Sources
End-Use Industry Food & Beverage, Pharmaceuticals, Cosmetics, Construction Industry, Chemical Industry, Leather Industry, Textile Industry, Paper Industry, Others
Regions Covered North America, Europe, East Asia, South Asia & Pacific, Latin America, Middle East & Africa
Countries Covered United States, Canada, United Kingdom, Germany, France, China, Japan, South Korea, India, South Korea, Australia and 40+ countries
Key Companies Profiled JRS Pharma, Asahi Kasei, IFF (DuPont Nutrition & Biosciences), Ingredion, Ashland Global Specialty Chemicals, Daicel Corporation, Lenzing AG, Nippon Paper Industries, Sappi Limited, and Domsjö Fabriker
Additional Attributes Dollar sales by grade and end-use industry, regional demand trends, competitive landscape, technological advancements in processing methods, sustainable sourcing initiatives, regulatory compliance requirements, and application-specific formulation development

Key Segments

By Grade:

  • Food Grade
  • Pharmaceutical Grade
  • Industrial Grade

By Source:

  • Soft & Hard Wood Pulp
  • Cotton Linter Pulp
  • Bamboo
  • Wheat Straw Pulp
  • Other Sources

By End-Use Industry:

  • Food & Beverage
  • Pharmaceuticals
  • Cosmetics
  • Construction Industry
  • Chemical Industry
  • Leather Industry
  • Textile Industry
  • Paper Industry
  • Others

By Region:

North America

  • United States
  • Canada
  • Mexico

Europe

  • Germany
  • United Kingdom
  • France
  • Italy
  • Spain
  • Nordic
  • BENELUX
  • Rest of Europe

East Asia

  • China
  • Japan
  • South Korea

South Asia & Pacific

  • India
  • ASEAN
  • Australia & New Zealand
  • Rest of South Asia & Pacific

Latin America

  • South Korea
  • Chile
  • Rest of Latin America

Middle East & Africa

  • Kingdom of Saudi Arabia
  • Other GCC Countries
  • Turkiye
  • South Africa
  • Other African Union
  • Rest of Middle East & Africa

Table of Content

  • 1. Executive Summary
  • 2. Market Overview
  • 3. Market Background
  • 4. Global Market Analysis 2020 to 2024 and Forecast, 2025 to 2035
  • 5. Global Market Analysis 2020 to 2024 and Forecast 2025 to 2035, By Grade
    • 5.1. Food Grade
    • 5.2. Pharmaceutical Grade
    • 5.3. Industrial Grade
  • 6. Global Market Analysis 2020 to 2024 and Forecast 2025 to 2035, By Functionality
    • 6.1. Thickener
    • 6.2. Stabilizer
    • 6.3. Emulsifier
    • 6.4. Gelling
    • 6.5. Coating Agent
    • 6.6. Others
  • 7. Global Market Analysis 2020 to 2024 and Forecast 2025 to 2035, By Source
    • 7.1. Soft and Hard Wood Pulp
    • 7.2. Cotton Linter Pulp
    • 7.3. Bamboo
    • 7.4. Wheat Straw Pulp
    • 7.5. Other Source (oats, etc.)
  • 8. Global Market Analysis 2020 to 2024 and Forecast 2025 to 2035, By End Use
    • 8.1. Food & Beverage Industry
      • 8.1.1. Bakery & Confectionery
      • 8.1.2. Meat & Poultry Product
      • 8.1.3. Sauces & Dressings
      • 8.1.4. Beverages
      • 8.1.5. Processed Food
      • 8.1.6. Dairy Products
      • 8.1.7. Others
    • 8.2. Pharmaceuticals
    • 8.3. Cosmetics
    • 8.4. Construction Industry
    • 8.5. Chemical Industry
    • 8.6. Leather Industry
    • 8.7. Textile Industry
    • 8.8. Paper Industry
    • 8.9. Others
  • 9. Global Market Analysis 2020 to 2024 and Forecast 2025 to 2035, By Region
    • 9.1. North America
    • 9.2. Latin America
    • 9.3. Europe
    • 9.4. East Asia
    • 9.5. South Asia
    • 9.6. Oceania
    • 9.7. Middle East and Africa
  • 10. North America Market Analysis 2020 to 2024 and Forecast 2025 to 2035, By Country
  • 11. Latin America Market Analysis 2020 to 2024 and Forecast 2025 to 2035, By Country
  • 12. Europe Market Analysis 2020 to 2024 and Forecast 2025 to 2035, By Country
  • 13. East Asia Market Analysis 2020 to 2024 and Forecast 2025 to 2035, By Country
  • 14. South Asia Market Analysis 2020 to 2024 and Forecast 2025 to 2035, By Country
  • 15. Oceania Market Analysis 2020 to 2024 and Forecast 2025 to 2035, By Country
  • 16. Middle East and Africa Market Analysis 2020 to 2024 and Forecast 2025 to 2035, By Country
  • 17. Key Countries Market Analysis
  • 18. Market Structure Analysis
  • 19. Competition Analysis
    • 19.1. J. Rettenmaier & Söhne GmbH + Co KG
    • 19.2. CFF GmbH & Co. KG
    • 19.3. Jelu-Werk J. Heeler GmbH & Co KG
    • 19.4. InterFiber Sp. Z.O.O
    • 19.5. Ankit Pulps and Boards PVT. LTD
    • 19.6. Accent Microcell Pvt. Ltd.
    • 19.7. NB Entrepreneurs
    • 19.8. Mikro-Technik GmbH & Co KG
    • 19.9. Central Drug House (P) Ltd.
    • 19.10. Natural Fiber Solutions
    • 19.11. Parnacell Chemical Pvt. Ltd.
    • 19.12. AROMATICS
    • 19.13. Maple Biotech Pvt. Ltd
    • 19.14. HNB BIO CO., LTD
    • 19.15. FineCell Sweden AB
    • 19.16. Others
  • 20. Assumptions & Acronyms Used
  • 21. Research Methodology

List of Tables

  • Table 1: Global Market Value (USD Billion) Forecast by Region, 2020-2035
  • Table 2: Global Market Volume (Units) Forecast by Region, 2020-2035
  • Table 3: Global Market Value (USD Billion) Forecast by Product Type, 2020-2035
  • Table 4: Global Market Volume (Units) Forecast by Product Type, 2020-2035
  • Table 5: Global Market Value (USD Billion) Forecast by Functionality, 2020-2035
  • Table 6: Global Market Volume (Units) Forecast by Functionality, 2020-2035
  • Table 7: Global Market Value (USD Billion) Forecast by Source, 2020-2035
  • Table 8: Global Market Volume (Units) Forecast by Source, 2020-2035
  • Table 9: Global Market Value (USD Billion) Forecast by End User, 2020-2035
  • Table 10: Global Market Volume (Units) Forecast by End User, 2020-2035
  • Table 11: North America Market Value (USD Billion) Forecast by Country, 2020-2035
  • Table 12: North America Market Volume (Units) Forecast by Country, 2020-2035
  • Table 13: North America Market Value (USD Billion) Forecast by Product Type, 2020-2035
  • Table 14: North America Market Volume (Units) Forecast by Product Type, 2020-2035
  • Table 15: North America Market Value (USD Billion) Forecast by Functionality, 2020-2035
  • Table 16: North America Market Volume (Units) Forecast by Functionality, 2020-2035
  • Table 17: North America Market Value (USD Billion) Forecast by Source, 2020-2035
  • Table 18: North America Market Volume (Units) Forecast by Source, 2020-2035
  • Table 19: North America Market Value (USD Billion) Forecast by End User, 2020-2035
  • Table 20: North America Market Volume (Units) Forecast by End User, 2020-2035
  • Table 21: Latin America Market Value (USD Billion) Forecast by Country, 2020-2035
  • Table 22: Latin America Market Volume (Units) Forecast by Country, 2020-2035
  • Table 23: Latin America Market Value (USD Billion) Forecast by Product Type, 2020-2035
  • Table 24: Latin America Market Volume (Units) Forecast by Product Type, 2020-2035
  • Table 25: Latin America Market Value (USD Billion) Forecast by Functionality, 2020-2035
  • Table 26: Latin America Market Volume (Units) Forecast by Functionality, 2020-2035
  • Table 27: Latin America Market Value (USD Billion) Forecast by Source, 2020-2035
  • Table 28: Latin America Market Volume (Units) Forecast by Source, 2020-2035
  • Table 29: Latin America Market Value (USD Billion) Forecast by End User, 2020-2035
  • Table 30: Latin America Market Volume (Units) Forecast by End User, 2020-2035
  • Table 31: East Asia Market Value (USD Billion) Forecast by Country, 2020-2035
  • Table 32: East Asia Market Volume (Units) Forecast by Country, 2020-2035
  • Table 33: East Asia Market Value (USD Billion) Forecast by Product Type, 2020-2035
  • Table 34: East Asia Market Volume (Units) Forecast by Product Type, 2020-2035
  • Table 35: East Asia Market Value (USD Billion) Forecast by Functionality, 2020-2035
  • Table 36: East Asia Market Volume (Units) Forecast by Functionality, 2020-2035
  • Table 37: East Asia Market Value (USD Billion) Forecast by Source, 2020-2035
  • Table 38: East Asia Market Volume (Units) Forecast by Source, 2020-2035
  • Table 39: East Asia Market Value (USD Billion) Forecast by End User, 2020-2035
  • Table 40: East Asia Market Volume (Units) Forecast by End User, 2020-2035
  • Table 41: South Asia & Pacific Market Value (USD Billion) Forecast by Country, 2020-2035
  • Table 42: South Asia & Pacific Market Volume (Units) Forecast by Country, 2020-2035
  • Table 43: South Asia & Pacific Market Value (USD Billion) Forecast by Product Type, 2020-2035
  • Table 44: South Asia & Pacific Market Volume (Units) Forecast by Product Type, 2020-2035
  • Table 45: South Asia & Pacific Market Value (USD Billion) Forecast by Functionality, 2020-2035
  • Table 46: South Asia & Pacific Market Volume (Units) Forecast by Functionality, 2020-2035
  • Table 47: South Asia & Pacific Market Value (USD Billion) Forecast by Source, 2020-2035
  • Table 48: South Asia & Pacific Market Volume (Units) Forecast by Source, 2020-2035
  • Table 49: South Asia & Pacific Market Value (USD Billion) Forecast by End User, 2020-2035
  • Table 50: South Asia & Pacific Market Volume (Units) Forecast by End User, 2020-2035
  • Table 51: Western Europe Market Value (USD Billion) Forecast by Country, 2020-2035
  • Table 52: Western Europe Market Volume (Units) Forecast by Country, 2020-2035
  • Table 53: Western Europe Market Value (USD Billion) Forecast by Product Type, 2020-2035
  • Table 54: Western Europe Market Volume (Units) Forecast by Product Type, 2020-2035
  • Table 55: Western Europe Market Value (USD Billion) Forecast by Functionality, 2020-2035
  • Table 56: Western Europe Market Volume (Units) Forecast by Functionality, 2020-2035
  • Table 57: Western Europe Market Value (USD Billion) Forecast by Source, 2020-2035
  • Table 58: Western Europe Market Volume (Units) Forecast by Source, 2020-2035
  • Table 59: Western Europe Market Value (USD Billion) Forecast by End User, 2020-2035
  • Table 60: Western Europe Market Volume (Units) Forecast by End User, 2020-2035
  • Table 61: Eastern Europe Market Value (USD Billion) Forecast by Country, 2020-2035
  • Table 62: Eastern Europe Market Volume (Units) Forecast by Country, 2020-2035
  • Table 63: Eastern Europe Market Value (USD Billion) Forecast by Product Type, 2020-2035
  • Table 64: Eastern Europe Market Volume (Units) Forecast by Product Type, 2020-2035
  • Table 65: Eastern Europe Market Value (USD Billion) Forecast by Functionality, 2020-2035
  • Table 66: Eastern Europe Market Volume (Units) Forecast by Functionality, 2020-2035
  • Table 67: Eastern Europe Market Value (USD Billion) Forecast by Source, 2020-2035
  • Table 68: Eastern Europe Market Volume (Units) Forecast by Source, 2020-2035
  • Table 69: Eastern Europe Market Value (USD Billion) Forecast by End User, 2020-2035
  • Table 70: Eastern Europe Market Volume (Units) Forecast by End User, 2020-2035
  • Table 71: Middle East & Africa Market Value (USD Billion) Forecast by Country, 2020-2035
  • Table 72: Middle East & Africa Market Volume (Units) Forecast by Country, 2020-2035
  • Table 73: Middle East & Africa Market Value (USD Billion) Forecast by Product Type, 2020-2035
  • Table 74: Middle East & Africa Market Volume (Units) Forecast by Product Type, 2020-2035
  • Table 75: Middle East & Africa Market Value (USD Billion) Forecast by Functionality, 2020-2035
  • Table 76: Middle East & Africa Market Volume (Units) Forecast by Functionality, 2020-2035
  • Table 77: Middle East & Africa Market Value (USD Billion) Forecast by Source, 2020-2035
  • Table 78: Middle East & Africa Market Volume (Units) Forecast by Source, 2020-2035
  • Table 79: Middle East & Africa Market Value (USD Billion) Forecast by End User, 2020-2035
  • Table 80: Middle East & Africa Market Volume (Units) Forecast by End User, 2020-2035
  • Table 81: USA Market Value (USD Billion) Forecast by Product Type, 2020-2035
  • Table 82: USA Market Volume (Units) Forecast by Product Type, 2020-2035
  • Table 83: USA Market Value (USD Billion) Forecast by Functionality, 2020-2035
  • Table 84: USA Market Volume (Units) Forecast by Functionality, 2020-2035
  • Table 85: USA Market Value (USD Billion) Forecast by Source, 2020-2035
  • Table 86: USA Market Volume (Units) Forecast by Source, 2020-2035
  • Table 87: USA Market Value (USD Billion) Forecast by End User, 2020-2035
  • Table 88: USA Market Volume (Units) Forecast by End User, 2020-2035
  • Table 89: Canada Market Value (USD Billion) Forecast by Product Type, 2020-2035
  • Table 90: Canada Market Volume (Units) Forecast by Product Type, 2020-2035
  • Table 91: Canada Market Value (USD Billion) Forecast by Functionality, 2020-2035
  • Table 92: Canada Market Volume (Units) Forecast by Functionality, 2020-2035
  • Table 93: Canada Market Value (USD Billion) Forecast by Source, 2020-2035
  • Table 94: Canada Market Volume (Units) Forecast by Source, 2020-2035
  • Table 95: Canada Market Value (USD Billion) Forecast by End User, 2020-2035
  • Table 96: Canada Market Volume (Units) Forecast by End User, 2020-2035
  • Table 97: Mexico Market Value (USD Billion) Forecast by Product Type, 2020-2035
  • Table 98: Mexico Market Volume (Units) Forecast by Product Type, 2020-2035
  • Table 99: Mexico Market Value (USD Billion) Forecast by Functionality, 2020-2035
  • Table 100: Mexico Market Volume (Units) Forecast by Functionality, 2020-2035
  • Table 101: Mexico Market Value (USD Billion) Forecast by Source, 2020-2035
  • Table 102: Mexico Market Volume (Units) Forecast by Source, 2020-2035
  • Table 103: Mexico Market Value (USD Billion) Forecast by End User, 2020-2035
  • Table 104: Mexico Market Volume (Units) Forecast by End User, 2020-2035
  • Table 105: Brazil Market Value (USD Billion) Forecast by Product Type, 2020-2035
  • Table 106: Brazil Market Volume (Units) Forecast by Product Type, 2020-2035
  • Table 107: Brazil Market Value (USD Billion) Forecast by Functionality, 2020-2035
  • Table 108: Brazil Market Volume (Units) Forecast by Functionality, 2020-2035
  • Table 109: Brazil Market Value (USD Billion) Forecast by Source, 2020-2035
  • Table 110: Brazil Market Volume (Units) Forecast by Source, 2020-2035
  • Table 111: Brazil Market Value (USD Billion) Forecast by End User, 2020-2035
  • Table 112: Brazil Market Volume (Units) Forecast by End User, 2020-2035
  • Table 113: China Market Value (USD Billion) Forecast by Product Type, 2020-2035
  • Table 114: China Market Volume (Units) Forecast by Product Type, 2020-2035
  • Table 115: China Market Value (USD Billion) Forecast by Functionality, 2020-2035
  • Table 116: China Market Volume (Units) Forecast by Functionality, 2020-2035
  • Table 117: China Market Value (USD Billion) Forecast by Source, 2020-2035
  • Table 118: China Market Volume (Units) Forecast by Source, 2020-2035
  • Table 119: China Market Value (USD Billion) Forecast by End User, 2020-2035
  • Table 120: China Market Volume (Units) Forecast by End User, 2020-2035
  • Table 121: India Market Value (USD Billion) Forecast by Product Type, 2020-2035
  • Table 122: India Market Volume (Units) Forecast by Product Type, 2020-2035
  • Table 123: India Market Value (USD Billion) Forecast by Functionality, 2020-2035
  • Table 124: India Market Volume (Units) Forecast by Functionality, 2020-2035
  • Table 125: India Market Value (USD Billion) Forecast by Source, 2020-2035
  • Table 126: India Market Volume (Units) Forecast by Source, 2020-2035
  • Table 127: India Market Value (USD Billion) Forecast by End User, 2020-2035
  • Table 128: India Market Volume (Units) Forecast by End User, 2020-2035
  • Table 129: Japan Market Value (USD Billion) Forecast by Product Type, 2020-2035
  • Table 130: Japan Market Volume (Units) Forecast by Product Type, 2020-2035
  • Table 131: Japan Market Value (USD Billion) Forecast by Functionality, 2020-2035
  • Table 132: Japan Market Volume (Units) Forecast by Functionality, 2020-2035
  • Table 133: Japan Market Value (USD Billion) Forecast by Source, 2020-2035
  • Table 134: Japan Market Volume (Units) Forecast by Source, 2020-2035
  • Table 135: Japan Market Value (USD Billion) Forecast by End User, 2020-2035
  • Table 136: Japan Market Volume (Units) Forecast by End User, 2020-2035
  • Table 137: Germany Market Value (USD Billion) Forecast by Product Type, 2020-2035
  • Table 138: Germany Market Volume (Units) Forecast by Product Type, 2020-2035
  • Table 139: Germany Market Value (USD Billion) Forecast by Functionality, 2020-2035
  • Table 140: Germany Market Volume (Units) Forecast by Functionality, 2020-2035
  • Table 141: Germany Market Value (USD Billion) Forecast by Source, 2020-2035
  • Table 142: Germany Market Volume (Units) Forecast by Source, 2020-2035
  • Table 143: Germany Market Value (USD Billion) Forecast by End User, 2020-2035
  • Table 144: Germany Market Volume (Units) Forecast by End User, 2020-2035
  • Table 145: UK Market Value (USD Billion) Forecast by Product Type, 2020-2035
  • Table 146: UK Market Volume (Units) Forecast by Product Type, 2020-2035
  • Table 147: UK Market Value (USD Billion) Forecast by Functionality, 2020-2035
  • Table 148: UK Market Volume (Units) Forecast by Functionality, 2020-2035
  • Table 149: UK Market Value (USD Billion) Forecast by Source, 2020-2035
  • Table 150: UK Market Volume (Units) Forecast by Source, 2020-2035

List of Figures

  • Figure 1: Global Market Value (USD Billion) by Product Type, 2025-2035
  • Figure 2: Global Market Value (USD Billion) by Functionality, 2025-2035
  • Figure 3: Global Market Value (USD Billion) by Source, 2025-2035
  • Figure 4: Global Market Value (USD Billion) by End User, 2025-2035
  • Figure 5: Global Market Value (USD Billion) by Region, 2025-2035
  • Figure 6: Global Market Value (USD Billion) Analysis by Region, 2020-2035
  • Figure 7: Global Market Volume (Units) Analysis by Region, 2020-2035
  • Figure 8: Global Market Value Share (%) and BPS Analysis by Region, 2025-2035
  • Figure 9: Global Market Y-o-Y Growth (%) Projections by Region, 2025-2035
  • Figure 10: Global Market Value (USD Billion) Analysis by Product Type, 2020-2035
  • Figure 11: Global Market Volume (Units) Analysis by Product Type, 2020-2035
  • Figure 12: Global Market Value Share (%) and BPS Analysis by Product Type, 2025-2035
  • Figure 13: Global Market Y-o-Y Growth (%) Projections by Product Type, 2025-2035
  • Figure 14: Global Market Value (USD Billion) Analysis by Functionality, 2020-2035
  • Figure 15: Global Market Volume (Units) Analysis by Functionality, 2020-2035
  • Figure 16: Global Market Value Share (%) and BPS Analysis by Functionality, 2025-2035
  • Figure 17: Global Market Y-o-Y Growth (%) Projections by Functionality, 2025-2035
  • Figure 18: Global Market Value (USD Billion) Analysis by Source, 2020-2035
  • Figure 19: Global Market Volume (Units) Analysis by Source, 2020-2035
  • Figure 20: Global Market Value Share (%) and BPS Analysis by Source, 2025-2035
  • Figure 21: Global Market Y-o-Y Growth (%) Projections by Source, 2025-2035
  • Figure 22: Global Market Value (USD Billion) Analysis by End User, 2020-2035
  • Figure 23: Global Market Volume (Units) Analysis by End User, 2020-2035
  • Figure 24: Global Market Value Share (%) and BPS Analysis by End User, 2025-2035
  • Figure 25: Global Market Y-o-Y Growth (%) Projections by End User, 2025-2035
  • Figure 26: Global Market Attractiveness by Product Type, 2025-2035
  • Figure 27: Global Market Attractiveness by Functionality, 2025-2035
  • Figure 28: Global Market Attractiveness by Source, 2025-2035
  • Figure 29: Global Market Attractiveness by End User, 2025-2035
  • Figure 30: Global Market Attractiveness by Region, 2025-2035
  • Figure 31: North America Market Value (USD Billion) by Product Type, 2025-2035
  • Figure 32: North America Market Value (USD Billion) by Functionality, 2025-2035
  • Figure 33: North America Market Value (USD Billion) by Source, 2025-2035
  • Figure 34: North America Market Value (USD Billion) by End User, 2025-2035
  • Figure 35: North America Market Value (USD Billion) by Country, 2025-2035
  • Figure 36: North America Market Value (USD Billion) Analysis by Country, 2020-2035
  • Figure 37: North America Market Volume (Units) Analysis by Country, 2020-2035
  • Figure 38: North America Market Value Share (%) and BPS Analysis by Country, 2025-2035
  • Figure 39: North America Market Y-o-Y Growth (%) Projections by Country, 2025-2035
  • Figure 40: North America Market Value (USD Billion) Analysis by Product Type, 2020-2035
  • Figure 41: North America Market Volume (Units) Analysis by Product Type, 2020-2035
  • Figure 42: North America Market Value Share (%) and BPS Analysis by Product Type, 2025-2035
  • Figure 43: North America Market Y-o-Y Growth (%) Projections by Product Type, 2025-2035
  • Figure 44: North America Market Value (USD Billion) Analysis by Functionality, 2020-2035
  • Figure 45: North America Market Volume (Units) Analysis by Functionality, 2020-2035
  • Figure 46: North America Market Value Share (%) and BPS Analysis by Functionality, 2025-2035
  • Figure 47: North America Market Y-o-Y Growth (%) Projections by Functionality, 2025-2035
  • Figure 48: North America Market Value (USD Billion) Analysis by Source, 2020-2035
  • Figure 49: North America Market Volume (Units) Analysis by Source, 2020-2035
  • Figure 50: North America Market Value Share (%) and BPS Analysis by Source, 2025-2035
  • Figure 51: North America Market Y-o-Y Growth (%) Projections by Source, 2025-2035
  • Figure 52: North America Market Value (USD Billion) Analysis by End User, 2020-2035
  • Figure 53: North America Market Volume (Units) Analysis by End User, 2020-2035
  • Figure 54: North America Market Value Share (%) and BPS Analysis by End User, 2025-2035
  • Figure 55: North America Market Y-o-Y Growth (%) Projections by End User, 2025-2035
  • Figure 56: North America Market Attractiveness by Product Type, 2025-2035
  • Figure 57: North America Market Attractiveness by Functionality, 2025-2035
  • Figure 58: North America Market Attractiveness by Source, 2025-2035
  • Figure 59: North America Market Attractiveness by End User, 2025-2035
  • Figure 60: North America Market Attractiveness by Country, 2025-2035
  • Figure 61: Latin America Market Value (USD Billion) by Product Type, 2025-2035
  • Figure 62: Latin America Market Value (USD Billion) by Functionality, 2025-2035
  • Figure 63: Latin America Market Value (USD Billion) by Source, 2025-2035
  • Figure 64: Latin America Market Value (USD Billion) by End User, 2025-2035
  • Figure 65: Latin America Market Value (USD Billion) by Country, 2025-2035
  • Figure 66: Latin America Market Value (USD Billion) Analysis by Country, 2020-2035
  • Figure 67: Latin America Market Volume (Units) Analysis by Country, 2020-2035
  • Figure 68: Latin America Market Value Share (%) and BPS Analysis by Country, 2025-2035
  • Figure 69: Latin America Market Y-o-Y Growth (%) Projections by Country, 2025-2035
  • Figure 70: Latin America Market Value (USD Billion) Analysis by Product Type, 2020-2035
  • Figure 71: Latin America Market Volume (Units) Analysis by Product Type, 2020-2035
  • Figure 72: Latin America Market Value Share (%) and BPS Analysis by Product Type, 2025-2035
  • Figure 73: Latin America Market Y-o-Y Growth (%) Projections by Product Type, 2025-2035
  • Figure 74: Latin America Market Value (USD Billion) Analysis by Functionality, 2020-2035
  • Figure 75: Latin America Market Volume (Units) Analysis by Functionality, 2020-2035
  • Figure 76: Latin America Market Value Share (%) and BPS Analysis by Functionality, 2025-2035
  • Figure 77: Latin America Market Y-o-Y Growth (%) Projections by Functionality, 2025-2035
  • Figure 78: Latin America Market Value (USD Billion) Analysis by Source, 2020-2035
  • Figure 79: Latin America Market Volume (Units) Analysis by Source, 2020-2035
  • Figure 80: Latin America Market Value Share (%) and BPS Analysis by Source, 2025-2035
  • Figure 81: Latin America Market Y-o-Y Growth (%) Projections by Source, 2025-2035
  • Figure 82: Latin America Market Value (USD Billion) Analysis by End User, 2020-2035
  • Figure 83: Latin America Market Volume (Units) Analysis by End User, 2020-2035
  • Figure 84: Latin America Market Value Share (%) and BPS Analysis by End User, 2025-2035
  • Figure 85: Latin America Market Y-o-Y Growth (%) Projections by End User, 2025-2035
  • Figure 86: Latin America Market Attractiveness by Product Type, 2025-2035
  • Figure 87: Latin America Market Attractiveness by Functionality, 2025-2035
  • Figure 88: Latin America Market Attractiveness by Source, 2025-2035
  • Figure 89: Latin America Market Attractiveness by End User, 2025-2035
  • Figure 90: Latin America Market Attractiveness by Country, 2025-2035
  • Figure 91: East Asia Market Value (USD Billion) by Product Type, 2025-2035
  • Figure 92: East Asia Market Value (USD Billion) by Functionality, 2025-2035
  • Figure 93: East Asia Market Value (USD Billion) by Source, 2025-2035
  • Figure 94: East Asia Market Value (USD Billion) by End User, 2025-2035
  • Figure 95: East Asia Market Value (USD Billion) by Country, 2025-2035
  • Figure 96: East Asia Market Value (USD Billion) Analysis by Country, 2020-2035
  • Figure 97: East Asia Market Volume (Units) Analysis by Country, 2020-2035
  • Figure 98: East Asia Market Value Share (%) and BPS Analysis by Country, 2025-2035
  • Figure 99: East Asia Market Y-o-Y Growth (%) Projections by Country, 2025-2035
  • Figure 100: East Asia Market Value (USD Billion) Analysis by Product Type, 2020-2035
  • Figure 101: East Asia Market Volume (Units) Analysis by Product Type, 2020-2035
  • Figure 102: East Asia Market Value Share (%) and BPS Analysis by Product Type, 2025-2035
  • Figure 103: East Asia Market Y-o-Y Growth (%) Projections by Product Type, 2025-2035
  • Figure 104: East Asia Market Value (USD Billion) Analysis by Functionality, 2020-2035
  • Figure 105: East Asia Market Volume (Units) Analysis by Functionality, 2020-2035
  • Figure 106: East Asia Market Value Share (%) and BPS Analysis by Functionality, 2025-2035
  • Figure 107: East Asia Market Y-o-Y Growth (%) Projections by Functionality, 2025-2035
  • Figure 108: East Asia Market Value (USD Billion) Analysis by Source, 2020-2035
  • Figure 109: East Asia Market Volume (Units) Analysis by Source, 2020-2035
  • Figure 110: East Asia Market Value Share (%) and BPS Analysis by Source, 2025-2035
  • Figure 111: East Asia Market Y-o-Y Growth (%) Projections by Source, 2025-2035
  • Figure 112: East Asia Market Value (USD Billion) Analysis by End User, 2020-2035
  • Figure 113: East Asia Market Volume (Units) Analysis by End User, 2020-2035
  • Figure 114: East Asia Market Value Share (%) and BPS Analysis by End User, 2025-2035
  • Figure 115: East Asia Market Y-o-Y Growth (%) Projections by End User, 2025-2035
  • Figure 116: East Asia Market Attractiveness by Product Type, 2025-2035
  • Figure 117: East Asia Market Attractiveness by Functionality, 2025-2035
  • Figure 118: East Asia Market Attractiveness by Source, 2025-2035
  • Figure 119: East Asia Market Attractiveness by End User, 2025-2035
  • Figure 120: East Asia Market Attractiveness by Country, 2025-2035
  • Figure 121: South Asia & Pacific Market Value (USD Billion) by Product Type, 2025-2035
  • Figure 122: South Asia & Pacific Market Value (USD Billion) by Functionality, 2025-2035
  • Figure 123: South Asia & Pacific Market Value (USD Billion) by Source, 2025-2035
  • Figure 124: South Asia & Pacific Market Value (USD Billion) by End User, 2025-2035
  • Figure 125: South Asia & Pacific Market Value (USD Billion) by Country, 2025-2035
  • Figure 126: South Asia & Pacific Market Value (USD Billion) Analysis by Country, 2020-2035
  • Figure 127: South Asia & Pacific Market Volume (Units) Analysis by Country, 2020-2035
  • Figure 128: South Asia & Pacific Market Value Share (%) and BPS Analysis by Country, 2025-2035
  • Figure 129: South Asia & Pacific Market Y-o-Y Growth (%) Projections by Country, 2025-2035
  • Figure 130: South Asia & Pacific Market Value (USD Billion) Analysis by Product Type, 2020-2035
  • Figure 131: South Asia & Pacific Market Volume (Units) Analysis by Product Type, 2020-2035
  • Figure 132: South Asia & Pacific Market Value Share (%) and BPS Analysis by Product Type, 2025-2035
  • Figure 133: South Asia & Pacific Market Y-o-Y Growth (%) Projections by Product Type, 2025-2035
  • Figure 134: South Asia & Pacific Market Value (USD Billion) Analysis by Functionality, 2020-2035
  • Figure 135: South Asia & Pacific Market Volume (Units) Analysis by Functionality, 2020-2035
  • Figure 136: South Asia & Pacific Market Value Share (%) and BPS Analysis by Functionality, 2025-2035
  • Figure 137: South Asia & Pacific Market Y-o-Y Growth (%) Projections by Functionality, 2025-2035
  • Figure 138: South Asia & Pacific Market Value (USD Billion) Analysis by Source, 2020-2035
  • Figure 139: South Asia & Pacific Market Volume (Units) Analysis by Source, 2020-2035
  • Figure 140: South Asia & Pacific Market Value Share (%) and BPS Analysis by Source, 2025-2035
  • Figure 141: South Asia & Pacific Market Y-o-Y Growth (%) Projections by Source, 2025-2035
  • Figure 142: South Asia & Pacific Market Value (USD Billion) Analysis by End User, 2020-2035
  • Figure 143: South Asia & Pacific Market Volume (Units) Analysis by End User, 2020-2035
  • Figure 144: South Asia & Pacific Market Value Share (%) and BPS Analysis by End User, 2025-2035
  • Figure 145: South Asia & Pacific Market Y-o-Y Growth (%) Projections by End User, 2025-2035
  • Figure 146: South Asia & Pacific Market Attractiveness by Product Type, 2025-2035
  • Figure 147: South Asia & Pacific Market Attractiveness by Functionality, 2025-2035
  • Figure 148: South Asia & Pacific Market Attractiveness by Source, 2025-2035
  • Figure 149: South Asia & Pacific Market Attractiveness by End User, 2025-2035
  • Figure 150: South Asia & Pacific Market Attractiveness by Country, 2025-2035

Frequently Asked Questions

What is the projected size of the powdered cellulose market by 2035?

The global powdered cellulose market is expected to reach USD 327.26 million by 2035, up from USD 202.83 million in 2025, growing at a CAGR of 4.9% during the forecast period.

Which grade of powdered cellulose dominates the market?

Food-grade powdered cellulose is set to lead the market with a 47.3% share in 2025, owing to its widespread use in bakery, dairy, and processed food for fat replacement, moisture retention, and fiber enrichment.

Which functionality segment holds the largest market share?

The thickener functionality segment is projected to account for 34.1% of market share in 2025, driven by its widespread use in food, pharmaceuticals, and cosmetics for consistent texture, heat stability, and label-friendly appeal.

Which source of powdered cellulose is growing the fastest?

Bamboo-based powdered cellulose is forecasted to grow at the fastest CAGR of 6.5% from 2025 to 2035, supported by its renewable profile, low environmental impact, and strong uptake in food packaging and sustainable applications.

Who are the leading players in the global powdered cellulose market?

Key players include J. Rettenmaier & Söhne GmbH + Co KG, CFF GmbH & Co. KG, Jelu-Werk J. Heeler GmbH & Co KG, InterFiber Sp. Z.O.O, Ankit Pulps and Boards Pvt. Ltd., and FineCell Sweden AB, all focusing on clean-label innovations and eco-friendly cellulose solutions.

Explore Similar Insights

Future Market Insights

Powdered Cellulose Market

Chat With MaRIA

Chat With

MaRIA

Hi There, I am MaRIA, Your Market Research Intelligence Assistant. How may I help you?