Powdered Soft Drinks Market
Market Insights on Powdered Soft Drinks covering sales outlook, demand forecast & up-to-date key trends
Powdered soft drinks Market by Flavour (Cola, Orange), Sales Channel (Hypermarkets/Supermarkets, Discount Stores), Packaging (Carton Boxes, Cans) & Region - Forecast 2022 - 2032
Powdered soft drinks Market Snapshot
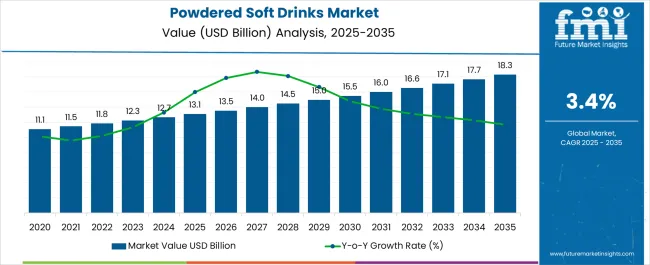
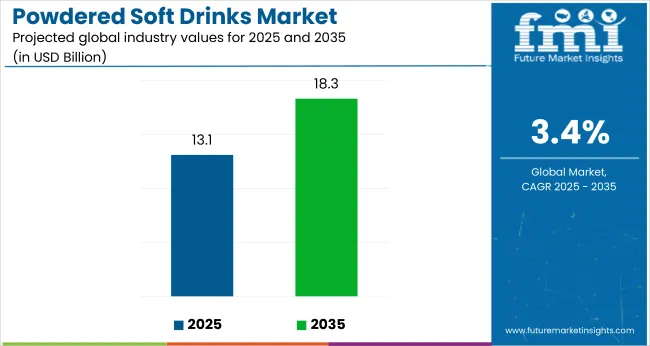
[350 Pages Report] Powdered soft drinks market was estimated at USD 12.0 Bn in 2022 and is expected to expand at a CAGR of 3.0% to USD 16.2 Bn by 2032. The rise in a number of trekking, walking, travel events, and camping has resulted in the shoot up of demand for packaged refreshments, therefore, boosting the powdered soft drink market, globally.
Powdered soft drinks Market Size Value in 2022 |
USD ~12.0 Bn |
Powdered soft drinks Market Forecast Value in 2032 |
USD ~16.2 Bn |
Global Growth Rate (2022 to 2032) |
~3.0% CAGR |
Forecast Period |
2022-2032 |
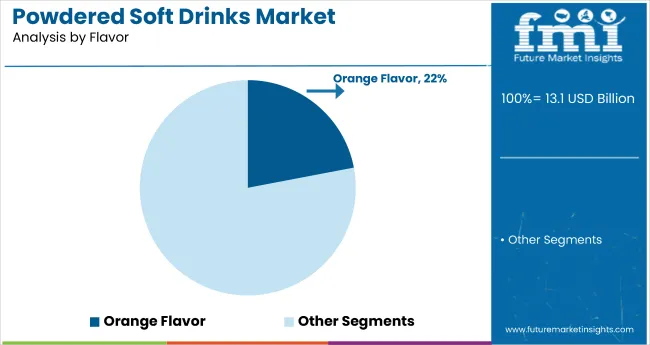
Orange remains the most popular flavor in the powdered soft drinks market.
Europe accounts for nearly 25% of the powdered soft market. Europe is also the largest market for powdered soft drinks globally.
Let us know your requirement to get
100% FREE customization
Increase in Outdoor Activities Amongst Youngsters to Propel the Utilization of Powdered Soft Drinks
Consumer demand for on-the-go products is a key factor that is driving the growth of the powdered soft drinks market. Busy schedules and tiring lifestyles are reducing the time spent on preparing healthy, tasty, and flavourful beverages. Hence, packaged items such as powdered soft drinks have become a likable and preferred option amongst consumers of almost all age groups.
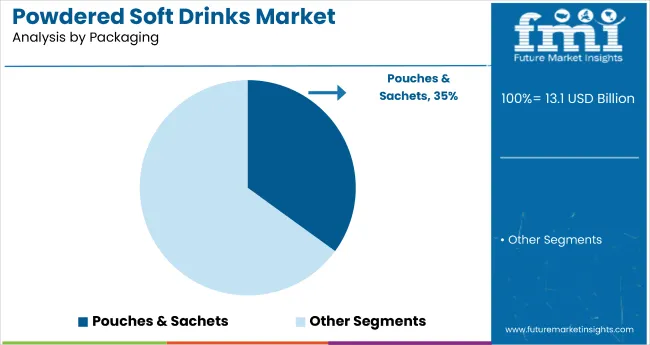
It's also simple to make a powdered soft drink. Furthermore, in the powdered soft drinks category, consumer-friendly packaging such as sachets is even more convenient.
The product contributes to the value of enjoyment and convenience for travelers, as they may be quickly produced for a short refreshment. Powdered soft drinks typically have a shelf life of one to three years. Long shelf life not only allows powdered soft drinks to be stored for longer periods of time but also makes transportation and usage of powdered soft drinks more convenient.
Powdered Soft Drinks Outscore the Demand for Juices and Fizzy Soft Drinks Due to Rise in Health Consciousness
Powdered soft drinks are being remodeled in all regions by the inclusion of low-calorie and natural sweeteners pave an opportunity for health-conscious consumers to consume soft drinks without comprising on their health routines. Powdered soft drinks can easily be diluted/ concentrated according to individual needs, unlike still drinks and ready-to-drink soft drinks.
Besides, powdered soft drinks are a delicious modicum for the consumption of nutrients. The product has gained considerable attention in the clinical nutrition and sports nutrition spaces, especially amongst consumers suffering from dysphagia. Due to the gym and fitness trend, the sports nutrition industry has witnessed a surging demand for varying product types and product formats, such as powder and gels.
Hence, customized development of powdered soft drinks to cater to the demands of these specific segments is also on the rise and is expected to drive the growth of the powdered soft drinks market.
Robust Supply Chain in the Powdered Soft Drinks Market
The supply chain of powdered soft drinks has proven to be decent in terms of transportation facilities, which helps in the easy flow of concentrate products. Existing supply models have benefitted powdered soft drinks in reaching customers without any obstacles. The powdered soft drinks that are supplied to food service and institutional outlets are supplied in bulk and are facilitated with effective storage and transportation.
Also, with food quality becoming increasingly important to consumers, powdered soft drink manufacturers, distributors, and other participants in the supply chain are investing in maintaining transparency in the supply chain and enhancing the traceability of products.
Good services play an important role in building customer relations, and in a bid to enhance services, quick and on-time delivery has become significantly important. Online selling has also contributed to shaping the evolution of the transportation and logistics vertical in the powdered soft drinks market.
Find your sweet spots for generating winning opportunities in this market.
Talk to AnalystPragmatic and Affordable Mechanisms in Processing and Producing Powdered Soft Drinks
Standardized processes and technological innovation have helped companies maintain the standards of powdered soft drinks as per the norms laid down by FDA, BRC, and HACCP. Despite the rise and fall of fruit prices all over the world, the prices of powdered soft drinks are almost constant, with a minor deviation of 15% in a year, because of the low cost of raw materials and fixed wages of labor.
Powdered Soft Drinks Market Saturated in Developed Regions
With major key players launching novel products and expanding their product portfolios of powdered soft drinks, the market has become highly saturated. In some countries, powdered soft drinks are also being perceived as old and boring. As health consciousness is sweeping Europe and North America, products like plant-based and vegan drinks are winning more space on retail shelves, and traditional beverages such as powdered soft drinks have been suffering a serious backlash.
An increase in investments in powdered soft drink production has led to cut-throat competition in the market. As more players expand their production capacity, there could come a sloping point where production growth meets, or may even outpace the demand for powdered soft drinks.

An unified Market Research Subscription Platform, built for today’s disparate research needs.
Scope Of Report
Attribute |
Details |
Market Size Value in 2022 |
USD ~12.0 Bn |
Market Forecast Value in 2032 |
USD ~16.2 Bn |
Global Growth Rate |
~3.0% CAGR |
Forecast Period |
2022-2032 |
Historical Data Available for |
2017-2021 |
Market Analysis |
MT for Volume and USD Bn for Value |
Key Regions Covered |
North America, Latin America, Europe, East Asia, South Asia, Oceania, MEA |
Key Countries Covered |
US, Canada, Brazil, Mexico, Germany, UK, France, Italy, Spain, China, India, Japan, ASEAN, Australia, New Zealand, GCC countries, North Africa, South Africa. |
Key Market Segments Covered |
Flavor, End Use, Sales Channel, Packaging, and Region |
Key Companies Profiled |
|
Pricing |
Available upon Request |
Global Powdered Soft Drinks Market: Segmentation
Analysis by Flavour:
- Cola
- Orange
- Lemon
- Mango
- Apple
- Berry
- Mixed Fruit
- Others
Analysis by End Use:
- Institutional
- Foodservice/HoReCa
- Household (Retail)
Analysis by Sales Channel:
- Hypermarkets/Supermarkets
- Discount Stores
- Mass Grocery Retailers
- Wholesale Club Stores
- Foodservice
- Others
Analysis by Packaging:
- Carton Boxes
- Pouches & Sachets
- Cans
- Bulk Packaging
Analysis by Region:
- North America
- Latin America
- Europe
- East Asia
- South Asia
- Oceania
- Middle East & Africa
Frequently Asked Questions
The powdered soft drink market is growing at a CAGR of 3.0%.
The forecasted market size is expected to be USD 16.2 Bn for the forecasted year 2022-2032.
The major industry drivers are the demand for packaged refreshments along with rising adoption by youngsters as a refreshment in outdoor activities.
Key strategies used by powdered soft drink market participants are product launches, mergers and acquisitions, joint ventures, and R&D activities.
North America, Latin America, Europe, East Asia, South Asia, Oceania, MEA are the major regions in the industry.
Europe region consumes the highest amount of powdered soft drink which is nearly 25.9%.
The most common flavors of powdered soft drinks are orange, apple, and cola.
The market’s major application segment includes nutrition supplements, bakery & confectionery, and animal feed.
Some of the key market players in the powdered soft drink market are Dr. Pepper Snapple Group, Inc., PepsiCo, Inc., Kraft Heinz, Mondelez, Inc., US Foods, Inc., Continental Mills, Inc., Arizona Beverage Company, National Beverage Corporation, Kerry Plc, Insta Foods, Sugam Products, Lasco Foods, Inc., The Sqwincher Corporation, True Citrus and others.
1. Market Overview
1.1. Market Coverage / Taxonomy
1.2. Market Definition / Scope / Limitations
2. The Massive Impact of the Crisis
2.1. Global Powdered Soft Drinks Market Forecast Scenario Comparison of Annual Growth Rates for short term (2022-2026) and Long Term (2027-2032)
2.1.1. Optimistic Scenario
2.1.1.1. China
2.1.1.2. US
2.1.1.3. India
2.1.1.4. Euro Zone
2.1.1.5. Asia Pacific
2.1.1.6. Rest of the World
2.1.2. Likely Scenario
2.1.2.1. China
2.1.2.2. US
2.1.2.3. India
2.1.2.4. Euro Zone
2.1.2.5. Asia Pacific
2.1.2.6. Rest of the World
2.1.3. Pessimistic Scenario
2.1.3.1. China
2.1.3.2. US
2.1.3.3. India
2.1.3.4. Euro Zone
2.1.3.5. Asia Pacific
2.1.3.6. Rest of the World
2.2. Key Factors Impacting the Market
2.3. Note: Market Assessment shall be Provided for Likely Scenario
3. Market Background
3.1. Drivers
3.1.1. Supply Side Drivers
3.1.2. Demand Side drivers
3.1.3. Economic Side Drivers
3.2. Restraints
3.3. Opportunity
3.4. Market Trends By Region
3.5. Product launches
3.6. Product Claims & Nutritional InFlavoration Scan by Buyers
3.7. Macro-Economic Factors
3.8. Forecast Factors - Relevance & Impact
3.9. Consumers Survey Analysis
4. Key Regulations
4.1. Distribution Channel & Labelling Regulations
4.2. Certifications and Certifying Agency Overview
4.3. Import/Export Policies
5. Global Powdered Soft Drinks Market Demand Analysis 2017-2021 and Forecast, 2022-2032
5.1. Historical Market Volume (MT) Analysis, 2017-2021
5.2. Current and Future Market Volume (MT) Projections, 2022-2032
5.3. Y-o-Y Growth Trend Analysis
6. Global Powdered Soft Drinks Market - Pricing Analysis
6.1. Regional Pricing Analysis (USD/MT) By Flavor (2017,2022,2032)
6.1.1. Cola
6.1.2. Orange
6.1.3. Lemon
6.1.4. Mango
6.1.5. Apple
6.1.6. Berry
6.1.7. Mixed Fruit
6.1.8. Others
6.2. Pricing Break-up (2017,2022,2032)
6.2.1. Producer Level Pricing
6.2.2. Distributor Level Pricing
6.2.3. Retailer Level Pricing
6.3. Global Average Pricing Analysis Benchmark
7. Global Powdered Soft Drinks Market Demand (Size in USD Bn) Analysis 2017-2021 and Forecast, 2022-2032
7.1. Historical Market Value (USD Bn) Analysis, 2017-2021
7.2. Current and Future Market Value (USD Bn) Projections, 2022-2032
7.2.1. Y-o-Y Growth Trend Analysis
7.2.2. Absolute $ Opportunity Analysis
8. Global Powdered Soft Drinks Market Analysis 2017-2021 and Forecast 2022-2032, By Flavor
8.1. Introduction / Key Findings
8.2. Historical Market Size (USD Bn) and Volume Analysis By Flavor, 2017-2021
8.3. Current and Future Market Size (USD Bn) and Volume Analysis and Forecast By Flavor, 2022-2032
8.3.1. Cola
8.3.2. Orange
8.3.3. Lemon
8.3.4. Mango
8.3.5. Apple
8.3.6. Berry
8.3.7. Mixed Fruit
8.3.8. Others
8.4. Market Attractiveness Analysis By Flavor
9. Global Powdered Soft Drinks Market Analysis 2017-2021 and Forecast 2022-2032, By End Use
9.1. Introduction / Key Findings
9.2. Historical Market Size (USD Bn) and Volume Analysis By End Use, 2017-2021
9.3. Current and Future Market Size (USD Bn) and Volume Analysis and Forecast By End Use, 2022-2032
9.3.1. Institutional
9.3.2. Foodservice/HoReCa
9.3.3. Household (Retail)
9.4. Market Attractiveness Analysis By End Use
10. Global Powdered Soft Drinks Market Analysis 2017-2021 and Forecast 2022-2032, By Sales Channel
10.1. Introduction / Key Findings
10.2. Historical Market Size (USD Bn) and Volume Analysis By Sales Channel, 2017-2021
10.3. Current and Future Market Size (USD Bn) and Volume Analysis and Forecast By Sales Channel, 2022-2032
10.3.1. Hypermarkets/Supermarkets
10.3.2. Discount Stores
10.3.3. Mass Grocery Retailers
10.3.4. Wholesale Club Stores
10.3.5. Foodservice
10.3.6. Others
10.4. Market Attractiveness Analysis By Sales Channel
11. Global Powdered Soft Drinks Market Analysis 2017-2021 and Forecast 2022-2032, By Packaging
11.1. Introduction / Key Findings
11.2. Historical Market Size (USD Bn) and Volume Analysis By Packaging, 2017-2021
11.3. Current and Future Market Size (USD Bn) and Volume Analysis and Forecast By Packaging, 2022-2032
11.3.1. Carton Boxes
11.3.2. Pouches & Sachets
11.3.3. Cans
11.3.4. Bulk Packaging
11.4. Market Attractiveness Analysis By Packaging
12. Global Powdered Soft Drinks Market Analysis 2017-2021 and Forecast 2022-2032, By Region
12.1. Introduction
12.2. Historical Market Size (USD Bn) and Volume Analysis By Region, 2017-2021
12.3. Current Market Size (USD Bn) and Volume Analysis and Forecast By Region, 2022-2032
12.3.1. North America
12.3.2. Latin America
12.3.3. Europe
12.3.4. East Asia
12.3.5. South Asia
12.3.6. Oceania
12.3.7. Middle East & Africa
12.4. Market Attractiveness Analysis By Region
13. North America Powdered Soft Drinks Market Analysis 2017-2021 and Forecast 2022-2032
13.1. Introduction
13.2. Pricing Analysis
13.3. Historical Market Size (USD Bn) and Volume Trend Analysis By Market Taxonomy, 2017-2021
13.4. Market Size (USD Bn) and Volume Forecast By Market Taxonomy, 2022-2032
13.4.1. By Country
13.4.1.1. US
13.4.1.2. Canada
13.4.2. By Flavor
13.4.3. By End Use
13.4.4. By Sales Channel
13.4.5. By Packaging
13.5. Market Attractiveness Analysis
13.5.1. By Flavor
13.5.2. By End Use
13.5.3. By Sales Channel
13.5.4. By Packaging
13.6. Market Trends
13.7. Key Market Participants - Intensity Mapping
13.8. Drivers and Restraints - Impact Analysis
14. Latin America Powdered Soft Drinks Market Analysis 2017-2021 and Forecast 2022-2032
14.1. Introduction
14.2. Pricing Analysis
14.3. Historical Market Size (USD Bn) and Volume Trend Analysis By Market Taxonomy, 2017-2021
14.4. Market Size (USD Bn) and Volume Forecast By Market Taxonomy, 2022-2032
14.4.1. By Country
14.4.1.1. Brazil
14.4.1.2. Mexico
14.4.1.3. Rest of Latin America
14.4.2. By Flavor
14.4.3. By End Use
14.4.4. By Sales Channel
14.4.5. By Packaging
14.5. Market Attractiveness Analysis
14.5.1. By Flavor
14.5.2. By End Use
14.5.3. By Sales Channel
14.5.4. By Packaging
14.6. Market Trends
14.7. Key Market Participants - Intensity Mapping
14.8. Drivers and Restraints - Impact Analysis
15. Europe Powdered Soft Drinks Market Analysis 2017-2021 and Forecast 2022-2032
15.1. Introduction
15.2. Pricing Analysis
15.3. Historical Market Size (USD Bn) and Volume Trend Analysis By Market Taxonomy, 2017-2021
15.4. Market Size (USD Bn) and Volume Forecast By Market Taxonomy, 2022-2032
15.4.1. By Country
15.4.1.1. Germany
15.4.1.2. Italy
15.4.1.3. France
15.4.1.4. UK
15.4.1.5. Spain
15.4.1.6. BENELUX
15.4.1.7. Nordic
15.4.1.8. Russia
15.4.1.9. Poland
15.4.1.10. Rest of Eastern Europe
15.4.2. By Flavor
15.4.3. By End Use
15.4.4. By Sales Channel
15.4.5. By Packaging
15.5. Market Attractiveness Analysis
15.5.1. By Flavor
15.5.2. By End Use
15.5.3. By Sales Channel
15.5.4. By Packaging
15.6. Market Trends
15.7. Key Market Participants - Intensity Mapping
15.8. Drivers and Restraints - Impact Analysis
16. East Asia Powdered Soft Drinks Market Analysis 2017-2021 and Forecast 2022-2032
16.1. Introduction
16.2. Pricing Analysis
16.3. Historical Market Size (USD Bn) and Volume Trend Analysis By Market Taxonomy, 2017-2021
16.4. Market Size (USD Bn) and Volume Forecast By Market Taxonomy, 2022-2032
16.4.1. By Country
16.4.1.1. China
16.4.1.2. Japan
16.4.1.3. Korea
16.4.2. By Flavor
16.4.3. By End Use
16.4.4. By Sales Channel
16.4.5. By Packaging
16.5. Market Attractiveness Analysis
16.5.1. By Flavor
16.5.2. By End Use
16.5.3. By Sales Channel
16.5.4. By Packaging
16.6. Market Trends
16.7. Key Market Participants - Intensity Mapping
16.8. Drivers and Restraints - Impact Analysis
17. South Asia Powdered Soft Drinks Market Analysis 2017-2021 and Forecast 2022-2032
17.1. Introduction
17.2. Pricing Analysis
17.3. Historical Market Size (USD Bn) and Volume Trend Analysis By Market Taxonomy, 2017-2021
17.4. Market Size (USD Bn) and Volume Forecast By Market Taxonomy, 2022-2032
17.4.1. By Country
17.4.1.1. Indonesia
17.4.1.2. Malaysia
17.4.1.3. Singapore
17.4.1.4. India
17.4.1.5. Taiwan
17.4.1.6. Thailand
17.4.1.7. Rest of ASEAN countries
17.4.2. By Flavor
17.4.3. By End Use
17.4.4. By Sales Channel
17.4.5. By Packaging
17.5. Market Attractiveness Analysis
17.5.1. By Flavor
17.5.2. By End Use
17.5.3. By Sales Channel
17.5.4. By Packaging
17.6. Market Trends
17.7. Key Market Participants - Intensity Mapping
17.8. Drivers and Restraints - Impact Analysis
18. Oceania Powdered Soft Drinks Market Analysis 2017-2021 and Forecast 2022-2032
18.1. Introduction
18.2. Pricing Analysis
18.3. Historical Market Size (USD Bn) and Volume Trend Analysis By Market Taxonomy, 2017-2021
18.4. Market Size (USD Bn) and Volume Forecast By Market Taxonomy, 2022-2032
18.4.1. By Country
18.4.1.1. Australia
18.4.1.2. New Zealand
18.4.2. By Flavor
18.4.3. By End Use
18.4.4. By Sales Channel
18.4.5. By Packaging
18.5. Market Attractiveness Analysis
18.5.1. By Flavor
18.5.2. By End Use
18.5.3. By Sales Channel
18.5.4. By Packaging
18.6. Market Trends
18.7. Key Market Participants - Intensity Mapping
18.8. Drivers and Restraints - Impact Analysis
19. Middle East and Africa Powdered Soft Drinks Market Analysis 2017-2021 and Forecast 2022-2032
19.1. Introduction
19.2. Pricing Analysis
19.3. Historical Market Size (USD Bn) and Volume Trend Analysis By Market Taxonomy, 2017-2021
19.4. Market Size (USD Bn) and Volume Forecast By Market Taxonomy, 2022-2032
19.4.1. By Country
19.4.1.1. GCC Countries
19.4.1.2. South Africa
19.4.1.3. Turkey
19.4.1.4. Rest of MEA
19.4.2. By Flavor
19.4.3. By End Use
19.4.4. By Sales Channel
19.4.5. By Packaging
19.5. Market Attractiveness Analysis
19.5.1. By Flavor
19.5.2. By End Use
19.5.3. By Sales Channel
19.5.4. By Packaging
19.6. Market Trends
19.7. Key Market Participants - Intensity Mapping
19.8. Drivers and Restraints - Impact Analysis
20. Key Countries Powdered Soft Drinks Market Analysis 2017–2021and Forecast 2022–2032
20.1. US
20.1.1. Pricing Analysis (2017, 2022, 2032)
20.1.2. Market Value and Volume Analysis 2017–2021and Forecast 2022–2032
20.1.2.1. By Flavor
20.1.2.2. By End Use
20.1.2.3. By Sales Channel
20.1.2.4. By Packaging
20.2. Canada
20.2.1. Pricing Analysis (2017, 2022, 2032)
20.2.2. Market Value and Volume Analysis 2017–2021and Forecast 2022–2032
20.2.2.1. By Flavor
20.2.2.2. By End Use
20.2.2.3. By Sales Channel
20.2.2.4. By Packaging
20.3. By Source Germany
20.3.1. Pricing Analysis (2017, 2022, 2032)
20.3.2. Market Value and Volume Analysis 2017–2021and Forecast 2022–2032
20.3.2.1. By Flavor
20.3.2.2. By End Use
20.3.2.3. By Sales Channel
20.3.2.4. By Packaging
20.4. Italy
20.4.1. Pricing Analysis (2017, 2022, 2032)
20.4.2. Market Value and Volume Analysis 2017–2021and Forecast 2022–2032
20.4.2.1. By Flavor
20.4.2.2. By End Use
20.4.2.3. By Sales Channel
20.4.2.4. By Packaging
20.5. France
20.5.1. Pricing Analysis (2017, 2022, 2032)
20.5.2. Market Value and Volume Analysis 2017–2021and Forecast 2022–2032
20.5.2.1. By Flavor
20.5.2.2. By End Use
20.5.2.3. By Sales Channel
20.5.2.4. By Packaging
20.6. UK
20.6.1. Pricing Analysis (2017, 2022, 2032)
20.6.2. Market Value and Volume Analysis 2017–2021and Forecast 2022–2032
20.6.2.1. By Flavor
20.6.2.2. By End Use
20.6.2.3. By Sales Channel
20.6.2.4. By Packaging
20.7. BENELUX
20.7.1. Pricing Analysis (2017, 2022, 2032)
20.7.2. Market Value and Volume Analysis 2017–2021and Forecast 2022–2032
20.7.2.1. By Flavor
20.7.2.2. By End Use
20.7.2.3. By Sales Channel
20.7.2.4. By Packaging
20.8. By Source Nordic
20.8.1. Pricing Analysis (2017, 2022, 2032)
20.8.2. Market Value and Volume Analysis 2017–2021and Forecast 2022–2032
20.8.2.1. By Flavor
20.8.2.2. By End Use
20.8.2.3. By Sales Channel
20.8.2.4. By Packaging
20.9. China
20.9.1. Pricing Analysis (2017, 2022, 2032)
20.9.2. Market Value and Volume Analysis 2017–2021and Forecast 2022–2032
20.9.2.1. By Flavor
20.9.2.2. By End Use
20.9.2.3. By Sales Channel
20.9.2.4. By Packaging
20.10. Japan
20.10.1. Pricing Analysis (2017, 2022, 2032)
20.10.2. Market Value and Volume Analysis 2017–2021and Forecast 2022–2032
20.10.2.1. By Flavor
20.10.2.2. By End Use
20.10.2.3. By Sales Channel
20.10.2.4. By Packaging
20.11. India
20.11.1. Pricing Analysis (2017, 2022, 2032)
20.11.2. Market Value and Volume Analysis 2017–2021and Forecast 2022–2032
20.11.2.1. By Flavor
20.11.2.2. By End Use
20.11.2.3. By Sales Channel
20.11.2.4. By Packaging
20.12. Taiwan
20.12.1. Pricing Analysis (2017, 2022, 2032)
20.12.2. Market Value and Volume Analysis 2017–2021and Forecast 2022–2032
20.12.2.1. By Flavor
20.12.2.2. By End Use
20.12.2.3. By Sales Channel
20.12.2.4. By Packaging
20.13. Korea
20.13.1. Pricing Analysis (2017, 2022, 2032)
20.13.2. Market Value and Volume Analysis 2017–2021and Forecast 2022–2032
20.13.2.1. By Flavor
20.13.2.2. By End Use
20.13.2.3. By Sales Channel
20.13.2.4. By Packaging
20.14. Indonesia
20.14.1. Pricing Analysis (2017, 2022, 2032)
20.14.2. Market Value and Volume Analysis 2017–2021and Forecast 2022–2032
20.14.2.1. By Flavor
20.14.2.2. By End Use
20.14.2.3. By Sales Channel
20.14.2.4. By Packaging
20.15. Malaysia
20.15.1. Pricing Analysis (2017, 2022, 2032)
20.15.2. Market Value and Volume Analysis 2017–2021and Forecast 2022–2032
20.15.2.1. By Flavor
20.15.2.2. By End Use
20.15.2.3. By Sales Channel
20.15.2.4. By Packaging
20.16. Singapore
20.16.1. Pricing Analysis (2017, 2022, 2032)
20.16.2. Market Value and Volume Analysis 2017–2021and Forecast 2022–2032
20.16.2.1. By Flavor
20.16.2.2. By End Use
20.16.2.3. By Sales Channel
20.16.2.4. By Packaging
20.17. Thailand
20.17.1. Pricing Analysis (2017, 2022, 2032)
20.17.2. Market Value and Volume Analysis 2017–2021and Forecast 2022–2032
20.17.2.1. By Flavor
20.17.2.2. By End Use
20.17.2.3. By Sales Channel
20.17.2.4. By Packaging
20.18. Australia
20.18.1. Pricing Analysis (2017, 2022, 2032)
20.18.2. Market Value and Volume Analysis 2017–2021and Forecast 2022–2032
20.18.2.1. By Flavor
20.18.2.2. By End Use
20.18.2.3. By Sales Channel
20.18.2.4. By Packaging
20.19. New Zealand
20.19.1. Pricing Analysis (2017, 2022, 2032)
20.19.2. Market Value and Volume Analysis 2017–2021and Forecast 2022–2032
20.19.2.1. By Flavor
20.19.2.2. By End Use
20.19.2.3. By Sales Channel
20.19.2.4. By Packaging
20.20. GCC Countries
20.20.1. Pricing Analysis (2017, 2022, 2032)
20.20.2. Market Value and Volume Analysis 2017–2021and Forecast 2022–2032
20.20.2.1. By Flavor
20.20.2.2. By End Use
20.20.2.3. By Sales Channel
20.20.2.4. By Packaging
20.21. South Africa
20.21.1. Pricing Analysis (2017, 2022, 2032)
20.21.2. Market Value and Volume Analysis 2017–2021and Forecast 2022–2032
20.21.2.1. By Flavor
20.21.2.2. By End Use
20.21.2.3. By Sales Channel
20.21.2.4. By Packaging
21. Market Structure Analysis
21.1. Market Analysis by Tier of Companies
21.2. Company Share Analysis of Top Players
21.2.1. By Flavor
21.2.2. By Region
21.3. Market Presence Analysis
21.3.1. By Regional Footprint of Players
21.3.2. Base Footprint by Players
21.3.3. Channel Footprint by Players
22. Competition Deep Dive (Tentative List)
22.1. Competition Deep Dive
22.1.1. Dr. Pepper Snapple Group, Inc.
22.1.1.1. Base Portfolio
22.1.1.2. Profitability by Market Segments
22.1.1.3. Sales Footprint
22.1.1.4. Strategy Overview
22.1.1.5. Base Strategy
22.1.2. PepsiCo, Inc.
22.1.2.1. Base Portfolio
22.1.2.2. Profitability by Market Segments
22.1.2.3. Sales Footprint
22.1.2.4. Strategy Overview
22.1.2.5. Base Strategy
22.1.3. Kraft Heinz
22.1.3.1. Base Portfolio
22.1.3.2. Profitability by Market Segments
22.1.3.3. Sales Footprint
22.1.3.4. Strategy Overview
22.1.3.5. Base Strategy
22.1.4. Mondelez, Inc.
22.1.4.1. Base Portfolio
22.1.4.2. Profitability by Market Segments
22.1.4.3. Sales Footprint
22.1.4.4. Strategy Overview
22.1.4.5. Base Strategy
22.1.5. US Foods, Inc.
22.1.5.1. Base Portfolio
22.1.5.2. Profitability by Market Segments
22.1.5.3. Sales Footprint
22.1.5.4. Strategy Overview
22.1.5.5. Base Strategy
22.1.6. Continental Mills, Inc.
22.1.6.1. Base Portfolio
22.1.6.2. Profitability by Market Segments
22.1.6.3. Sales Footprint
22.1.6.4. Strategy Overview
22.1.6.5. Base Strategy
22.1.7. Arizona Beverage Company
22.1.7.1. Base Portfolio
22.1.7.2. Profitability by Market Segments
22.1.7.3. Sales Footprint
22.1.7.4. Strategy Overview
22.1.7.5. Base Strategy
22.1.8. National Beverage Corporation
22.1.8.1. Base Portfolio
22.1.8.2. Profitability by Market Segments
22.1.8.3. Sales Footprint
22.1.8.4. Strategy Overview
22.1.8.5. Base Strategy
22.1.9. Kerry Plc
22.1.9.1. Base Portfolio
22.1.9.2. Profitability by Market Segments
22.1.9.3. Sales Footprint
22.1.9.4. Strategy Overview
22.1.9.5. Base Strategy
22.1.10. Insta Foods
22.1.10.1. Base Portfolio
22.1.10.2. Profitability by Market Segments
22.1.10.3. Sales Footprint
22.1.10.4. Strategy Overview
22.1.10.5. Base Strategy
22.1.11. Sugam Products
22.1.11.1. Base Portfolio
22.1.11.2. Profitability by Market Segments
22.1.11.3. Sales Footprint
22.1.11.4. Strategy Overview
22.1.11.5. Base Strategy
22.1.12. Others on Additional Request
22.1.12.1. Base Portfolio
22.1.12.2. Profitability by Market Segments
22.1.12.3. Sales Footprint
22.1.12.4. Strategy Overview
22.1.12.5. Base Strategy
Note: Above list is subjected to change during the course of study
23. Assumptions and Acronyms Used
24. Research Methodology
Let us know your requirement to get
100% FREE customization
Table 1: Global Powdered Soft Drink Market Value (US$ Mn) and Forecast by Region, 2017–2021
Table 2: Global Powdered Soft Drink Market Value (US$ Mn) and Forecast by Region, 2022–2032
Table 3: Global Powdered Soft Drink Market Volume (MT ) and Forecast by Region, 2017–2021
Table 4: Global Powdered Soft Drink Market Volume (MT ) and Forecast by Region, 2022–2032
Table 5: Global Powdered Soft Drink Market Value (US$ Mn) and Forecast by Flavor , 2017–2021
Table 6: Global Powdered Soft Drink Market Value (US$ Mn) and Forecast by Flavor , 2022–2032
Table 7: Global Powdered Soft Drink Market Volume (MT ) and Forecast by Flavor , 2017–2021
Table 8: Global Powdered Soft Drink Market Volume (MT ) and Forecast by Flavor , 2022–2032
Table 9: Global Powdered Soft Drink Market Value (US$ Mn) and Forecast by End Use , 2017–2021
Table 10: Global Powdered Soft Drink Market Value (US$ Mn) and Forecast by End Use , 2022–2032
Table 11: Global Powdered Soft Drink Market Volume (MT ) and Forecast by End Use , 2017–2021
Table 12: Global Powdered Soft Drink Market Volume (MT ) and Forecast by End Use , 2022–2032
Table 13: Global Powdered Soft Drink Market Value (US$ Mn) and Forecast by Sales Channel, 2017–2021
Table 14: Global Powdered Soft Drink Market Value (US$ Mn) and Forecast by Sales Channel, 2022–2032
Table 15: Global Powdered Soft Drink Market Volume (MT ) and Forecast by Sales Channel, 2017–2021
Table 16: Global Powdered Soft Drink Market Volume (MT ) and Forecast by Sales Channel, 2022–2032
Table 17: Global Powdered Soft Drink Market Value (US$ Mn) and Forecast by Packaging, 2017–2021
Table 18: Global Powdered Soft Drink Market Value (US$ Mn) and Forecast by Packaging, 2022–2032
Table 19: Global Powdered Soft Drink Market Volume (MT ) and Forecast by Packaging, 2017–2021
Table 20: Global Powdered Soft Drink Market Volume (MT ) and Forecast by Packaging, 2022–2032
Table 21: North America Powdered Soft Drink Market Value (US$ Mn) and Forecast by Country, 2017–2021
Table 22: North America Powdered Soft Drink Market Value (US$ Mn) and Forecast by Country, 2022–2032
Table 23: North America Powdered Soft Drink Market Volume (MT ) and Forecast by Country, 2017–2021
Table 24: North America Powdered Soft Drink Market Volume (MT ) and Forecast by Country, 2022–2032
Table 25: North America Powdered Soft Drink Market Value (US$ Mn) and Forecast by Flavor , 2017–2021
Table 26: North America Powdered Soft Drink Market Value (US$ Mn) and Forecast by Flavor , 2022–2032
Table 27: North America Powdered Soft Drink Market Volume (MT ) and Forecast by Flavor , 2017–2021
Table 28: North America Powdered Soft Drink Market Volume (MT ) and Forecast by Flavor , 2022–2032
Table 29: North America Powdered Soft Drink Market Value (US$ Mn) and Forecast by End Use , 2017–2021
Table 30: North America Powdered Soft Drink Market Value (US$ Mn) and Forecast by End Use , 2022–2032
Table 31: North America Powdered Soft Drink Market Volume (MT ) and Forecast by End Use , 2017–2021
Table 32: North America Powdered Soft Drink Market Volume (MT ) and Forecast by End Use , 2022–2032
Table 33: North America Powdered Soft Drink Market Value (US$ Mn) and Forecast by Sales Channel, 2017–2021
Table 34: North America Powdered Soft Drink Market Value (US$ Mn) and Forecast by Sales Channel, 2022–2032
Table 35: North America Powdered Soft Drink Market Volume (MT ) and Forecast by Sales Channel, 2017–2021
Table 36: North America Powdered Soft Drink Market Volume (MT ) and Forecast by Sales Channel, 2022–2032
Table 37: North America Powdered Soft Drink Market Value (US$ Mn) and Forecast by Packaging, 2017–2021
Table 38: North America Powdered Soft Drink Market Value (US$ Mn) and Forecast by Packaging, 2022–2032
Table 39: North America Powdered Soft Drink Market Volume (MT ) and Forecast by Packaging, 2017–2021
Table 40: North America Powdered Soft Drink Market Volume (MT ) and Forecast by Packaging, 2022–2032
Table 41: Latin America Powdered Soft Drink Market Value (US$ Mn) and Forecast by Country, 2017–2021
Table 42: Latin America Powdered Soft Drink Market Value (US$ Mn) and Forecast by Country, 2022–2032
Table 43: Latin America Powdered Soft Drink Market Volume (MT ) and Forecast by Country, 2017–2021
Table 44: Latin America Powdered Soft Drink Market Volume (MT ) and Forecast by Country, 2022–2032
Table 45: Latin America Powdered Soft Drink Market Value (US$ Mn) and Forecast by Flavor , 2017–2021
Table 46: Latin America Powdered Soft Drink Market Value (US$ Mn) and Forecast by Flavor , 2022–2032
Table 47: Latin America Powdered Soft Drink Market Volume (MT ) and Forecast by Flavor , 2017–2021
Table 48: Latin America Powdered Soft Drink Market Volume (MT ) and Forecast by Flavor , 2022–2032
Table 49: Latin America Powdered Soft Drink Market Value (US$ Mn) and Forecast by End Use , 2017–2021
Table 50: Latin America Powdered Soft Drink Market Value (US$ Mn) and Forecast by End Use , 2022–2032
Table 51: Latin America Powdered Soft Drink Market Volume (MT ) and Forecast by End Use , 2017–2021
Table 52: Latin America Powdered Soft Drink Market Volume (MT ) and Forecast by End Use , 2022–2032
Table 53: Latin America Powdered Soft Drink Market Value (US$ Mn) and Forecast by Sales Channel, 2017–2021
Table 54: Latin America Powdered Soft Drink Market Value (US$ Mn) and Forecast by Sales Channel, 2022–2032
Table 55: Latin America Powdered Soft Drink Market Volume (MT ) and Forecast by Sales Channel, 2017–2021
Table 56: Latin America Powdered Soft Drink Market Volume (MT ) and Forecast by Sales Channel, 2022–2032
Table 57: Latin America Powdered Soft Drink Market Value (US$ Mn) and Forecast by Packaging, 2017–2021
Table 58: Latin America Powdered Soft Drink Market Value (US$ Mn) and Forecast by Packaging, 2022–2032
Table 59: Latin America Powdered Soft Drink Market Volume (MT ) and Forecast by Packaging, 2017–2021
Table 60: Latin America Powdered Soft Drink Market Volume (MT ) and Forecast by Packaging, 2022–2032
Table 61: Europe Powdered Soft Drink Market Value (US$ Mn) and Forecast by Country, 2017–2021
Table 62: Europe Powdered Soft Drink Market Value (US$ Mn) and Forecast by Country, 2022–2032
Table 63: Europe Powdered Soft Drink Market Volume (MT ) and Forecast by Country, 2017–2021
Table 64: Europe Powdered Soft Drink Market Volume (MT ) and Forecast by Country, 2022–2032
Table 65: Europe Powdered Soft Drink Market Value (US$ Mn) and Forecast by Flavor , 2017–2021
Table 66: Europe Powdered Soft Drink Market Value (US$ Mn) and Forecast by Flavor , 2022–2032
Table 67: Europe Powdered Soft Drink Market Volume (MT ) and Forecast by Flavor , 2017–2021
Table 68: Europe Powdered Soft Drink Market Volume (MT ) and Forecast by Flavor , 2022–2032
Table 69: Europe Powdered Soft Drink Market Value (US$ Mn) and Forecast by End Use , 2017–2021
Table 70: Europe Powdered Soft Drink Market Value (US$ Mn) and Forecast by End Use , 2022–2032
Table 71: Europe Powdered Soft Drink Market Volume (MT ) and Forecast by End Use , 2017–2021
Table 72: Europe Powdered Soft Drink Market Volume (MT ) and Forecast by End Use , 2022–2032
Table 73: Europe Powdered Soft Drink Market Value (US$ Mn) and Forecast by Sales Channel, 2017–2021
Table 74: Europe Powdered Soft Drink Market Value (US$ Mn) and Forecast by Sales Channel, 2022–2032
Table 75: Europe Powdered Soft Drink Market Volume (MT ) and Forecast by Sales Channel, 2017–2021
Table 76: Europe Powdered Soft Drink Market Volume (MT ) and Forecast by Sales Channel, 2022–2032
Table 77: Europe Powdered Soft Drink Market Value (US$ Mn) and Forecast by Packaging, 2017–2021
Table 78: Europe Powdered Soft Drink Market Value (US$ Mn) and Forecast by Packaging, 2022–2032
Table 79: Europe Powdered Soft Drink Market Volume (MT ) and Forecast by Packaging, 2017–2021
Table 80: Europe Powdered Soft Drink Market Volume (MT ) and Forecast by Packaging, 2022–2032
Table 81: East Asia Powdered Soft Drink Market Value (US$ Mn) and Forecast by Country, 2017–2021
Table 82: East Asia Powdered Soft Drink Market Value (US$ Mn) and Forecast by Country, 2022–2032
Table 83: East Asia Powdered Soft Drink Market Volume (MT ) and Forecast by Country, 2017–2021
Table 84: East Asia Powdered Soft Drink Market Volume (MT ) and Forecast by Country, 2022–2032
Table 85: East Asia Powdered Soft Drink Market Value (US$ Mn) and Forecast by Flavor , 2017–2021
Table 86: East Asia Powdered Soft Drink Market Value (US$ Mn) and Forecast by Flavor , 2022–2032
Table 87: East Asia Powdered Soft Drink Market Volume (MT ) and Forecast by Flavor , 2017–2021
Table 88: East Asia Powdered Soft Drink Market Volume (MT ) and Forecast by Flavor , 2022–2032
Table 89: East Asia Powdered Soft Drink Market Value (US$ Mn) and Forecast by End Use , 2017–2021
Table 90: East Asia Powdered Soft Drink Market Value (US$ Mn) and Forecast by End Use , 2022–2032
Table 91: East Asia Powdered Soft Drink Market Volume (MT ) and Forecast by End Use , 2017–2021
Table 92: East Asia Powdered Soft Drink Market Volume (MT ) and Forecast by End Use , 2022–2032
Table 93: East Asia Powdered Soft Drink Market Value (US$ Mn) and Forecast by Sales Channel, 2017–2021
Table 94: East Asia Powdered Soft Drink Market Value (US$ Mn) and Forecast by Sales Channel, 2022–2032
Table 95: East Asia Powdered Soft Drink Market Volume (MT ) and Forecast by Sales Channel, 2017–2021
Table 96: East Asia Powdered Soft Drink Market Volume (MT ) and Forecast by Sales Channel, 2022–2032
Table 97: East Asia Powdered Soft Drink Market Value (US$ Mn) and Forecast by Packaging, 2017–2021
Table 98: East Asia Powdered Soft Drink Market Value (US$ Mn) and Forecast by Packaging, 2022–2032
Table 99: East Asia Powdered Soft Drink Market Volume (MT ) and Forecast by Packaging, 2017–2021
Table 100: East Asia Powdered Soft Drink Market Volume (MT ) and Forecast by Packaging, 2022–2032
Table 101: South Asia Powdered Soft Drink Market Value (US$ Mn) and Forecast by Country, 2017–2021
Table 102: South Asia Powdered Soft Drink Market Value (US$ Mn) and Forecast by Country, 2022–2032
Table 103: South Asia Powdered Soft Drink Market Volume (MT ) and Forecast by Country, 2017–2021
Table 104: South Asia Powdered Soft Drink Market Volume (MT ) and Forecast by Country, 2022–2032
Table 105: South Asia Powdered Soft Drink Market Value (US$ Mn) and Forecast by Flavor , 2017–2021
Table 106: South Asia Powdered Soft Drink Market Value (US$ Mn) and Forecast by Flavor , 2022–2032
Table 107: South Asia Powdered Soft Drink Market Volume (MT ) and Forecast by Flavor , 2017–2021
Table 108: South Asia Powdered Soft Drink Market Volume (MT ) and Forecast by Flavor , 2022–2032
Table 109: South Asia Powdered Soft Drink Market Value (US$ Mn) and Forecast by End Use , 2017–2021
Table 110: South Asia Powdered Soft Drink Market Value (US$ Mn) and Forecast by End Use , 2022–2032
Table 111: South Asia Powdered Soft Drink Market Volume (MT ) and Forecast by End Use , 2017–2021
Table 112: South Asia Powdered Soft Drink Market Volume (MT ) and Forecast by End Use , 2022–2032
Table 113: South Asia Powdered Soft Drink Market Value (US$ Mn) and Forecast by Sales Channel, 2017–2021
Table 114: South Asia Powdered Soft Drink Market Value (US$ Mn) and Forecast by Sales Channel, 2022–2032
Table 115: South Asia Powdered Soft Drink Market Volume (MT ) and Forecast by Sales Channel, 2017–2021
Table 116: South Asia Powdered Soft Drink Market Volume (MT ) and Forecast by Sales Channel, 2022–2032
Table 117: South Asia Powdered Soft Drink Market Value (US$ Mn) and Forecast by Packaging, 2017–2021
Table 118: South Asia Powdered Soft Drink Market Value (US$ Mn) and Forecast by Packaging, 2022–2032
Table 119: South Asia Powdered Soft Drink Market Volume (MT ) and Forecast by Packaging, 2017–2021
Table 120: South Asia Powdered Soft Drink Market Volume (MT ) and Forecast by Packaging, 2022–2032
Table 121: Oceania Powdered Soft Drink Market Value (US$ Mn) and Forecast by Country, 2017–2021
Table 122: Oceania Powdered Soft Drink Market Value (US$ Mn) and Forecast by Country, 2022–2032
Table 123: Oceania Powdered Soft Drink Market Volume (MT ) and Forecast by Country, 2017–2021
Table 124: Oceania Powdered Soft Drink Market Volume (MT ) and Forecast by Country, 2022–2032
Table 125: Oceania Powdered Soft Drink Market Value (US$ Mn) and Forecast by Flavor , 2017–2021
Table 126: Oceania Powdered Soft Drink Market Value (US$ Mn) and Forecast by Flavor , 2022–2032
Table 127: Oceania Powdered Soft Drink Market Volume (MT ) and Forecast by Flavor , 2017–2021
Table 128: Oceania Powdered Soft Drink Market Volume (MT ) and Forecast by Flavor , 2022–2032
Table 129: Oceania Powdered Soft Drink Market Value (US$ Mn) and Forecast by End Use , 2017–2021
Table 130: Oceania Powdered Soft Drink Market Value (US$ Mn) and Forecast by End Use , 2022–2032
Table 131: Oceania Powdered Soft Drink Market Volume (MT ) and Forecast by End Use , 2017–2021
Table 132: Oceania Powdered Soft Drink Market Volume (MT ) and Forecast by End Use , 2022–2032
Table 133: Oceania Powdered Soft Drink Market Value (US$ Mn) and Forecast by Sales Channel, 2017–2021
Table 134: Oceania Powdered Soft Drink Market Value (US$ Mn) and Forecast by Sales Channel, 2022–2032
Table 135: Oceania Powdered Soft Drink Market Volume (MT ) and Forecast by Sales Channel, 2017–2021
Table 136: Oceania Powdered Soft Drink Market Volume (MT ) and Forecast by Sales Channel, 2022–2032
Table 137: Oceania Powdered Soft Drink Market Value (US$ Mn) and Forecast by Packaging, 2017–2021
Table 138: Oceania Powdered Soft Drink Market Value (US$ Mn) and Forecast by Packaging, 2022–2032
Table 139: Oceania Powdered Soft Drink Market Volume (MT ) and Forecast by Packaging, 2017–2021
Table 140: Oceania Powdered Soft Drink Market Volume (MT ) and Forecast by Packaging, 2022–2032
Table 141: MEA Powdered Soft Drink Market Value (US$ Mn) and Forecast by Country, 2017–2021
Table 142: MEA Powdered Soft Drink Market Value (US$ Mn) and Forecast by Country, 2022–2032
Table 143: MEA Powdered Soft Drink Market Volume (MT ) and Forecast by Country, 2017–2021
Table 144: MEA Powdered Soft Drink Market Volume (MT ) and Forecast by Country, 2022–2032
Table 145: MEA Powdered Soft Drink Market Value (US$ Mn) and Forecast by Flavor , 2017–2021
Table 146: MEA Powdered Soft Drink Market Value (US$ Mn) and Forecast by Flavor , 2022–2032
Table 147: MEA Powdered Soft Drink Market Volume (MT ) and Forecast by Flavor , 2017–2021
Table 148: MEA Powdered Soft Drink Market Volume (MT ) and Forecast by Flavor , 2022–2032
Table 149: MEA Powdered Soft Drink Market Value (US$ Mn) and Forecast by End Use , 2017–2021
Table 150: MEA Powdered Soft Drink Market Value (US$ Mn) and Forecast by End Use , 2022–2032
Table 151: MEA Powdered Soft Drink Market Volume (MT ) and Forecast by End Use , 2017–2021
Table 152: MEA Powdered Soft Drink Market Volume (MT ) and Forecast by End Use , 2022–2032
Table 153: MEA Powdered Soft Drink Market Value (US$ Mn) and Forecast by Sales Channel, 2017–2021
Table 154: MEA Powdered Soft Drink Market Value (US$ Mn) and Forecast by Sales Channel, 2022–2032
Table 155: MEA Powdered Soft Drink Market Volume (MT ) and Forecast by Sales Channel, 2017–2021
Table 156: MEA Powdered Soft Drink Market Volume (MT ) and Forecast by Sales Channel, 2022–2032
Table 157: MEA Powdered Soft Drink Market Value (US$ Mn) and Forecast by Packaging, 2017–2021
Table 158: MEA Powdered Soft Drink Market Value (US$ Mn) and Forecast by Packaging, 2022–2032
Table 159: MEA Powdered Soft Drink Market Volume (MT ) and Forecast by Packaging, 2017–2021
Table 160: MEA Powdered Soft Drink Market Volume (MT ) and Forecast by Packaging, 2022–2032
Find your sweet spots for generating winning opportunities in this market.
Talk to AnalystFigure 1: Global Powdered Soft Drink Market Value (USD Mn) and Volume (MT) Forecast, 2022-2032
Figure 2: Global Powdered Soft Drink Market Absolute $ Opportunity (USD Mn), 2022-2032
Figure 3: Global Powdered Soft Drink Market Value (USD Mn) and % Growth by Region, 2022 & 2032
Figure 4: Global Powdered Soft Drink Market Y-o-Y Growth Rate by Region, 2022-2032
Figure 5: Global Powdered Soft Drink Market Value (USD Mn) and % Growth by Flavor, 2022 & 2032
Figure 6: Global Powdered Soft Drink Market Y-o-Y Growth Rate by Flavor, 2022-2032
Figure 7: Global Powdered Soft Drink Market Value (USD Mn) and % Growth by End Use, 2022 & 2032
Figure 8: Global Powdered Soft Drink Market Y-o-Y Growth Rate by End Use, 2022-2032
Figure 9: Global Powdered Soft Drink Market Value (USD Mn) and % Growth by Sales Channel, 2022 & 2032
Figure 10: Global Powdered Soft Drink Market Y-o-Y Growth Rate by Sales Channel, 2022-2032
Figure 11: Global Powdered Soft Drink Market Value (USD Mn) and % Growth by Packaging, 2022 & 2032
Figure 12: Global Powdered Soft Drink Market Y-o-Y Growth Rate by Packaging, 2022-2032
Figure 13: Global Powdered Soft Drink Market Value (USD Mn) and % Growth by Source, 2022 & 2032
Figure 14: Global Powdered Soft Drink Market Attractiveness Analysis by Region, 2022-2032
Figure 15: Global Powdered Soft Drink Market Attractiveness Analysis by Flavor, 2022-2032
Figure 16: Global Powdered Soft Drink Market Attractiveness Analysis by End Use, 2022-2032
Figure 17: Global Powdered Soft Drink Market Attractiveness Analysis by Sales Channel, 2022-2032
Figure 18: Global Powdered Soft Drink Market Attractiveness Analysis by Packaging, 2022-2032
Figure 19: North America Powdered Soft Drink Market Value (USD Mn) and Volume (MT) Forecast, 2022-2032
Figure 20: North America Powdered Soft Drink Market Absolute $ Opportunity (USD Mn), 2022-2032
Figure 21: North America Powdered Soft Drink Market Value (USD Mn) and % Growth by Country, 2022 & 2032
Figure 22: North America Powdered Soft Drink Market Y-o-Y Growth Rate by Country, 2022-2032
Figure 23: North America Powdered Soft Drink Market Value (USD Mn) and % Growth by Flavor, 2022 & 2032
Figure 24: North America Powdered Soft Drink Market Y-o-Y Growth Rate by Flavor, 2022-2032
Figure 25: North America Powdered Soft Drink Market Value (USD Mn) and % Growth by End Use, 2022 & 2032
Figure 26: North America Powdered Soft Drink Market Y-o-Y Growth Rate by End Use, 2022-2032
Figure 27: North America Powdered Soft Drink Market Value (USD Mn) and % Growth by Sales Channel, 2022 & 2032
Figure 28: North America Powdered Soft Drink Market Y-o-Y Growth Rate by Sales Channel, 2022-2032
Figure 29: North America Powdered Soft Drink Market Value (USD Mn) and % Growth by Packaging, 2022 & 2032
Figure 30: North America Powdered Soft Drink Market Y-o-Y Growth Rate by Packaging, 2022-2032
Figure 31: North America Powdered Soft Drink Market Value (USD Mn) and % Growth by Source, 2022 & 2032
Figure 32: North America Powdered Soft Drink Market Attractiveness Analysis by Country, 2022-2032
Figure 33: North America Powdered Soft Drink Market Attractiveness Analysis by Flavor, 2022-2032
Figure 34: North America Powdered Soft Drink Market Attractiveness Analysis by End Use, 2022-2032
Figure 35: North America Powdered Soft Drink Market Attractiveness Analysis by Sales Channel, 2022-2032
Figure 36: North America Powdered Soft Drink Market Attractiveness Analysis by Packaging, 2022-2032
Figure 37: Latin America Powdered Soft Drink Market Value (USD Mn) and Volume (MT) Forecast, 2022-2032
Figure 38: Latin America Powdered Soft Drink Market Absolute $ Opportunity (USD Mn), 2022-2032
Figure 39: Latin America Powdered Soft Drink Market Value (USD Mn) and % Growth by Country, 2022 & 2032
Figure 40: Latin America Powdered Soft Drink Market Y-o-Y Growth Rate by Country, 2022-2032
Figure 41: Latin America Powdered Soft Drink Market Value (USD Mn) and % Growth by Flavor, 2022 & 2032
Figure 42: Latin America Powdered Soft Drink Market Y-o-Y Growth Rate by Flavor, 2022-2032
Figure 43: Latin America Powdered Soft Drink Market Value (USD Mn) and % Growth by End Use, 2022 & 2032
Figure 44: Latin America Powdered Soft Drink Market Y-o-Y Growth Rate by End Use, 2022-2032
Figure 45: Latin America Powdered Soft Drink Market Value (USD Mn) and % Growth by Sales Channel, 2022 & 2032
Figure 46: Latin America Powdered Soft Drink Market Y-o-Y Growth Rate by Sales Channel, 2022-2032
Figure 47: Latin America Powdered Soft Drink Market Value (USD Mn) and % Growth by Packaging, 2022 & 2032
Figure 48: Latin America Powdered Soft Drink Market Y-o-Y Growth Rate by Packaging, 2022-2032
Figure 49: Latin America Powdered Soft Drink Market Value (USD Mn) and % Growth by Source, 2022 & 2032
Figure 50: Latin America Powdered Soft Drink Market Attractiveness Analysis by Country, 2022-2032
Figure 51: Latin America Powdered Soft Drink Market Attractiveness Analysis by Flavor, 2022-2032
Figure 52: Latin America Powdered Soft Drink Market Attractiveness Analysis by End Use, 2022-2032
Figure 53: Latin America Powdered Soft Drink Market Attractiveness Analysis by Sales Channel, 2022-2032
Figure 54: Latin America Powdered Soft Drink Market Attractiveness Analysis by Packaging, 2022-2032
Figure 55: Europe Powdered Soft Drink Market Value (USD Mn) and Volume (MT) Forecast, 2022-2032
Figure 56: Europe Powdered Soft Drink Market Absolute $ Opportunity (USD Mn), 2022-2032
Figure 57: Europe Powdered Soft Drink Market Value (USD Mn) and % Growth by Country, 2022 & 2032
Figure 58: Europe Powdered Soft Drink Market Y-o-Y Growth Rate by Country, 2022-2032
Figure 59: Europe Powdered Soft Drink Market Value (USD Mn) and % Growth by Flavor, 2022 & 2032
Figure 60: Europe Powdered Soft Drink Market Y-o-Y Growth Rate by Flavor, 2022-2032
Figure 61: Europe Powdered Soft Drink Market Value (USD Mn) and % Growth by End Use, 2022 & 2032
Figure 62: Europe Powdered Soft Drink Market Y-o-Y Growth Rate by End Use, 2022-2032
Figure 63: Europe Powdered Soft Drink Market Value (USD Mn) and % Growth by Sales Channel, 2022 & 2032
Figure 64: Europe Powdered Soft Drink Market Y-o-Y Growth Rate by Sales Channel, 2022-2032
Figure 65: Europe Powdered Soft Drink Market Value (USD Mn) and % Growth by Packaging, 2022 & 2032
Figure 66: Europe Powdered Soft Drink Market Y-o-Y Growth Rate by Packaging, 2022-2032
Figure 67: Europe Powdered Soft Drink Market Value (USD Mn) and % Growth by Source, 2022 & 2032
Figure 68: Europe Powdered Soft Drink Market Attractiveness Analysis by Country, 2022-2032
Figure 69: Europe Powdered Soft Drink Market Attractiveness Analysis by Flavor, 2022-2032
Figure 70: Europe Powdered Soft Drink Market Attractiveness Analysis by End Use, 2022-2032
Figure 71: Europe Powdered Soft Drink Market Attractiveness Analysis by Sales Channel, 2022-2032
Figure 72: Europe Powdered Soft Drink Market Attractiveness Analysis by Packaging, 2022-2032
Figure 73: East Asia Powdered Soft Drink Market Value (USD Mn) and Volume (MT) Forecast, 2022-2032
Figure 74: East Asia Powdered Soft Drink Market Absolute $ Opportunity (USD Mn), 2022-2032
Figure 75: East Asia Powdered Soft Drink Market Value (USD Mn) and % Growth by Country, 2022 & 2032
Figure 76: East Asia Powdered Soft Drink Market Y-o-Y Growth Rate by Country, 2022-2032
Figure 77: East Asia Powdered Soft Drink Market Value (USD Mn) and % Growth by Flavor, 2022 & 2032
Figure 78: East Asia Powdered Soft Drink Market Y-o-Y Growth Rate by Flavor, 2022-2032
Figure 79: East Asia Powdered Soft Drink Market Value (USD Mn) and % Growth by End Use, 2022 & 2032
Figure 80: East Asia Powdered Soft Drink Market Y-o-Y Growth Rate by End Use, 2022-2032
Figure 81: East Asia Powdered Soft Drink Market Value (USD Mn) and % Growth by Sales Channel, 2022 & 2032
Figure 82: East Asia Powdered Soft Drink Market Y-o-Y Growth Rate by Sales Channel, 2022-2032
Figure 83: East Asia Powdered Soft Drink Market Value (USD Mn) and % Growth by Packaging, 2022 & 2032
Figure 84: East Asia Powdered Soft Drink Market Y-o-Y Growth Rate by Packaging, 2022-2032
Figure 85: East Asia Powdered Soft Drink Market Value (USD Mn) and % Growth by Source, 2022 & 2032
Figure 86: East Asia Powdered Soft Drink Market Attractiveness Analysis by Country, 2022-2032
Figure 87: East Asia Powdered Soft Drink Market Attractiveness Analysis by Flavor, 2022-2032
Figure 88: East Asia Powdered Soft Drink Market Attractiveness Analysis by End Use, 2022-2032
Figure 89: East Asia Powdered Soft Drink Market Attractiveness Analysis by Sales Channel, 2022-2032
Figure 90: East Asia Powdered Soft Drink Market Attractiveness Analysis by Packaging, 2022-2032
Figure 91: South Asia Powdered Soft Drink Market Value (USD Mn) and Volume (MT) Forecast, 2022-2032
Figure 92: South Asia Powdered Soft Drink Market Absolute $ Opportunity (USD Mn), 2022-2032
Figure 93: South Asia Powdered Soft Drink Market Value (USD Mn) and % Growth by Country, 2022 & 2032
Figure 94: South Asia Powdered Soft Drink Market Y-o-Y Growth Rate by Country, 2022-2032
Figure 95: South Asia Powdered Soft Drink Market Value (USD Mn) and % Growth by Flavor, 2022 & 2032
Figure 96: South Asia Powdered Soft Drink Market Y-o-Y Growth Rate by Flavor, 2022-2032
Figure 97: South Asia Powdered Soft Drink Market Value (USD Mn) and % Growth by End Use, 2022 & 2032
Figure 98: South Asia Powdered Soft Drink Market Y-o-Y Growth Rate by End Use, 2022-2032
Figure 99: South Asia Powdered Soft Drink Market Value (USD Mn) and % Growth by Sales Channel, 2022 & 2032
Figure 100: South Asia Powdered Soft Drink Market Y-o-Y Growth Rate by Sales Channel, 2022-2032
Figure 101: South Asia Powdered Soft Drink Market Value (USD Mn) and % Growth by Packaging, 2022 & 2032
Figure 102: South Asia Powdered Soft Drink Market Y-o-Y Growth Rate by Packaging, 2022-2032
Figure 103: South Asia Powdered Soft Drink Market Value (USD Mn) and % Growth by Source, 2022 & 2032
Figure 104: South Asia Powdered Soft Drink Market Attractiveness Analysis by Country, 2022-2032
Figure 105: South Asia Powdered Soft Drink Market Attractiveness Analysis by Flavor, 2022-2032
Figure 106: South Asia Powdered Soft Drink Market Attractiveness Analysis by End Use, 2022-2032
Figure 107: South Asia Powdered Soft Drink Market Attractiveness Analysis by Sales Channel, 2022-2032
Figure 108: South Asia Powdered Soft Drink Market Attractiveness Analysis by Packaging, 2022-2032
Figure 109: Oceania Powdered Soft Drink Market Value (USD Mn) and Volume (MT) Forecast, 2022-2032
Figure 110: Oceania Powdered Soft Drink Market Absolute $ Opportunity (USD Mn), 2022-2032
Figure 111: Oceania Powdered Soft Drink Market Value (USD Mn) and % Growth by Country, 2022 & 2032
Figure 112: Oceania Powdered Soft Drink Market Y-o-Y Growth Rate by Country, 2022-2032
Figure 113: Oceania Powdered Soft Drink Market Value (USD Mn) and % Growth by Flavor, 2022 & 2032
Figure 114: Oceania Powdered Soft Drink Market Y-o-Y Growth Rate by Flavor, 2022-2032
Figure 115: Oceania Powdered Soft Drink Market Value (USD Mn) and % Growth by End Use, 2022 & 2032
Figure 116: Oceania Powdered Soft Drink Market Y-o-Y Growth Rate by End Use, 2022-2032
Figure 117: Oceania Powdered Soft Drink Market Value (USD Mn) and % Growth by Sales Channel, 2022 & 2032
Figure 118: Oceania Powdered Soft Drink Market Y-o-Y Growth Rate by Sales Channel, 2022-2032
Figure 119: Oceania Powdered Soft Drink Market Value (USD Mn) and % Growth by Packaging, 2022 & 2032
Figure 120: Oceania Powdered Soft Drink Market Y-o-Y Growth Rate by Packaging, 2022-2032
Figure 121: Oceania Powdered Soft Drink Market Value (USD Mn) and % Growth by Source, 2022 & 2032
Figure 122: Oceania Powdered Soft Drink Market Attractiveness Analysis by Country, 2022-2032
Figure 123: Oceania Powdered Soft Drink Market Attractiveness Analysis by Flavor, 2022-2032
Figure 124: Oceania Powdered Soft Drink Market Attractiveness Analysis by End Use, 2022-2032
Figure 125: Oceania Powdered Soft Drink Market Attractiveness Analysis by Sales Channel, 2022-2032
Figure 126: Oceania Powdered Soft Drink Market Attractiveness Analysis by Packaging, 2022-2032
Figure 127: MEA Powdered Soft Drink Market Value (USD Mn) and Volume (MT) Forecast, 2022-2032
Figure 128: MEA Powdered Soft Drink Market Absolute $ Opportunity (USD Mn), 2022-2032
Figure 129: MEA Powdered Soft Drink Market Value (USD Mn) and % Growth by Country, 2022 & 2032
Figure 130: MEA Powdered Soft Drink Market Y-o-Y Growth Rate by Country, 2022-2032
Figure 131: MEA Powdered Soft Drink Market Value (USD Mn) and % Growth by Flavor, 2022 & 2032
Figure 132: MEA Powdered Soft Drink Market Y-o-Y Growth Rate by Flavor, 2022-2032
Figure 133: MEA Powdered Soft Drink Market Value (USD Mn) and % Growth by End Use, 2022 & 2032
Figure 134: MEA Powdered Soft Drink Market Y-o-Y Growth Rate by End Use, 2022-2032
Figure 135: MEA Powdered Soft Drink Market Value (USD Mn) and % Growth by Sales Channel, 2022 & 2032
Figure 136: MEA Powdered Soft Drink Market Y-o-Y Growth Rate by Sales Channel, 2022-2032
Figure 137: MEA Powdered Soft Drink Market Value (USD Mn) and % Growth by Packaging, 2022 & 2032
Figure 138: MEA Powdered Soft Drink Market Y-o-Y Growth Rate by Packaging, 2022-2032
Figure 139: MEA Powdered Soft Drink Market Value (USD Mn) and % Growth by Source, 2022 & 2032
Figure 140: MEA Powdered Soft Drink Market Attractiveness Analysis by Country, 2022-2032
Figure 141: MEA Powdered Soft Drink Market Attractiveness Analysis by Flavor, 2022-2032
Figure 142: MEA Powdered Soft Drink Market Attractiveness Analysis by End Use, 2022-2032
Figure 143: MEA Powdered Soft Drink Market Attractiveness Analysis by Sales Channel, 2022-2032
Figure 144: MEA Powdered Soft Drink Market Attractiveness Analysis by Packaging, 2022-2032
Need specific information?
Request CustomizationExplore Food and Beverage Insights
View Reports