Soft Tissue Repair Market Size and Share Forecast Outlook from 2025 to 2035

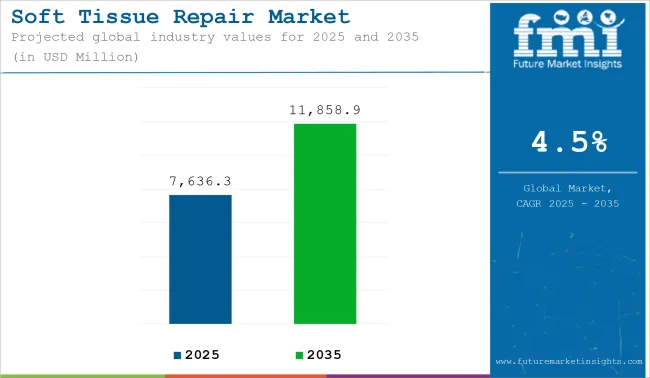
The global Soft Tissue Repair market is estimated to be valued at USD 7,636.3 million in 2025 and is projected to reach USD 11,858.9 million by 2035, registering a compound annual growth rate (CAGR) of 4.5% over the forecast period.
Quick Stats for Soft Tissue Repair Market

  • Industry Value (2024): USD 7,307.5 Million
  • Industry Value (2025): USD 7,636.3 Million
  • Forecast Value (2035): USD 11,858.9 Million
  • Forecast CAGR (2025 to 2035): 4.5%
  • Leading Segment in 2025: Synthetic Products (dominant due to mass producibility and lower disease transmission risk)
  • Key Growth Regions: Asia-Pacific (China, India), North America, Europe
  • Top Key Players: B. Braun Melsungen AG, Baxter, Johnson & Johnson Medtech, Stryker, Integra LifeSciences Corporation, Medtronic, Acera Surgical, Inc., AROA BIOSURGERY LIMITED, Becton, Dickinson and Company, W. L. Gore & Associates, Inc.

Soft Tissue Repair Market Industry Value Analysis

Metric Value
Industry Size (2025E) USD 7,636.3 Million
Industry Value (2035F) USD 11,858.9 Million
CAGR (2025 to 2035) 4.5%

The market is expanding steadily as a result of rising surgical volumes, higher incidence of sports injuries, and advancements in biomaterials designed to improve healing outcomes. An increased focus has been observed among healthcare providers on reducing postoperative complications and accelerating functional recovery timelines.

Hospitals and ambulatory surgical centres have prioritized investments in synthetic grafts and biologic matrices that support robust integration with native tissues while minimizing inflammatory responses. Regulatory approvals and favourable reimbursement frameworks have encouraged the adoption of novel repair materials across diverse applications, including orthopedic reconstruction, hernia repair, and dental soft tissue regeneration.
Analyzing Soft Tissue Repair Market by Top Investment Segments

Synthetic Tissue Repair Dominate the Market with Preference for Predictable Performance and Cost Efficiency

Soft Tissue Repair Market Analysis By Material Type

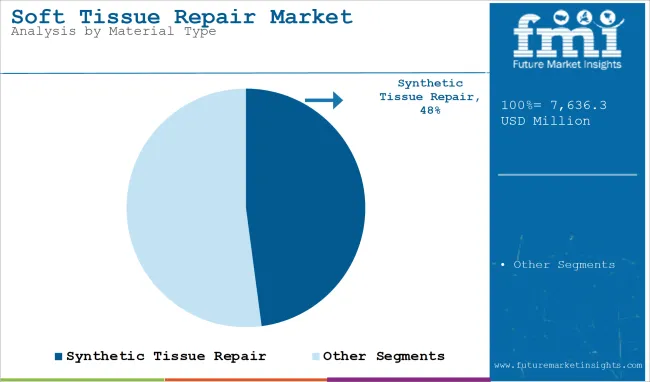
Synthetic Tissue Repair dominates with a revenue share of 47.9% which has been attributed to synthetic tissue repair materials in 2025, supported by their established role in delivering consistent mechanical strength and predictable degradation profiles. Adoption has been influenced by the perception that synthetic implants reduce the risk of disease transmission and immunologic reactions associated with allograft and xenograft materials. Advances in polymer science and textile engineering have resulted in improved biocompatibility and design flexibility, enabling tailored solutions for diverse anatomical sites.

Hospitals and ambulatory surgical centers have prioritized synthetic products for their ease of handling, reproducible outcomes, and favorable cost-benefit profile. Regulatory clearances have been secured across multiple indications, reinforcing clinician confidence and facilitating integration into surgical protocols.
Orthopedic Applications Lead the Soft Tissue Repair Market with Growing Demand for Restorative Procedures and Sports Injury Management

Soft Tissue Repair Market Analysis By Application

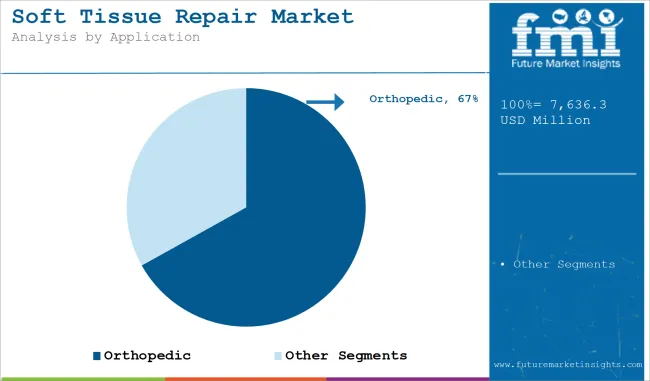
Orthopedic segment holds a leading revenue share of 66.9% that has been attributed to rising procedural volumes for tendon, ligament, and cartilage repair. Growth has been sustained by increasing participation in athletic activities and an aging population experiencing degenerative musculoskeletal conditions. Surgical departments have prioritized comprehensive soft tissue management strategies to reduce reinjury rates and restore mobility.

Clinical guidelines have recommended early intervention for soft tissue damage, encouraging hospitals and specialty centers to invest in advanced repair technologies. Technological improvements in suture anchor systems, scaffolds, and fixation devices have contributed to consistent procedural success and faster rehabilitation timelines. These factors have collectively supported the dominance of orthopedic applications within the soft tissue repair market and are expected to sustain demand over the forecast horizon.
Hospitals Anchor the Soft Tissue Repair Market with Integrated Surgical Capabilities and Access to Advanced Repair Technologies

Soft Tissue Repair Market Analysis By End User

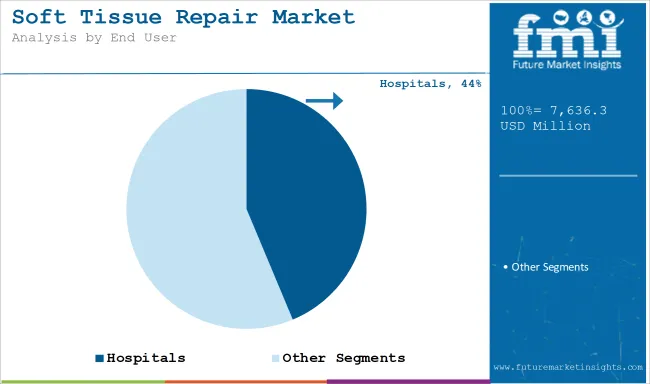
Hospitals have accounted for 43.7% of market revenue, supported by their capacity to provide comprehensive surgical care and maintain multidisciplinary teams focused on reconstructive procedures. Investments have been directed toward upgrading surgical infrastructure and expanding the availability of minimally invasive techniques to improve patient outcomes and reduce length of stay. Procurement strategies have prioritized products with demonstrated safety, regulatory approval, and compatibility with existing instrumentation.

Reimbursement policies and bundled payment models have been leveraged to support the integration of advanced soft tissue repair solutions in orthopedic, general, and plastic surgery departments. These factors have reinforced hospitals as the principal end users in soft tissue repair procedures and are anticipated to sustain their leadership in adoption.

Challenges and Opportunities

Challenges

High Cost and Limited Reimbursement of Advanced Biologic Hinders the Adoption of Soft Tissue Repair

Clinicians work with materials such as grafts and biologics syntheses that are primarily ortho biologics that are high in costs and has low reimbursement rates. Australia, North America and some parts of Europe are faced with their own unique reimbursement obstacles that will further hinder the usage of such lucrative technologies by patients and health-care-providers alike.

However, affordability becomes a much more serious issue in some of the developing nations, and such issues have led to a great number of patients giving delayed or suboptimal solutions. The barriers due to cost erode the degree of autonomy patients have, thereby inhibiting having newer technology accepted amongst softer tissue repair could, especially where health care is resource and cost-constrained.

Opportunities

Increasing Integration of Regenerative Medicine and Biologics into Standard Surgical Practices Poses Opportunity for Soft Tissue Repair

The other opportunity is that the most prospective one within soft tissue repair is entering into the merge of regenerative medicine and biologics with standard surgical practices. The technological development in stem cell therapy, PRP, and bioactive scaffolds is a paradigm shift towards faster and cheaper healing outcomes.

These procedures offer low scarring, few reoperations, short recovery times, and positive perceptions and therefore are preferred by both the patients and the physician. With increasing clarity in regulatory pathways as well as an ever-growing clinical evidence base supporting the technology, these applications are being accepted more rapidly into the orthopedic, sports medicine, and reconstructive surgery communities.

Concurrently, there is a greater acceptance of outpatient and minimally invasive procedures worldwide. This opens up substantial growth opportunities in established markets like North America and Europe, as well as emerging markets in the Asia Pacific region, where the impetus for health care innovation is gaining traction

Industry Specific Highlights

Surge in Sports Medicine and Orthopedic Procedures anticipates the Growth of the Market

Soft tissue repair is creating a formidable growth market due to the ever-increasing incidence of soft tissue injurious events fueled mostly by increasing participations in professional and amateur sporting events. Add to that the rising number of soft-tissue injuries among middle-aged and young people, people of all ages are affected by such injuries.

Examples of these injuries include rotator cuff tears, ligament sprains, and tendon ruptures, all of which can be repaired using soft tissue repair. Most orthopedic centers and sports clinics have high-speed surgical devices and biologic grafts that would predispose to healing, thus creating a demand for innovation in sutures, fixation devices, and biologic implants.

Companies are also looking at incorporating recovery options personalized to an individual athlete, which would be used to take the business of soft tissue repair to the healthcare sector through sports medicine, especially in North America, Europe, and Asian Pacific regions.

Advancements in Biologic and Synthetic Grafts demonstrates the Growth of the Market

A vital industry-specific highlight in soft tissue repair is the advent of novel biologics and synthetic graft technology. Manufacturers now design next-generation allograft, xenograft, and bioresorbable polymer-based grafts for the purpose of better cellular regeneration and speedy radiance. The advances are most valuable in complex initiatives such as ligament and tendon reconstruction.

Biologic grafts, especially those enriched with growth factors or stem cells, show more promise than standard techniques, owing to the minimization of immune reactions and enhanced healing outcomes. The synthetic alternatives are also being fine-tuned for biocompatibility and mechanical properties, thus widening their recruitment for applications in load-bearing repairs.

Emerging Trends

Shift Toward Minimally Invasive and Robotic-Assisted Surgery is an Ongoing Trend in the Market

Robotic systems in combination with computer-assisted navigation improve the surgical accuracy for ligament and tendon repairs. Improved patient satisfaction and a fast return to activities propel this technology into acceptance among the specialized disciplines of sports medicine, orthopedic, and general surgery.

Hospitals are also investing in robotic solutions in a bid to stay competitive among peers and to meet the growing demand for outpatient, same-day cases. Innovation is now propelled into development in soft tissue repair devices and implants intended specifically for minimally invasive workflows, encouraging a broader evolution throughout surgery specialties.

Growing Focus on Regenerative Therapies

Another of the emerging prominent trends within soft tissue repair is increasing buy-in toward regenerative therapies, including stem cell-based therapies, platelet-rich plasma (PRP), and growth factor-enriched scaffolds.

More than repairing, these therapies aim for biological restoration of the tissue's original function after injury. Clinical evidence and real-world evidence in some cases has shown promising results in improving recovery time and reducing scar tissue formation, leading both med tech players and biotech-startup companies to invest in regenerative platforms focused on orthopedics, sports medicine, and reconstructive applications.

These therapies previously appeared to be different from the mainstream practice of surgery but are increasingly reaching that point as regulatory agencies clear paths for approvals and clinical evidence accumulates.

Country-wise insights

United States

Increased market development, such as the high number of sports injuries, and where it has gone ahead in adopting the very latest technologies while having a well-established reimbursement system: all of these are factors contributing to the increased rapid growth within the market in the USA.

The presence of key medical devices' firms and an increasing number of outpatient surgical procedures drives demand. It has also increased awareness regarding regenerative therapies along with huge investments made in R&D, thereby encouraging innovations in soft tissue repair.

Market Growth Factors

  • Heavy R&D Spending: Intense expenditure on biopharmaceutical research, AI-based diagnosis, and advanced surgical instruments.
  • Support from Regulation: The FDA had positive pathways like fast-track approvals for NIH grants and innovations in soft tissue repair.
  • Significant Growth in Sports & Ortho Market: The increase in sports injuries and chronic musculoskeletal conditions helps keep demand in procedures.
  • AI & Automation: Use of machine learning with surgical planning and robotics increases precision and scalability levels in medical procedures.
  • Innovations of Stem Cell & Biology: Encouraging development for the orthobiologics&tissue engineering ecosystem.
Country CAGR (2025 to 2035)
United States 3.2%

Germany

Market Outlook

Soft tissue reconstruction in Germany continues to develop into an amazing marketplace owing to the high prevalence of orthopedic conditions infecting its population, which is aging, and healthy investments in technologically advanced centers of surgery.

High-tech biologicals, government initiatives concerning the amendments in healthcare policies, and a very high demand for less invasive procedures are in favor of continued growth in specialized centers for orthopedic and sport medicine.

Market Growth Factors

  • Consistent R&D Investment: Heavy investment in biomedical engineering, biomaterials, and regenerative medicine always inspires innovation in soft tissue repair.
  • University-Industry Collaborations: The very close link between universities and research institutes and medtech companies facilitates clinical translation.
  • Development of Highly Sophisticated Surgical Procedures: The increased trend towards minimally invasive and robot-assisted procedures in the case of soft tissue reconstruction attracts surgeons.
  • Regenerative Medicine Expertise: Germany is the hub of Europe with stem cell research and will contribute toward biologic-based repair solutions.
  • Demand from the Aging Population: Increases in aging populations lead to more tendon, ligament, and muscle repair procedures.

Market Forecast

Country CAGR (2025 to 2035)
Germany 3.8%

India

Market Outlook

The factors responsible for the growth of the Indian soft tissue repair market include an increased incidence of trauma, a growing sports culture, and better healthcare infrastructure. Government policies enhance accessibility to surgical care in rural areas. The investment made by private hospitals and affordability of synthetic grafts also increases demand for them in urban and semi-urban areas.

Market Growth Factors

  • Healthcare Access Improvement: Increase private funding and government policies to strengthen access to advanced orthopedic and soft tissue treatment.
  • Increased Injury Due to Sport and Accidents: Demand is boosted by the growing incidence of ligament, tendon, and muscle injuries resulting from sports and road accidents.
  • Medical Tourism Evolution: The low-cost yet skilled surgical expertise attract patients worldwide for soft tissue reconstruction.
  • Increased R&D Spending: High-level partnerships between public and private institutions and offshoots in local biotechnology research spur innovation in the repair materials arena.
  • Benign Regulatory Reforms: Streamlined clinical trial rules and incentivization of medtech innovation are positives for new product launch.

Market Forecast

Country CAGR (2025 to 2035)
India 5.6%

China

The market for soft-tissue repair in China is accelerating fast as a result of increasing urban population, greater sports activities, and growing elderly suffering from musculoskeletal disorders. It is expected that massive demand will be realized in the high-end soft tissue repair products and biologics because of government support for local innovations in medical technology and rising health insurance coverage.

Market Growth Drivers

  • Big R&D Stimulus in: Sustained governmental support with an emphasis on biomedical research like soft tissue engineering and biomaterials.
  • Increasing Musculoskeletal Disorders: The demand is directly proportional to the increased population and levels of physical work for soft tissue repair.
  • Expansion of Technology-led Surgery: Increased number of AI-based diagnostics and robotic procedures available in Tier 1 and Tier 2 hospitals.
  • Policy Support for Domestic Innovation: Reforms in policies accelerate the approval of regenerative and tissue repair products.
  • Emerging Biotech Startups: Increasingly growing number of local startups are working on solutions related to stem cell and tissue regeneration.
Country CAGR (2025 to 2035)
China 6.2%

Japan

A rapidly growing aging population in Japan is already associated with a high incidence rate of degenerative soft tissue diseases, hence, building demand in their market. Demand is driven by highly sophisticated surgical techniques coupled with regulatory support for regenerative medicine and growing trend toward robotic-assisted systems. Japan's patient-centric-minimally invasive care is paving the way for future soft tissue repair.

Market Growth Drivers

  • Government-supported regenerative medicine: AMED promises to give more to regenerative medicine, coupled with expedited approval policies for novel tissue repair products.
  • Aged pressure with degenerative changes: Degenerative soft tissue trauma among the elderly leads to higher acceptance of the market.
  • Application of high-tech surgery techniques: General practice of robotic and precise tools for orthopedic and soft tissue repair surgery.
  • Pharmaceutical & Biological: Strong biopharma structure in Japan makes the most supporting environment for innovation in cell-based and biologics repair therapies
  • Japanese Cultural Priority for Minimally Invasive Treatment: Less invasive procedure with quicker rehabilitation is preferred, hence making acceptance and utilization of new devices for repair.
Country CAGR (2025 to 2035)
Japan 4.8%

Competitive Outlook

The competitive landscape has been shaped by companies investing in synthetic and biologic repair materials designed to deliver superior strength and tissue integration. Leading manufacturers have expanded their portfolios through product launches and acquisitions targeting innovative scaffolds and bioresorbable implants. Strategic collaborations with research institutions have been pursued to develop next-generation biomaterials and validate long-term outcomes. With technology, players also focus on ensuring safety, quality, and customer satisfaction to captivate an increased customer base.

Key Development:

  • In 2024, Johnson & Johnson MedTech, announced its exclusive commercial distribution agreement in the United States with Responsive Arthroscopy Inc. This strategic agreement strengthens Johnson & Johnson MedTech’s sports platform, enhancing its soft tissue portfolio to meet the rising demand for advanced solutions in the rapidly growing sports soft tissue repair market.
  • In 2024, Smith+Nephew, announces the introduction of its newly acquired CARTIHEAL◊ AGILI-C◊ Cartilage Repair Implant alongside the REGENETEN◊ Bioinductive Implant at the AAOS Annual Meeting which demonstates its leadership in Sports Medicine.

Key Players

  • B. Braun Melsungen AG
  • Baxter
  • Johnson & Johnson Medtech
  • Stryker
  • Integra LifeSciences Corporation
  • Medtronic
  • Acera Surgical, Inc.
  • AROA BIOSURGERY LIMITED
  • Becton, Dickinson and Company
  • W. L. Gore & Associates, Inc.

Key Segments 

By Product:

Synthetic, Allograft, Xenograft and Alloplast

By Application:

Breast Reconstruction, Hernia, Dermatology, Orthopaedics (Sports Medicine, Dural Repair and Others), Dental Problems, Vaginal Sling and Others

By End User:

Hospitals, Ambulatory Surgical Services and Clinics

Table of Content

  1. Executive Summary
  2. Industry Introduction, including Taxonomy and Market Definition
  3. Market Trends and Success Factors, including Macro-economic Factors, Market Dynamics, and Recent Industry Developments
  4. Global Market Demand Analysis 2020 to 2024 and Forecast 2025 to 2035, including Historical Analysis and Future Projections
  5. Global Market Analysis 2020 to 2024 and Forecast 2025 to 2035
    • By Product
    • By Application
    • By End User
    • By Region
  6. Global Market Analysis 2020 to 2024 and Forecast 2025 to 2035, by Product
    • Synthetic
    • Allograft
    • Xenograft
    • Alloplast
  7. Global Market Analysis 2020 to 2024 and Forecast 2025 to 2035, by Application
    • Breast Reconstruction
    • Hernia
    • Dermatology
    • Orthopaedics
      • Sports Medicine
      • Dural Repair
      • Others
    • Dental Problems
    • Vaginal Sling
    • Others
  8. Global Market Analysis 2020 to 2024 and Forecast 2025 to 2035, by End User
    • Hospitals
    • Ambulatory Surgical Services
    • Clinics
  9. Global Market Analysis 2020 to 2024 and Forecast 2025 to 2035, by Region
    • North America
    • Latin America
    • East Asia
    • South Asia and Pacific
    • Western Europe
    • Eastern Europe
    • Middle East and Africa
  10. North America Sales Analysis 2020 to 2024 and Forecast 2025 to 2035, by Key Segments and Countries
  11. Latin America Sales Analysis 2020 to 2024 and Forecast 2025 to 2035, by Key Segments and Countries
  12. East Asia Sales Analysis 2020 to 2024 and Forecast 2025 to 2035, by Key Segments and Countries
  13. South Asia & Pacific Sales Analysis 2020 to 2024 and Forecast 2025 to 2035, by Key Segments and Countries
  14. Western Europe Sales Analysis 2020 to 2024 and Forecast 2025 to 2035, by Key Segments and Countries
  15. Eastern Europe Sales Analysis 2020 to 2024 and Forecast 2025 to 2035, by Key Segments and Countries
  16. Middle East and Africa Sales Analysis 2020 to 2024 and Forecast 2025 to 2035, by Key Segments and Countries
  17. Sales Forecast 2025 to 2035 by Product, Application, and End User for 30 Countries
  18. Competition Outlook, including Market Structure Analysis, Company Share Analysis by Key Players, and Competition Dashboard
  19. Company Profile
    • B. Braun Melsungen AG
    • Baxter
    • C. R. Bard, Inc.
    • Smith & Nephew
    • Johnson & Johnson Services Inc.
    • Stryker
    • Medtronic
    • Acera Surgical Inc.
    • Arthrex Inc.
    • Integra LifeSciences
    • ACELITY L.P. Inc.
    • AROA BIOSURGERY LIMITED
    • Becton, Dickinson, and Company
    • CONMED
    • Human Regenerative Technologies, LLC
    • BioCer Entwicklungs-GmbH

List of Tables

  • Table 1: Global Market Value (USD Million) Forecast by Region, 2020 to 2035
  • Table 2: Global Market Value (USD Million) Forecast by Product, 2020 to 2035
  • Table 3: Global Market Value (USD Million) Forecast by Application, 2020 to 2035
  • Table 4: Global Market Value (USD Million) Forecast by End User, 2020 to 2035
  • Table 5: North America Market Value (USD Million) Forecast by Country, 2020 to 2035
  • Table 6: North America Market Value (USD Million) Forecast by Product, 2020 to 2035
  • Table 7: North America Market Value (USD Million) Forecast by Application, 2020 to 2035
  • Table 8: North America Market Value (USD Million) Forecast by End User, 2020 to 2035
  • Table 9: Latin America Market Value (USD Million) Forecast by Country, 2020 to 2035
  • Table 10: Latin America Market Value (USD Million) Forecast by Product, 2020 to 2035
  • Table 11: Latin America Market Value (USD Million) Forecast by Application, 2020 to 2035
  • Table 12: Latin America Market Value (USD Million) Forecast by End User, 2020 to 2035
  • Table 13: Western Europe Market Value (USD Million) Forecast by Country, 2020 to 2035
  • Table 14: Western Europe Market Value (USD Million) Forecast by Product, 2020 to 2035
  • Table 15: Western Europe Market Value (USD Million) Forecast by Application, 2020 to 2035
  • Table 16: Western Europe Market Value (USD Million) Forecast by End User, 2020 to 2035
  • Table 17: Eastern Europe Market Value (USD Million) Forecast by Country, 2020 to 2035
  • Table 18: Eastern Europe Market Value (USD Million) Forecast by Product, 2020 to 2035
  • Table 19: Eastern Europe Market Value (USD Million) Forecast by Application, 2020 to 2035
  • Table 20: Eastern Europe Market Value (USD Million) Forecast by End User, 2020 to 2035
  • Table 21: South Asia and Pacific Market Value (USD Million) Forecast by Country, 2020 to 2035
  • Table 22: South Asia and Pacific Market Value (USD Million) Forecast by Product, 2020 to 2035
  • Table 23: South Asia and Pacific Market Value (USD Million) Forecast by Application, 2020 to 2035
  • Table 24: South Asia and Pacific Market Value (USD Million) Forecast by End User, 2020 to 2035
  • Table 25: East Asia Market Value (USD Million) Forecast by Country, 2020 to 2035
  • Table 26: East Asia Market Value (USD Million) Forecast by Product, 2020 to 2035
  • Table 27: East Asia Market Value (USD Million) Forecast by Application, 2020 to 2035
  • Table 28: East Asia Market Value (USD Million) Forecast by End User, 2020 to 2035
  • Table 29: Middle East and Africa Market Value (USD Million) Forecast by Country, 2020 to 2035
  • Table 30: Middle East and Africa Market Value (USD Million) Forecast by Product, 2020 to 2035
  • Table 31: Middle East and Africa Market Value (USD Million) Forecast by Application, 2020 to 2035
  • Table 32: Middle East and Africa Market Value (USD Million) Forecast by End User, 2020 to 2035

List of Figures

  • Figure 1: Global Market Value (USD Million) by Product, 2025 to 2035
  • Figure 2: Global Market Value (USD Million) by Application, 2025 to 2035
  • Figure 3: Global Market Value (USD Million) by End User, 2025 to 2035
  • Figure 4: Global Market Value (USD Million) by Region, 2025 to 2035
  • Figure 5: Global Market Value (USD Million) Analysis by Region, 2020 to 2035
  • Figure 6: Global Market Value Share (%) and BPS Analysis by Region, 2025 to 2035
  • Figure 7: Global Market Y-o-Y Growth (%) Projections by Region, 2025 to 2035
  • Figure 8: Global Market Value (USD Million) Analysis by Product, 2020 to 2035
  • Figure 9: Global Market Value Share (%) and BPS Analysis by Product, 2025 to 2035
  • Figure 10: Global Market Y-o-Y Growth (%) Projections by Product, 2025 to 2035
  • Figure 11: Global Market Value (USD Million) Analysis by Application, 2020 to 2035
  • Figure 12: Global Market Value Share (%) and BPS Analysis by Application, 2025 to 2035
  • Figure 13: Global Market Y-o-Y Growth (%) Projections by Application, 2025 to 2035
  • Figure 14: Global Market Value (USD Million) Analysis by End User, 2020 to 2035
  • Figure 15: Global Market Value Share (%) and BPS Analysis by End User, 2025 to 2035
  • Figure 16: Global Market Y-o-Y Growth (%) Projections by End User, 2025 to 2035
  • Figure 17: Global Market Attractiveness by Product, 2025 to 2035
  • Figure 18: Global Market Attractiveness by Application, 2025 to 2035
  • Figure 19: Global Market Attractiveness by End User, 2025 to 2035
  • Figure 20: Global Market Attractiveness by Region, 2025 to 2035
  • Figure 21: North America Market Value (USD Million) by Product, 2025 to 2035
  • Figure 22: North America Market Value (USD Million) by Application, 2025 to 2035
  • Figure 23: North America Market Value (USD Million) by End User, 2025 to 2035
  • Figure 24: North America Market Value (USD Million) by Country, 2025 to 2035
  • Figure 25: North America Market Value (USD Million) Analysis by Country, 2020 to 2035
  • Figure 26: North America Market Value Share (%) and BPS Analysis by Country, 2025 to 2035
  • Figure 27: North America Market Y-o-Y Growth (%) Projections by Country, 2025 to 2035
  • Figure 28: North America Market Value (USD Million) Analysis by Product, 2020 to 2035
  • Figure 29: North America Market Value Share (%) and BPS Analysis by Product, 2025 to 2035
  • Figure 30: North America Market Y-o-Y Growth (%) Projections by Product, 2025 to 2035
  • Figure 31: North America Market Value (USD Million) Analysis by Application, 2020 to 2035
  • Figure 32: North America Market Value Share (%) and BPS Analysis by Application, 2025 to 2035
  • Figure 33: North America Market Y-o-Y Growth (%) Projections by Application, 2025 to 2035
  • Figure 34: North America Market Value (USD Million) Analysis by End User, 2020 to 2035
  • Figure 35: North America Market Value Share (%) and BPS Analysis by End User, 2025 to 2035
  • Figure 36: North America Market Y-o-Y Growth (%) Projections by End User, 2025 to 2035
  • Figure 37: North America Market Attractiveness by Product, 2025 to 2035
  • Figure 38: North America Market Attractiveness by Application, 2025 to 2035
  • Figure 39: North America Market Attractiveness by End User, 2025 to 2035
  • Figure 40: North America Market Attractiveness by Country, 2025 to 2035
  • Figure 41: Latin America Market Value (USD Million) by Product, 2025 to 2035
  • Figure 42: Latin America Market Value (USD Million) by Application, 2025 to 2035
  • Figure 43: Latin America Market Value (USD Million) by End User, 2025 to 2035
  • Figure 44: Latin America Market Value (USD Million) by Country, 2025 to 2035
  • Figure 45: Latin America Market Value (USD Million) Analysis by Country, 2020 to 2035
  • Figure 46: Latin America Market Value Share (%) and BPS Analysis by Country, 2025 to 2035
  • Figure 47: Latin America Market Y-o-Y Growth (%) Projections by Country, 2025 to 2035
  • Figure 48: Latin America Market Value (USD Million) Analysis by Product, 2020 to 2035
  • Figure 49: Latin America Market Value Share (%) and BPS Analysis by Product, 2025 to 2035
  • Figure 50: Latin America Market Y-o-Y Growth (%) Projections by Product, 2025 to 2035
  • Figure 51: Latin America Market Value (USD Million) Analysis by Application, 2020 to 2035
  • Figure 52: Latin America Market Value Share (%) and BPS Analysis by Application, 2025 to 2035
  • Figure 53: Latin America Market Y-o-Y Growth (%) Projections by Application, 2025 to 2035
  • Figure 54: Latin America Market Value (USD Million) Analysis by End User, 2020 to 2035
  • Figure 55: Latin America Market Value Share (%) and BPS Analysis by End User, 2025 to 2035
  • Figure 56: Latin America Market Y-o-Y Growth (%) Projections by End User, 2025 to 2035
  • Figure 57: Latin America Market Attractiveness by Product, 2025 to 2035
  • Figure 58: Latin America Market Attractiveness by Application, 2025 to 2035
  • Figure 59: Latin America Market Attractiveness by End User, 2025 to 2035
  • Figure 60: Latin America Market Attractiveness by Country, 2025 to 2035
  • Figure 61: Western Europe Market Value (USD Million) by Product, 2025 to 2035
  • Figure 62: Western Europe Market Value (USD Million) by Application, 2025 to 2035
  • Figure 63: Western Europe Market Value (USD Million) by End User, 2025 to 2035
  • Figure 64: Western Europe Market Value (USD Million) by Country, 2025 to 2035
  • Figure 65: Western Europe Market Value (USD Million) Analysis by Country, 2020 to 2035
  • Figure 66: Western Europe Market Value Share (%) and BPS Analysis by Country, 2025 to 2035
  • Figure 67: Western Europe Market Y-o-Y Growth (%) Projections by Country, 2025 to 2035
  • Figure 68: Western Europe Market Value (USD Million) Analysis by Product, 2020 to 2035
  • Figure 69: Western Europe Market Value Share (%) and BPS Analysis by Product, 2025 to 2035
  • Figure 70: Western Europe Market Y-o-Y Growth (%) Projections by Product, 2025 to 2035
  • Figure 71: Western Europe Market Value (USD Million) Analysis by Application, 2020 to 2035
  • Figure 72: Western Europe Market Value Share (%) and BPS Analysis by Application, 2025 to 2035
  • Figure 73: Western Europe Market Y-o-Y Growth (%) Projections by Application, 2025 to 2035
  • Figure 74: Western Europe Market Value (USD Million) Analysis by End User, 2020 to 2035
  • Figure 75: Western Europe Market Value Share (%) and BPS Analysis by End User, 2025 to 2035
  • Figure 76: Western Europe Market Y-o-Y Growth (%) Projections by End User, 2025 to 2035
  • Figure 77: Western Europe Market Attractiveness by Product, 2025 to 2035
  • Figure 78: Western Europe Market Attractiveness by Application, 2025 to 2035
  • Figure 79: Western Europe Market Attractiveness by End User, 2025 to 2035
  • Figure 80: Western Europe Market Attractiveness by Country, 2025 to 2035
  • Figure 81: Eastern Europe Market Value (USD Million) by Product, 2025 to 2035
  • Figure 82: Eastern Europe Market Value (USD Million) by Application, 2025 to 2035
  • Figure 83: Eastern Europe Market Value (USD Million) by End User, 2025 to 2035
  • Figure 84: Eastern Europe Market Value (USD Million) by Country, 2025 to 2035
  • Figure 85: Eastern Europe Market Value (USD Million) Analysis by Country, 2020 to 2035
  • Figure 86: Eastern Europe Market Value Share (%) and BPS Analysis by Country, 2025 to 2035
  • Figure 87: Eastern Europe Market Y-o-Y Growth (%) Projections by Country, 2025 to 2035
  • Figure 88: Eastern Europe Market Value (USD Million) Analysis by Product, 2020 to 2035
  • Figure 89: Eastern Europe Market Value Share (%) and BPS Analysis by Product, 2025 to 2035
  • Figure 90: Eastern Europe Market Y-o-Y Growth (%) Projections by Product, 2025 to 2035
  • Figure 91: Eastern Europe Market Value (USD Million) Analysis by Application, 2020 to 2035
  • Figure 92: Eastern Europe Market Value Share (%) and BPS Analysis by Application, 2025 to 2035
  • Figure 93: Eastern Europe Market Y-o-Y Growth (%) Projections by Application, 2025 to 2035
  • Figure 94: Eastern Europe Market Value (USD Million) Analysis by End User, 2020 to 2035
  • Figure 95: Eastern Europe Market Value Share (%) and BPS Analysis by End User, 2025 to 2035
  • Figure 96: Eastern Europe Market Y-o-Y Growth (%) Projections by End User, 2025 to 2035
  • Figure 97: Eastern Europe Market Attractiveness by Product, 2025 to 2035
  • Figure 98: Eastern Europe Market Attractiveness by Application, 2025 to 2035
  • Figure 99: Eastern Europe Market Attractiveness by End User, 2025 to 2035
  • Figure 100: Eastern Europe Market Attractiveness by Country, 2025 to 2035
  • Figure 101: South Asia and Pacific Market Value (USD Million) by Product, 2025 to 2035
  • Figure 102: South Asia and Pacific Market Value (USD Million) by Application, 2025 to 2035
  • Figure 103: South Asia and Pacific Market Value (USD Million) by End User, 2025 to 2035
  • Figure 104: South Asia and Pacific Market Value (USD Million) by Country, 2025 to 2035
  • Figure 105: South Asia and Pacific Market Value (USD Million) Analysis by Country, 2020 to 2035
  • Figure 106: South Asia and Pacific Market Value Share (%) and BPS Analysis by Country, 2025 to 2035
  • Figure 107: South Asia and Pacific Market Y-o-Y Growth (%) Projections by Country, 2025 to 2035
  • Figure 108: South Asia and Pacific Market Value (USD Million) Analysis by Product, 2020 to 2035
  • Figure 109: South Asia and Pacific Market Value Share (%) and BPS Analysis by Product, 2025 to 2035
  • Figure 110: South Asia and Pacific Market Y-o-Y Growth (%) Projections by Product, 2025 to 2035
  • Figure 111: South Asia and Pacific Market Value (USD Million) Analysis by Application, 2020 to 2035
  • Figure 112: South Asia and Pacific Market Value Share (%) and BPS Analysis by Application, 2025 to 2035
  • Figure 113: South Asia and Pacific Market Y-o-Y Growth (%) Projections by Application, 2025 to 2035
  • Figure 114: South Asia and Pacific Market Value (USD Million) Analysis by End User, 2020 to 2035
  • Figure 115: South Asia and Pacific Market Value Share (%) and BPS Analysis by End User, 2025 to 2035
  • Figure 116: South Asia and Pacific Market Y-o-Y Growth (%) Projections by End User, 2025 to 2035
  • Figure 117: South Asia and Pacific Market Attractiveness by Product, 2025 to 2035
  • Figure 118: South Asia and Pacific Market Attractiveness by Application, 2025 to 2035
  • Figure 119: South Asia and Pacific Market Attractiveness by End User, 2025 to 2035
  • Figure 120: South Asia and Pacific Market Attractiveness by Country, 2025 to 2035
  • Figure 121: East Asia Market Value (USD Million) by Product, 2025 to 2035
  • Figure 122: East Asia Market Value (USD Million) by Application, 2025 to 2035
  • Figure 123: East Asia Market Value (USD Million) by End User, 2025 to 2035
  • Figure 124: East Asia Market Value (USD Million) by Country, 2025 to 2035
  • Figure 125: East Asia Market Value (USD Million) Analysis by Country, 2020 to 2035
  • Figure 126: East Asia Market Value Share (%) and BPS Analysis by Country, 2025 to 2035
  • Figure 127: East Asia Market Y-o-Y Growth (%) Projections by Country, 2025 to 2035
  • Figure 128: East Asia Market Value (USD Million) Analysis by Product, 2020 to 2035
  • Figure 129: East Asia Market Value Share (%) and BPS Analysis by Product, 2025 to 2035
  • Figure 130: East Asia Market Y-o-Y Growth (%) Projections by Product, 2025 to 2035
  • Figure 131: East Asia Market Value (USD Million) Analysis by Application, 2020 to 2035
  • Figure 132: East Asia Market Value Share (%) and BPS Analysis by Application, 2025 to 2035
  • Figure 133: East Asia Market Y-o-Y Growth (%) Projections by Application, 2025 to 2035
  • Figure 134: East Asia Market Value (USD Million) Analysis by End User, 2020 to 2035
  • Figure 135: East Asia Market Value Share (%) and BPS Analysis by End User, 2025 to 2035
  • Figure 136: East Asia Market Y-o-Y Growth (%) Projections by End User, 2025 to 2035
  • Figure 137: East Asia Market Attractiveness by Product, 2025 to 2035
  • Figure 138: East Asia Market Attractiveness by Application, 2025 to 2035
  • Figure 139: East Asia Market Attractiveness by End User, 2025 to 2035
  • Figure 140: East Asia Market Attractiveness by Country, 2025 to 2035
  • Figure 141: Middle East and Africa Market Value (USD Million) by Product, 2025 to 2035
  • Figure 142: Middle East and Africa Market Value (USD Million) by Application, 2025 to 2035
  • Figure 143: Middle East and Africa Market Value (USD Million) by End User, 2025 to 2035
  • Figure 144: Middle East and Africa Market Value (USD Million) by Country, 2025 to 2035
  • Figure 145: Middle East and Africa Market Value (USD Million) Analysis by Country, 2020 to 2035
  • Figure 146: Middle East and Africa Market Value Share (%) and BPS Analysis by Country, 2025 to 2035
  • Figure 147: Middle East and Africa Market Y-o-Y Growth (%) Projections by Country, 2025 to 2035
  • Figure 148: Middle East and Africa Market Value (USD Million) Analysis by Product, 2020 to 2035
  • Figure 149: Middle East and Africa Market Value Share (%) and BPS Analysis by Product, 2025 to 2035
  • Figure 150: Middle East and Africa Market Y-o-Y Growth (%) Projections by Product, 2025 to 2035
  • Figure 151: Middle East and Africa Market Value (USD Million) Analysis by Application, 2020 to 2035
  • Figure 152: Middle East and Africa Market Value Share (%) and BPS Analysis by Application, 2025 to 2035
  • Figure 153: Middle East and Africa Market Y-o-Y Growth (%) Projections by Application, 2025 to 2035
  • Figure 154: Middle East and Africa Market Value (USD Million) Analysis by End User, 2020 to 2035
  • Figure 155: Middle East and Africa Market Value Share (%) and BPS Analysis by End User, 2025 to 2035
  • Figure 156: Middle East and Africa Market Y-o-Y Growth (%) Projections by End User, 2025 to 2035
  • Figure 157: Middle East and Africa Market Attractiveness by Product, 2025 to 2035
  • Figure 158: Middle East and Africa Market Attractiveness by Application, 2025 to 2035
  • Figure 159: Middle East and Africa Market Attractiveness by End User, 2025 to 2035
  • Figure 160: Middle East and Africa Market Attractiveness by Country, 2025 to 2035

Frequently Asked Questions

What was the overall size of the Soft Tissue Repair Market in 2025?

The overall market size for soft tissue repair market was USD 7,636.3 Million in 2025.

How big is the Soft Tissue Repair Market expected in 2035?

The soft tissue repair market is expected to reach USD 11,858.9 Million in 2035.

What will drive the demand for Soft Tissue Repair Market during the forecast period?

Rising incidence of sports injuries and trauma and geriatric population suffering from degenerative condition anticipates the growth of the soft tissue repair market.

List the top 5 Key players of the Soft Tissue Repair Market?

The top key players that drives the development of soft tissue repair market are B. Braun Melsungen AG, Baxter, C. R. Bard, Inc., Smith & Nephew and Stryker.

Which segment in product is expected to lead in Soft Tissue Repair Market?

Synthetic segment by product is expected to dominate the market during the forecast period.

Explore Similar Insights

Future Market Insights

Soft Tissue Repair Market