Soft Ferrite Core Market Outlook (2023 to 2033)

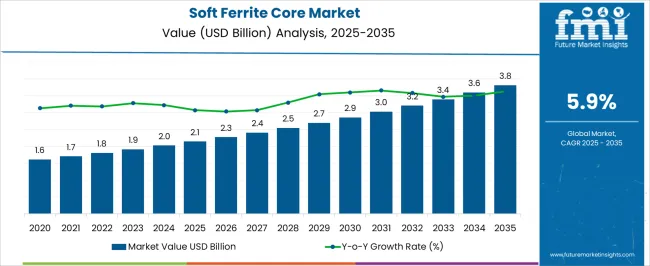
The global soft ferrite core market is projected to amass a revenue of around US$ 3.5 billion by 2033, up from US$ 1.9 billion in 2023, moving forward with a CAGR of 6.2% during the forecast period.

High-frequency characteristic is the major factor driving the sales of soft ferrite cores, which are widely adopted for manufacturing automobile components. Moreover, ferrite cores are used to improve the efficiency of power supplies (switch mode power supply) with minimized power transformer losses, and the same is pushing the growth of the soft ferrite core market forward.

Soft ferrite cores are made up of material that can be easily magnetized and demagnetized, catering to the rising demand from various applications. On the flip side, complexity in minimizing eddy current losses is the major challenge faced by most manufacturers in the market, dwindling the soft ferrite core market share during the forecast period.

Top 4 Factors Spearheading the Soft Ferrite Core Market

  • Wide Applications

The demand for soft ferrite cores is increasing as they are widely used in power and electromagnetic applications. In addition, the soft ferrite core market is significantly fostered by its role in enhancing the electric current's flux. Moreover, the sales of soft magnetic cores are expected to soar as they are extensively used in several power circuits, such as magnetic amplifiers, inductors, chokes, and current transformers.

  • Automotive Industry

Increasing ferrite core usage in producing automotive components with increased cost-effectiveness compared to other materials is anticipated to expand the soft ferrite core market size during the forecast period.

  • Electronics Industry

In addition to being widely employed in sensors like inductive proximity sensors, soft ferrite cores are also widely used in EMI suppression devices, positively impacting the market outlook. It is a major driver of the adoption of soft ferrite cores in consumer electronics and home appliances, and it is anticipated to support market revenue growth in the future.

  • Improving Power Transformers

The use of soft ferrite cores in high-frequency transformers is shaping the market. Soft ferrite core plays a significant role in energy saving as it requires less air conditioning. The employment of ferrite cores in transformers and inductors and their management with little energy loss when the magnetic polarity is reversed, is expected to spike the demand for soft ferrite cores to a considerable extent.

Attributes Details
Market CAGR (2023 to 2033) 6.2%
Market Valuation (2023) US$ 1.9 billion
Market Valuation (2033) US$ 3.5 billion

Don't pay for what you don't need

Customize your report by selecting specific countries or regions and save 30%!

Soft Ferrite Core Market, 2018 to 2022 Historical Sales, Compared to 2023 to 2033 Future Outlook

The market is estimated to register a CAGR of 4.1%, with a valuation of US$ 1.5 billion in 2018 and US$ 1.8 billion in 2022.

Soft ferrite cores are widely used in various applications, including consumer electronics, automotive electronics, power supplies, telecommunications, and renewable energy systems. These cores provide high magnetic permeability and low electrical conductivity, making them suitable for applications where electromagnetic interference (EMI) suppression and efficient energy conversion are essential.

Between 2018 and 2022, the soft ferrite core market experienced steady growth due to increasing demand from sectors such as automotive electronics, industrial automation, and renewable energy. The growing adoption of electric vehicles (EVs), the expansion of 5G infrastructure, and the rising demand for renewable energy sources were among the key drivers for the market.

Additionally, the proliferation of smart devices, IoT (Internet of Things) applications, and the increasing need for high-frequency transformers and inductors also contributed to the demand for soft ferrite cores during this period.

Category Wise Insights

Consumer Electronics are Dominate the Global Market

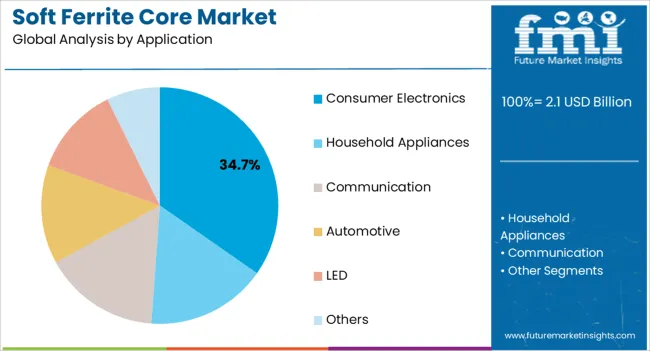
Based on application, consumer electronics dominate the ferrite core market. Consumer electronics is estimated to secure a share of 33.1% in the global market by 2033.

Consumer electronics indeed represent a significant application segment in the ferrite core market. Soft ferrite cores are widely used in consumer electronic devices, including electromagnetic interference (EMI) suppression, power supply filtering, and noise reduction. Some common consumer electronics applications where ferrite cores are utilized include:

  • Televisions: Ferrite cores are used in the power supply section and in video and audio cables to reduce EMI and ensure signal integrity.
  • Computers and Laptops: Ferrite cores are often found on power cords and data cables connected to computers and laptops to mitigate EMI and maintain signal quality.
  • Mobile Devices: Ferrite beads or chips are employed in charging cables, headphones, and data cables for smartphones and tablets to minimize EMI and enhance performance.
  • Audio Equipment: Ferrite cores are used in audio cables, speakers, amplifiers, and headphones to reduce interference and improve audio quality.
  • Gaming Consoles: Ferrite cores can be found in power cables and various connectivity cables of gaming consoles to minimize EMI and ensure stable power delivery.
  • Home Appliances: Ferrite cores are used in various home appliances, such as refrigerators, washing machines, and air conditioners, to reduce EMI and enhance overall performance.
Sudip Saha
Sudip Saha

Principal Consultant

Talk to Analyst

Find your sweet spots for generating winning opportunities in this market.

Regional Insights

Countries Forecast Share (2022 To 2033)
United States 18.7%
Germany 9.1%
Japan 4.7%
Australia 3.9%
Countries Forecast CAGR (2023 To 2033)
China 5.6%
India 8.7%
United Kingdom 4.3%

What Factors are Shaping the North American Soft Ferrite Core Market?

Due to an increase in the manufacture of electrical equipment in the region, North America is anticipated to get hold of a soft ferrite core market share of 42.2% in 2022.

The market in the region is also influenced by significant regional market players in the electrical sector, like General Electric, who exhibit an increase in soft ferrite core usage. Along with these factors, the region's market is also being driven by government initiatives for rapid economic expansion, energy-efficient appliances, changes in consumer lifestyles, and many manufacturers' existence.

What is the Growth Outlook for the Soft Ferrite Core Market in Europe?

The demand for electronic equipment has soared due to a high level of living and an increase in disposable income, and the same are expected to contribute to Europe's 21.1% market share in 2022.

Additionally, the need for RADAR systems has expanded across the region due to economic and security concerns, particularly in the aerospace and defence sectors, which is expanding the soft ferrite core market size. On the other hand, prices jumped to $95 per ton in markets based on the dollar in Europe, or €90 per ton, and the same is likely to dwindle in the market in Europe.
Start-up vs Existing Players, Who is Dominating the Soft Ferrite Core Market?

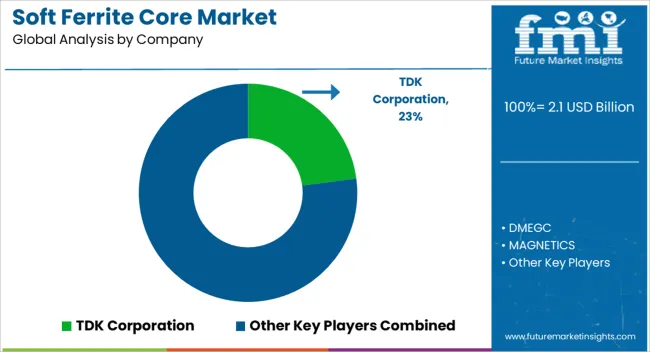
In general, the soft ferrite core market is fairly consolidated. Major manufacturers are seen engaging in product development, intensive research, and customization of their offerings to specialized and promising applications to augment their market share.

One of the tier 1 players is Toshiba Corp (Toshiba Materials Co., Ltd.), followed by Hitachi Metals Ltd. and Voestalpine Stahl GmbH. They are expected to hold a combined market share of more than 50% worldwide. Another prominent start-up in the market can be Viona Magnetics, which was founded in 1999. It provides services for the military, medical, broadcast, aerospace, automobile, electronics, and telecommunications sectors.

Like in several other industrial sectors, numerous start-ups have come up to compete with present-day soft ferrite core market players by adopting the newest technologies. For instance, a custom maker of ceramic magnets with barium or strontium ferrite magnet cores is available for use in loudspeakers, motors, craft projects, and toys.

Magnet cores are brittle and resistant to demagnetization. Pressing, sintering, injection moulding, assembling, surface treatment, machining, magnetizing, and handling are among the capabilities. Well-known manufacturers have also demonstrated the use of inorganic techniques.

Hybrid Electronics, an emerging start-up founded in 2005 at Stanford, is the EMI ferrite core distributor for wiring and cables. A few examples of secondary services are reeling, testing, retaining, up screening, and encapsulation or counterfeit detection.

Other Essential Players in the Global Market are:

  • TDK Corporation
  • DMEGC
  • MAGNETICS
  • Acme Electronics
  • Hitachi metals Ltd.
  • Ferroxcube International Holding B.V.
  • HEC Group
  • Toshiba materials Co. Ltd.
  • SAMWHA Electric.

Recent Developments in Soft Ferrite Core Market are as follows:

  • Hitachi metals introduced new soft ferrite core materials with high frequency characteristics.
  • Hitachi metals Ltd. Launched new ferrite core material with better temperature properties for automobile components.
  • MMG acquired the Brazilian company Sinome Ferrites. The Americas' ferrite product lineup is to be improved by this acquisition.

Get the data you need at a Fraction of the cost

Personalize your report by choosing insights you need
and save 40%!

Scope of Report

Attribute Details
Forecast Period 2023 to 2033
Historical Data Available for 2018 to 2022
Market Analysis US$ billion for Value
Key Countries Covered United States, United Kingdom, Japan, India, China, Australia, Germany
Key Segments Covered Type, Application, Region
Key Companies Profiled TDK Corporation; DMEGC; MAGNETICS; Acme Electronics; Hitachi metals Ltd.; Ferroxcube International Holding B.V.; HEC Group; Toshiba materials Co. Ltd.; SAMWHA Electric.
Report Coverage Market Forecast, Company Share Analysis, Competition Intelligence, DROT Analysis, Market Dynamics and Challenges, and Strategic Growth Initiatives
Customization & Pricing Available upon Request

Soft Ferrite Core Market by Category

By Type:

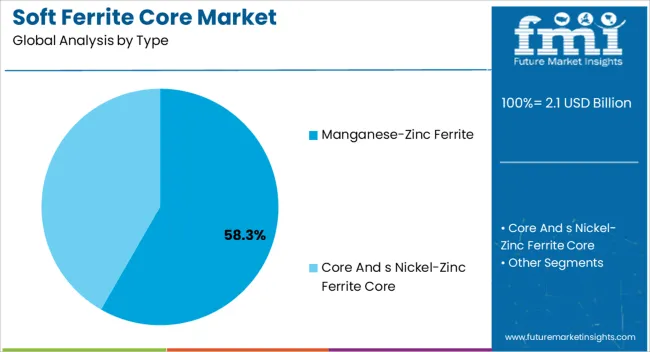
  • Manganese-Zinc Ferrite
  • Core and s Nickel-Zinc Ferrite Core

By Application:

  • Consumer Electronics
  • Household Appliances
  • Communication
  • Automotive
  • LED
  • Others

By Region:

  • North America
  • Latin America
  • Europe
  • Asia Pacific
  • Middle East and Africa

Frequently Asked Questions

What was the market value in 2023?

In 2023, the market was valued at US$ 1.9 billion.

What will be the market CAGR until 2033?

Until 2033, the market will experience a 6.2% CAGR.

What factor is shaping the North market?

An increase in the manufacture of electrical equipment in the region is shaping the North American market.

What was the market share of Europe in 2022?

The market share of Europe in 2022 was 21.1%.

What was the market share of North America in 2022?

The market share of North America in 2022 was 42.2%.

Table of Content
1. Executive Summary
    1.1. Global Market Outlook
    1.2. Demand-side Trends
    1.3. Supply-side Trends
    1.4. Technology Roadmap Analysis
    1.5. Analysis and Recommendations
2. Market Overview
    2.1. Market Coverage / Taxonomy
    2.2. Market Definition / Scope / Limitations
3. Market Background
    3.1. Market Dynamics
        3.1.1. Drivers
        3.1.2. Restraints
        3.1.3. Opportunity
        3.1.4. Trends
    3.2. Scenario Forecast
        3.2.1. Demand in Optimistic Scenario
        3.2.2. Demand in Likely Scenario
        3.2.3. Demand in Conservative Scenario
    3.3. Opportunity Map Analysis
    3.4. Product Life Cycle Analysis
    3.5. Supply Chain Analysis
        3.5.1. Supply Side Participants and their Roles
            3.5.1.1. Producers
            3.5.1.2. Mid-Level Participants (Traders/ Agents/ Brokers)
            3.5.1.3. Wholesalers and Distributors
        3.5.2. Value Added and Value Created at Node in the Supply Chain
        3.5.3. List of Raw Material Suppliers
        3.5.4. List of Existing and Potential Buyer’s
    3.6. Investment Feasibility Matrix
    3.7. Value Chain Analysis
        3.7.1. Profit Margin Analysis
        3.7.2. Wholesalers and Distributors
        3.7.3. Retailers
    3.8. PESTLE and Porter’s Analysis
    3.9. Regulatory Landscape
        3.9.1. By Key Regions
        3.9.2. By Key Countries
    3.10. Regional Parent Market Outlook
    3.11. Production and Consumption Statistics
    3.12. Import and Export Statistics
4. Global Market Analysis 2018 to 2022 and Forecast, 2023 to 2033
    4.1. Historical Market Size Value (US$ Million) & Volume (Units) Analysis, 2018 to 2022
    4.2. Current and Future Market Size Value (US$ Million) & Volume (Units) Projections, 2023 to 2033
        4.2.1. Y-o-Y Growth Trend Analysis
        4.2.2. Absolute $ Opportunity Analysis
5. Global Market Analysis 2018 to 2022 and Forecast 2023 to 2033, By Type
    5.1. Introduction / Key Findings
    5.2. Historical Market Size Value (US$ Million) & Volume (Units) Analysis By Type, 2018 to 2022
    5.3. Current and Future Market Size Value (US$ Million) & Volume (Units) Analysis and Forecast By Type, 2023 to 2033
        5.3.1. Manganese-Zinc Ferrite
        5.3.2. Core and Nickel-Zinc Ferrite Core
    5.4. Y-o-Y Growth Trend Analysis By Type, 2018 to 2022
    5.5. Absolute $ Opportunity Analysis By Type, 2023 to 2033
6. Global Market Analysis 2018 to 2022 and Forecast 2023 to 2033, By Application
    6.1. Introduction / Key Findings
    6.2. Historical Market Size Value (US$ Million) & Volume (Units) Analysis By Application, 2018 to 2022
    6.3. Current and Future Market Size Value (US$ Million) & Volume (Units) Analysis and Forecast By Application, 2023 to 2033
        6.3.1. Consumer Electronics
        6.3.2. Household Appliances
        6.3.3. Communication
        6.3.4. Automotive
        6.3.5. LED
        6.3.6. Others
    6.4. Y-o-Y Growth Trend Analysis By Application, 2018 to 2022
    6.5. Absolute $ Opportunity Analysis By Application, 2023 to 2033
7. Global Market Analysis 2018 to 2022 and Forecast 2023 to 2033, By Region
    7.1. Introduction
    7.2. Historical Market Size Value (US$ Million) & Volume (Units) Analysis By Region, 2018 to 2022
    7.3. Current Market Size Value (US$ Million) & Volume (Units) Analysis and Forecast By Region, 2023 to 2033
        7.3.1. North America
        7.3.2. Latin America
        7.3.3. Western Europe
        7.3.4. Eastern Europe
        7.3.5. South Asia and Pacific
        7.3.6. East Asia
        7.3.7. Middle East and Africa
    7.4. Market Attractiveness Analysis By Region
8. North America Market Analysis 2018 to 2022 and Forecast 2023 to 2033, By Country
    8.1. Historical Market Size Value (US$ Million) & Volume (Units) Trend Analysis By Market Taxonomy, 2018 to 2022
    8.2. Market Size Value (US$ Million) & Volume (Units) Forecast By Market Taxonomy, 2023 to 2033
        8.2.1. By Country
            8.2.1.1. U.S.
            8.2.1.2. Canada
        8.2.2. By Type
        8.2.3. By Application
    8.3. Market Attractiveness Analysis
        8.3.1. By Country
        8.3.2. By Type
        8.3.3. By Application
    8.4. Key Takeaways
9. Latin America Market Analysis 2018 to 2022 and Forecast 2023 to 2033, By Country
    9.1. Historical Market Size Value (US$ Million) & Volume (Units) Trend Analysis By Market Taxonomy, 2018 to 2022
    9.2. Market Size Value (US$ Million) & Volume (Units) Forecast By Market Taxonomy, 2023 to 2033
        9.2.1. By Country
            9.2.1.1. Brazil
            9.2.1.2. Mexico
            9.2.1.3. Rest of Latin America
        9.2.2. By Type
        9.2.3. By Application
    9.3. Market Attractiveness Analysis
        9.3.1. By Country
        9.3.2. By Type
        9.3.3. By Application
    9.4. Key Takeaways
10. Western Europe Market Analysis 2018 to 2022 and Forecast 2023 to 2033, By Country
    10.1. Historical Market Size Value (US$ Million) & Volume (Units) Trend Analysis By Market Taxonomy, 2018 to 2022
    10.2. Market Size Value (US$ Million) & Volume (Units) Forecast By Market Taxonomy, 2023 to 2033
        10.2.1. By Country
            10.2.1.1. Germany
            10.2.1.2. U.K.
            10.2.1.3. France
            10.2.1.4. Spain
            10.2.1.5. Italy
            10.2.1.6. Rest of Western Europe
        10.2.2. By Type
        10.2.3. By Application
    10.3. Market Attractiveness Analysis
        10.3.1. By Country
        10.3.2. By Type
        10.3.3. By Application
    10.4. Key Takeaways
11. Eastern Europe Market Analysis 2018 to 2022 and Forecast 2023 to 2033, By Country
    11.1. Historical Market Size Value (US$ Million) & Volume (Units) Trend Analysis By Market Taxonomy, 2018 to 2022
    11.2. Market Size Value (US$ Million) & Volume (Units) Forecast By Market Taxonomy, 2023 to 2033
        11.2.1. By Country
            11.2.1.1. Poland
            11.2.1.2. Russia
            11.2.1.3. Czech Republic
            11.2.1.4. Romania
            11.2.1.5. Rest of Eastern Europe
        11.2.2. By Type
        11.2.3. By Application
    11.3. Market Attractiveness Analysis
        11.3.1. By Country
        11.3.2. By Type
        11.3.3. By Application
    11.4. Key Takeaways
12. South Asia and Pacific Market Analysis 2018 to 2022 and Forecast 2023 to 2033, By Country
    12.1. Historical Market Size Value (US$ Million) & Volume (Units) Trend Analysis By Market Taxonomy, 2018 to 2022
    12.2. Market Size Value (US$ Million) & Volume (Units) Forecast By Market Taxonomy, 2023 to 2033
        12.2.1. By Country
            12.2.1.1. India
            12.2.1.2. Bangladesh
            12.2.1.3. Australia
            12.2.1.4. New Zealand
            12.2.1.5. Rest of South Asia and Pacific
        12.2.2. By Type
        12.2.3. By Application
    12.3. Market Attractiveness Analysis
        12.3.1. By Country
        12.3.2. By Type
        12.3.3. By Application
    12.4. Key Takeaways
13. East Asia Market Analysis 2018 to 2022 and Forecast 2023 to 2033, By Country
    13.1. Historical Market Size Value (US$ Million) & Volume (Units) Trend Analysis By Market Taxonomy, 2018 to 2022
    13.2. Market Size Value (US$ Million) & Volume (Units) Forecast By Market Taxonomy, 2023 to 2033
        13.2.1. By Country
            13.2.1.1. China
            13.2.1.2. Japan
            13.2.1.3. South Korea
        13.2.2. By Type
        13.2.3. By Application
    13.3. Market Attractiveness Analysis
        13.3.1. By Country
        13.3.2. By Type
        13.3.3. By Application
    13.4. Key Takeaways
14. Middle East and Africa Market Analysis 2018 to 2022 and Forecast 2023 to 2033, By Country
    14.1. Historical Market Size Value (US$ Million) & Volume (Units) Trend Analysis By Market Taxonomy, 2018 to 2022
    14.2. Market Size Value (US$ Million) & Volume (Units) Forecast By Market Taxonomy, 2023 to 2033
        14.2.1. By Country
            14.2.1.1. GCC Countries
            14.2.1.2. South Africa
            14.2.1.3. Israel
            14.2.1.4. Rest of MEA
        14.2.2. By Type
        14.2.3. By Application
    14.3. Market Attractiveness Analysis
        14.3.1. By Country
        14.3.2. By Type
        14.3.3. By Application
    14.4. Key Takeaways
15. Key Countries Market Analysis
    15.1. U.S.
        15.1.1. Pricing Analysis
        15.1.2. Market Share Analysis, 2022
            15.1.2.1. By Type
            15.1.2.2. By Application
    15.2. Canada
        15.2.1. Pricing Analysis
        15.2.2. Market Share Analysis, 2022
            15.2.2.1. By Type
            15.2.2.2. By Application
    15.3. Brazil
        15.3.1. Pricing Analysis
        15.3.2. Market Share Analysis, 2022
            15.3.2.1. By Type
            15.3.2.2. By Application
    15.4. Mexico
        15.4.1. Pricing Analysis
        15.4.2. Market Share Analysis, 2022
            15.4.2.1. By Type
            15.4.2.2. By Application
    15.5. Germany
        15.5.1. Pricing Analysis
        15.5.2. Market Share Analysis, 2022
            15.5.2.1. By Type
            15.5.2.2. By Application
    15.6. U.K.
        15.6.1. Pricing Analysis
        15.6.2. Market Share Analysis, 2022
            15.6.2.1. By Type
            15.6.2.2. By Application
    15.7. France
        15.7.1. Pricing Analysis
        15.7.2. Market Share Analysis, 2022
            15.7.2.1. By Type
            15.7.2.2. By Application
    15.8. Spain
        15.8.1. Pricing Analysis
        15.8.2. Market Share Analysis, 2022
            15.8.2.1. By Type
            15.8.2.2. By Application
    15.9. Italy
        15.9.1. Pricing Analysis
        15.9.2. Market Share Analysis, 2022
            15.9.2.1. By Type
            15.9.2.2. By Application
    15.10. Poland
        15.10.1. Pricing Analysis
        15.10.2. Market Share Analysis, 2022
            15.10.2.1. By Type
            15.10.2.2. By Application
    15.11. Russia
        15.11.1. Pricing Analysis
        15.11.2. Market Share Analysis, 2022
            15.11.2.1. By Type
            15.11.2.2. By Application
    15.12. Czech Republic
        15.12.1. Pricing Analysis
        15.12.2. Market Share Analysis, 2022
            15.12.2.1. By Type
            15.12.2.2. By Application
    15.13. Romania
        15.13.1. Pricing Analysis
        15.13.2. Market Share Analysis, 2022
            15.13.2.1. By Type
            15.13.2.2. By Application
    15.14. India
        15.14.1. Pricing Analysis
        15.14.2. Market Share Analysis, 2022
            15.14.2.1. By Type
            15.14.2.2. By Application
    15.15. Bangladesh
        15.15.1. Pricing Analysis
        15.15.2. Market Share Analysis, 2022
            15.15.2.1. By Type
            15.15.2.2. By Application
    15.16. Australia
        15.16.1. Pricing Analysis
        15.16.2. Market Share Analysis, 2022
            15.16.2.1. By Type
            15.16.2.2. By Application
    15.17. New Zealand
        15.17.1. Pricing Analysis
        15.17.2. Market Share Analysis, 2022
            15.17.2.1. By Type
            15.17.2.2. By Application
    15.18. China
        15.18.1. Pricing Analysis
        15.18.2. Market Share Analysis, 2022
            15.18.2.1. By Type
            15.18.2.2. By Application
    15.19. Japan
        15.19.1. Pricing Analysis
        15.19.2. Market Share Analysis, 2022
            15.19.2.1. By Type
            15.19.2.2. By Application
    15.20. South Korea
        15.20.1. Pricing Analysis
        15.20.2. Market Share Analysis, 2022
            15.20.2.1. By Type
            15.20.2.2. By Application
    15.21. GCC Countries
        15.21.1. Pricing Analysis
        15.21.2. Market Share Analysis, 2022
            15.21.2.1. By Type
            15.21.2.2. By Application
    15.22. South Africa
        15.22.1. Pricing Analysis
        15.22.2. Market Share Analysis, 2022
            15.22.2.1. By Type
            15.22.2.2. By Application
    15.23. Israel
        15.23.1. Pricing Analysis
        15.23.2. Market Share Analysis, 2022
            15.23.2.1. By Type
            15.23.2.2. By Application
16. Market Structure Analysis
    16.1. Competition Dashboard
    16.2. Competition Benchmarking
    16.3. Market Share Analysis of Top Players
        16.3.1. By Regional
        16.3.2. By Type
        16.3.3. By Application
17. Competition Analysis
    17.1. Competition Deep Dive
        17.1.1. TDK Corporation
            17.1.1.1. Overview
            17.1.1.2. Product Portfolio
            17.1.1.3. Profitability by Market Segments
            17.1.1.4. Sales Footprint
            17.1.1.5. Strategy Overview
                17.1.1.5.1. Marketing Strategy
                17.1.1.5.2. Product Strategy
                17.1.1.5.3. Channel Strategy
        17.1.2. DMEGC
            17.1.2.1. Overview
            17.1.2.2. Product Portfolio
            17.1.2.3. Profitability by Market Segments
            17.1.2.4. Sales Footprint
            17.1.2.5. Strategy Overview
                17.1.2.5.1. Marketing Strategy
                17.1.2.5.2. Product Strategy
                17.1.2.5.3. Channel Strategy
        17.1.3. MAGNETICS
            17.1.3.1. Overview
            17.1.3.2. Product Portfolio
            17.1.3.3. Profitability by Market Segments
            17.1.3.4. Sales Footprint
            17.1.3.5. Strategy Overview
                17.1.3.5.1. Marketing Strategy
                17.1.3.5.2. Product Strategy
                17.1.3.5.3. Channel Strategy
        17.1.4. Acme Electronics
            17.1.4.1. Overview
            17.1.4.2. Product Portfolio
            17.1.4.3. Profitability by Market Segments
            17.1.4.4. Sales Footprint
            17.1.4.5. Strategy Overview
                17.1.4.5.1. Marketing Strategy
                17.1.4.5.2. Product Strategy
                17.1.4.5.3. Channel Strategy
        17.1.5. Hitachi metals Ltd.
            17.1.5.1. Overview
            17.1.5.2. Product Portfolio
            17.1.5.3. Profitability by Market Segments
            17.1.5.4. Sales Footprint
            17.1.5.5. Strategy Overview
                17.1.5.5.1. Marketing Strategy
                17.1.5.5.2. Product Strategy
                17.1.5.5.3. Channel Strategy
        17.1.6. Ferroxcube International Holding B.V.
            17.1.6.1. Overview
            17.1.6.2. Product Portfolio
            17.1.6.3. Profitability by Market Segments
            17.1.6.4. Sales Footprint
            17.1.6.5. Strategy Overview
                17.1.6.5.1. Marketing Strategy
                17.1.6.5.2. Product Strategy
                17.1.6.5.3. Channel Strategy
        17.1.7. HEC Group
            17.1.7.1. Overview
            17.1.7.2. Product Portfolio
            17.1.7.3. Profitability by Market Segments
            17.1.7.4. Sales Footprint
            17.1.7.5. Strategy Overview
                17.1.7.5.1. Marketing Strategy
                17.1.7.5.2. Product Strategy
                17.1.7.5.3. Channel Strategy
        17.1.8. Toshiba materials Co. Ltd.
            17.1.8.1. Overview
            17.1.8.2. Product Portfolio
            17.1.8.3. Profitability by Market Segments
            17.1.8.4. Sales Footprint
            17.1.8.5. Strategy Overview
                17.1.8.5.1. Marketing Strategy
                17.1.8.5.2. Product Strategy
                17.1.8.5.3. Channel Strategy
        17.1.9. SAMWHA Electric.
            17.1.9.1. Overview
            17.1.9.2. Product Portfolio
            17.1.9.3. Profitability by Market Segments
            17.1.9.4. Sales Footprint
            17.1.9.5. Strategy Overview
                17.1.9.5.1. Marketing Strategy
                17.1.9.5.2. Product Strategy
                17.1.9.5.3. Channel Strategy
        17.1.10. Amidon Inc.
            17.1.10.1. Overview
            17.1.10.2. Product Portfolio
            17.1.10.3. Profitability by Market Segments
            17.1.10.4. Sales Footprint
            17.1.10.5. Strategy Overview
                17.1.10.5.1. Marketing Strategy
                17.1.10.5.2. Product Strategy
                17.1.10.5.3. Channel Strategy
18. Assumptions & Acronyms Used
19. Research Methodology
Recommendations

Technology

Banking as a Service (BaaS) Platform Market

August 2024

REP-GB-13992

323 pages

Technology

Core Banking Solution Market

October 2017

REP-GB-3395

306 pages

Explore Technology Insights

View Reports
Future Market Insights

Soft Ferrite Core Market

Schedule a Call