The Software-Defined Wide Area Network (SD-WAN) market is witnessing strong expansion driven by the rapid digital transformation across industries and the increasing need for agile, secure, and cost-efficient networking solutions. The market’s growth is primarily attributed to the rising adoption of cloud services, remote work trends, and the growing volume of data traffic that requires intelligent network management.
SD-WAN enables centralized control, optimized bandwidth utilization, and enhanced network visibility, which are critical for modern enterprise operations. The future outlook of the market is further shaped by continuous advancements in virtualization technologies, integration of AI for network automation, and the emphasis on zero-trust security frameworks.
Organizations are increasingly shifting from traditional WAN architectures to software-defined infrastructures to improve performance and reduce costs associated with hardware-intensive systems With the growing number of connected devices and applications, the SD-WAN market is expected to continue its upward trajectory, supported by widespread adoption across sectors such as BFSI, IT, healthcare, and manufacturing.
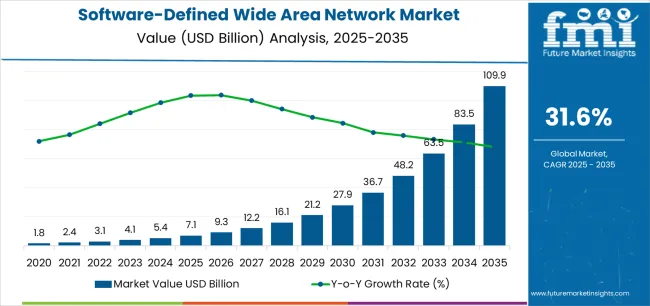
| Metric | Value |
|---|---|
| Software-Defined Wide Area Network Market Estimated Value in (2025 E) | USD 7.1 billion |
| Software-Defined Wide Area Network Market Forecast Value in (2035 F) | USD 109.9 billion |
| Forecast CAGR (2025 to 2035) | 31.6% |
The market is segmented by Component, Deployment, Organization Size, and End User and region. By Component, the market is divided into Solution and Services. In terms of Deployment, the market is classified into Cloud and On-Premises. Based on Organization Size, the market is segmented into Large Enterprises and SMEs. By End User, the market is divided into BFSI, Manufacturing, Transport & Logistics, Healthcare, Government, Retail, and Others. Regionally, the market is classified into North America, Latin America, Western Europe, Eastern Europe, Balkan & Baltic Countries, Russia & Belarus, Central Asia, East Asia, South Asia & Pacific, and the Middle East & Africa.
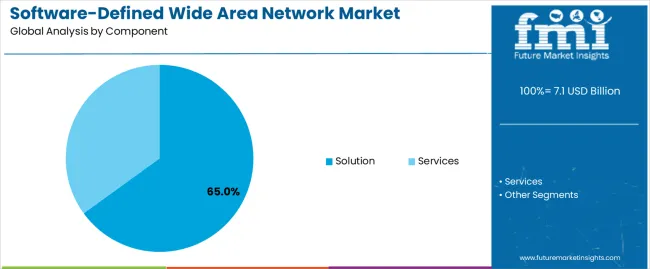
The solution component segment is projected to hold 65.00% of the SD-WAN market revenue share in 2025, establishing its position as the leading component category. This segment’s dominance is attributed to the increasing demand for comprehensive and integrated networking solutions that offer centralized control, traffic management, and security functions.
Enterprises are prioritizing SD-WAN solutions to improve network efficiency while reducing dependency on costly MPLS connections. The segment has gained traction as organizations seek to streamline their WAN operations through simplified management platforms that provide enhanced visibility and automation.
The growing implementation of hybrid and multi-cloud strategies has also driven demand for flexible and scalable SD-WAN solutions Continuous innovations in software-defined networking, coupled with the ability to support application-aware routing and dynamic path selection, have further reinforced the prominence of this segment within the overall market.
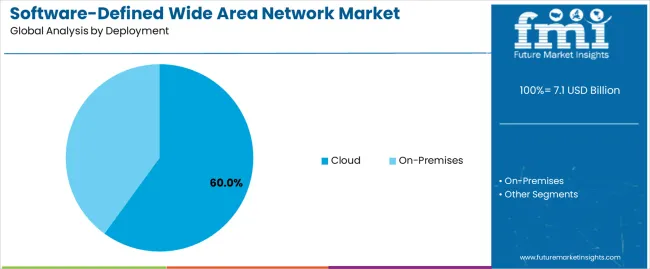
The cloud deployment segment is expected to account for 60.00% of the SD-WAN market revenue share in 2025, making it the leading deployment model. This growth is driven by the increasing shift of enterprises toward cloud-native environments that require dynamic connectivity and high scalability.
Cloud-based SD-WAN solutions enable businesses to deploy and manage networks globally without the need for extensive on-premise infrastructure, offering flexibility and cost efficiency. The rise in remote work and distributed branch operations has further boosted the adoption of cloud-based deployments.
Enhanced security, automated updates, and seamless integration with Software-as-a-Service (SaaS) and Infrastructure-as-a-Service (IaaS) platforms have made cloud deployment the preferred choice among enterprises Additionally, the ability to deliver centralized orchestration and policy control has positioned cloud-based SD-WAN as an essential enabler of digital transformation strategies, driving its continued dominance in the market.
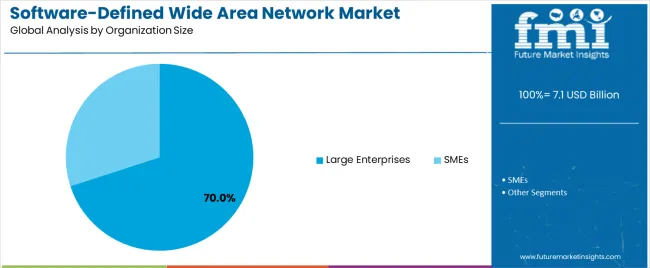
The large enterprises segment is anticipated to account for 70.00% of the SD-WAN market revenue in 2025, positioning it as the dominant organization size category. This leadership is attributed to the complex network requirements and high data traffic volumes managed by large enterprises, which demand robust, scalable, and secure SD-WAN solutions.
The adoption has been accelerated by the need to enhance connectivity across multiple global locations while maintaining consistent performance and security standards. Large organizations are leveraging SD-WAN to achieve centralized management, cost optimization, and greater operational agility.
The growing focus on digital resilience and business continuity has also played a pivotal role in driving adoption within this segment Furthermore, the integration of analytics, AI, and automation within SD-WAN architectures has empowered large enterprises to make data-driven decisions, improve network uptime, and ensure optimized user experiences across distributed workforces.
The below table presents the expected CAGR for the global software-defined wide area network market over several semi-annual periods spanning from 2025 to 2035. This assessment outlines changes in the memory interconnect industry and identify revenue trends, offering key decision makers an understanding about market performance throughout the year.
H1 represents first half of the year from January to June, H2 spans from July to December, which is the second half. In the first half (H1) of the year from 2025 to 2035, the business is predicted to surge at a CAGR of 30.8%, followed by a slightly higher growth rate of 31.1% in the second half (H2) of the same decade.
| Particular | Value CAGR |
|---|---|
| H1(2025 to 2035) | 30.8% |
| H2(2025 to 2035) | 31.1% |
| H1(2025 to 2035) | 30.5% |
| H2(2025 to 2035) | 31.3% |
Moving into the subsequent period, from H1 2025 to H2 2035, the CAGR is projected to increase slightly to 30.5% in the first half and remain higher at 31.3% in the second half. In the first half (H1) the market witnessed a decrease of 30 BPS and in the second half (H2), the market witnessed an increase of 20 BPS.
Rising Cloud Adoption Drives Surge in SD-WAN Solutions for Improved Network Efficiency
The demand for SD-WAN solutions has grown significantly as many businesses has shifted their operations to the cloud. Traditional networks often fight to keep up with the dynamic needs of cloud-based applications which LED to slow performance and increased costs.
SD-WAN offers a more effective way to manage network traffic by vigorously routing data based on real-time conditions, ensuring that critical cloud services run smoothly. For example, a company using Salesforce or Office 365 can trust on SD-WAN to highlight these cloud services, ensuring fast and reliable access for users.
For example, Starbucks has implemented SD-WAN to recover connectivity across its thousands of stores. By adopting SD-WAN, Starbucks was able to increase the performance of its cloud-based applications ensuring that everything from point-of-sale systems to inventory management ran proficiently. This capability to heighten and manage cloud traffic efficiently has made SD-WAN a crucial technology for businesses assumption cloud services.
Increasing Deployment of SD-WAN in Edge Computing Environments to Enhance Local Data Processing
The rise of edge computing has considerably increased the deployment of SD-WAN, as industries look to process data earlier to where it is produced. Edge computing decreases the need to send data back to central data centers, which can slow down processing and lead to delays. SD-WAN plays a critical role in this environment by providing a flexible, well-organized way to manage network traffic at the edge safeguarding that local applications and devices operate easily and in real-time.
For example, a manufacturing company using IoT sensors on its production line can advantage from SD-WAN by safeguarding that data from these devices is managed quickly and proficiently at the edge, deprived of the delays that can occur if data must travel to a distant data center.
This improves the speed of decision-making but also improves the overall efficiency of the manufacture process. As edge computing endures to grow the integration of SD-WAN in these environments is flattering a key development in the industry.
Customized SD-WAN Solutions Boost Healthcare and Manufacturing Efficiency and Security
Rising customized SD-WAN solutions for specific industries like healthcare and manufacturing is growing rapidly. Healthcare organizations require secure, reliable and high-performance networks to handle sensitive patient data, support telemedicine and ensure seamless communication across multiple amenities. SD-WAN solutions tailored for healthcare can prioritize critical applications like electronic health records (EHRs) and telehealth services, safeguarding the function smoothly even during peak usage times. For example, a hospital network can implement SD-WAN to enhance bandwidth for real-time video consultations while continuing strict security protocols to protect patient information.
In manufacturing, modified SD-WAN solutions can improve operational efficiency by refining connectivity between factories, warehouses and offices. Manufacturers rely on real-time data from Internet of Things (IoT) devices, automated machinery and supply chain systems to improve production processes.
A personalized SD-WAN solution can confirm that these data flows are uninterrupted, reducing downtime and boosting productivity. For instance, a manufacturing establishment could use SD-WAN to connect its global operations, ensuring reliable and fast data transfer between different locations, eventually leading to more agile and approachable production systems.
Integration Challenges with Existing Infrastructure Hinder the Adoption of Legacy Network Infrastructure
Incorporating SD-WAN with present network infrastructure can be precisely challenging due to the need for compatibility and seamless integration. For example, a company with a legacy network may struggle to incorporate SD-WAN without producing disturbances or demanding significant reconfiguration.
This process includes aligning the new SD-WAN technology with existing routers, switches and firewalls, which can be complex and time-consuming. Businesses often face problems in safeguarding that the SD-WAN solution works easily with their current systems and meets specific performance and security necessities.
Additionally, the integration process may need specialized skills and resources, which some organizations might lack. For example, a medium-sized enterprise might not have the in-house expertise to handle the practical aspects of integration, foremost to increased reliance on external consultants. This can result in higher costs and longer application times. Therefore, careful planning and provision are vital to overpowering these integration challenges effectively.
The Software-Defined Wide Area Network (SD-WAN) industry from 2020 to 2025 has seen an important growth as there was an increase in the networking solutions which has risen the need for high actual and flexible solutions.
The demand for SD-WAN was drove by the rising reliance on cloud applications and remote work and enduring investments in progressive networking technologies. This period saw a steady increase in market size as administrations required to enhance their network performance and reduce costs through SD-WAN implementation.
Looking ahead, the SD-WAN industry is predictable to continue its vigorous expansion from 2025 to 2035, like the acceleration of high adoption of cloud services, the rollout of 5G networks and advancements in edge computing. The demand for improved connectivity solutions in emerging technologies and the need for better data transfer abilities are predictable to propel the industry forward by leading to considerable growth in the coming period.
Tier 1 consist of global giants with extensive market reach and high influence. Tier 1 vendors dominating the market due to product portfolios and strong global presence. Tier 1 vendors such as Cisco Systems, VMware, and Fortinet. Tier 1 vendors holds around 45% to 50% reflects substantial role in advancing SD-WAN technology including integrated solutions and managed services.
Tier 2 includes significant companies with focused on strong regional presence and specialized offerings. Tier 2 vendors such as Aryaka Networks, Silver Peak (a part of HPE) and Barracuda Networks caters around 15-20%. Tier 2 vendors focus offering specialized solutions such as cloud-based SD-WAN services and advanced network optimization.
Tier 3 includes smaller, emerging vendors and regional players with specialized solutions. Tier 3 vendors offer unique or localized products such as specific cabling technologies or managed services tailoring to particular markets. Tier 3 vendors include CloudGenix (acquired by Palo Alto Networks), Nuage Networks (Nokia), and TPX Communications and others caters around 25% to 30%.
The section highlights the CAGRs of countries experiencing growth in the Software-Defined Wide Area Network market, along with the latest advancements contributing to overall market development. Based on current estimates China, India and Germany are expected to see steady growth during the forecast period.
| Countries | CAGR from 2025 to 2035 |
|---|---|
| India | 20.6% |
| China | 18.7% |
| Germany | 14.8% |
| South Korea | 21.6% |
| United States | 19.8% |
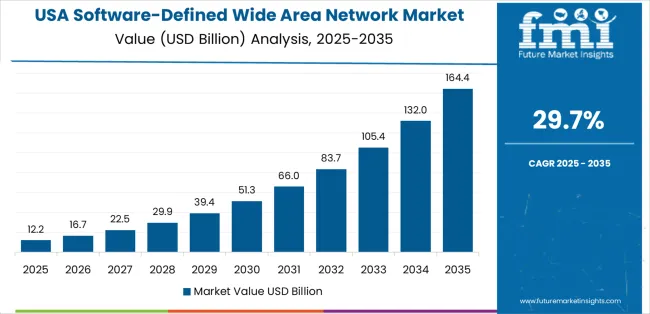
United states have been foremost in innovation and maintaining a competitive edge in the industry, which has also LED to the rising the adoption of SD-WAN technology. Companies are gradually leveraging SD-WAN to rapidly organize new services and applications, allowing them to stay ahead of competitors in a fast-paced business environment.
For instance, Verizon's SD-WAN solution helps industries modernize their network management and quicken the rollout of new services such as advanced cloud applications, which are important for continuing a competitive advantage. This empowers businesses to get familiarize to changing market conditions and customer demands more rapidly.
Also, the ability of SD-WAN to optimize network performance and reduce operational costs supports innovation efforts. Like Cisco they offer features that improve network visibility and control, allowing companies to experiment with new technologies and corporate models without worrying about network limitations.
By using SD-WAN, USA industries can deploy applications with minimal latency and better performance, which is vital for remaining competitive in digital landscape.This focus on productivity and swiftness underlines why SD-WAN has been foremost in innovation and competitive positioning in the USA industry.
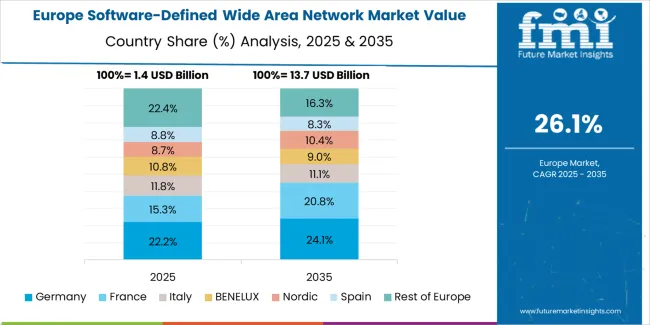
Germany’s push toward Industry 4.0 is considerably furthering the demand for SD-WAN solutions. As the country’s manufacturers incorporate smart technologies and IoT applications they require advanced network connectivity to support real-time data exchange and automation. For example, Siemens, a leading industrial giant, has adopted SD-WAN to enhance connectivity across its global manufacturing facilities allowing seamless communication and data transmission for its Industry 4.0 projects.
Also, Bosch, major player in manufacturing sector uses SD-WAN to safeguard reliable and secure connections for its IoT devices. This technology helps Bosch continue well-organized operations and real-time monitoring of its production lines, demonstrating how SD-WAN supports Germany's smart engineering goals.
In China, government initiatives such as “Made in China 2025” plan are vital in pouring the adoption of SD-WAN. This plan aims to improve the country's manufacturing abilities and technology infrastructure. For example, Huawei's deployment of SD-WAN solutions supports smart city projects by involving various city services and sensors enlightening efficiency and data management across urban areas. This network infrastructure is vivacious for managing the vast amount of data generated by these smart technologies.
Also, the push for smart cities in China, demonstrated by the city of Shenzhen’s smart grid projects, leverages SD-WAN to assimilate and manage large-scale, geographically distributed networks. These SD-WAN solutions certify vigorous, reliable connectivity necessary for real-time data collection and handling in smart city environments.
The solutions segment has soared the industry due to its inclusive benefits for enterprises. Companies like Cisco and VMware offer robust SD-WAN solutions that provide enhanced network visibility, security and performance optimization. For example, Cisco's Meraki SD-WAN integrates seamlessly with existing network infrastructure, streamlining deployment and management while transporting improved application performance.
Moreover, solutions such as those from Fortinet offer advanced security features integrated with SD-WAN, addressing the growing need for secure and efficient network management. This incorporation is important as businesses gradually demand more than just connectivity they need complete solutions that ensure security, reliability, and ease of management.
| Segment | Solutions (Component Type) |
|---|---|
| Value Share (2025) | 15.6% |
The BFSI sector is dominating the SD-WAN industry due to its precarious need for secure, reliable, and high-performance network solutions. Financial institutions necessitate robust connectivity to support transaction processing, secure data handling and compliance with stringent regulations. For example, JPMorgan Chase has applied SD-WAN to improve its network security and improve application routine across its global branches safeguarding fast and secure financial transactions.
Moreover, the growing focus on digital banking and online financial services energies the demand for SD-WAN solutions in this sector. According to industry data, banks are investing heavily in SD-WAN to accomplish their complex networks efficiently and reduce operational costs. This investment trend highlights the BFSI sector's significant role in the SD-WAN industry.
| Segment | BFSI (End User) |
|---|---|
| Value Share (2025) | 24.3% |
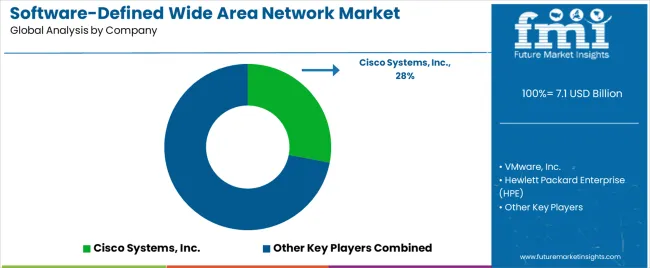
The software-defined wide area network market is very competitive with major key players fueling innovation and expanding global presence. Vendors are focused on enhancing network, speed and infrastructure. Strategic partnerships and technological advancements are propelling the growth and driving significant progress.
Industry Update
In terms of component, the segment is divided into solution and services.
In terms of deployment, the segment is segregated into on-premises and cloud.
In terms of organization size, the segment is segregated into SMEs and large enterprises
In terms of end user, the segment is segregated into BFSI, manufacturing, transport & logistics, healthcare, government, retail and others.
A regional analysis has been carried out in key countries of North America, Latin America, East Asia, South Asia & Pacific, Western Europe, Eastern Europe and Middle East and Africa (MEA).
The global software-defined wide area network market is estimated to be valued at USD 7.1 billion in 2025.
The market size for the software-defined wide area network market is projected to reach USD 109.9 billion by 2035.
The software-defined wide area network market is expected to grow at a 31.6% CAGR between 2025 and 2035.
The key product types in software-defined wide area network market are solution and services.
In terms of deployment, cloud segment to command 60.0% share in the software-defined wide area network market in 2025.


Our Research Products

The "Full Research Suite" delivers actionable market intel, deep dives on markets or technologies, so clients act faster, cut risk, and unlock growth.

The Leaderboard benchmarks and ranks top vendors, classifying them as Established Leaders, Leading Challengers, or Disruptors & Challengers.

Locates where complements amplify value and substitutes erode it, forecasting net impact by horizon

We deliver granular, decision-grade intel: market sizing, 5-year forecasts, pricing, adoption, usage, revenue, and operational KPIs—plus competitor tracking, regulation, and value chains—across 60 countries broadly.

Spot the shifts before they hit your P&L. We track inflection points, adoption curves, pricing moves, and ecosystem plays to show where demand is heading, why it is changing, and what to do next across high-growth markets and disruptive tech

Real-time reads of user behavior. We track shifting priorities, perceptions of today’s and next-gen services, and provider experience, then pace how fast tech moves from trial to adoption, blending buyer, consumer, and channel inputs with social signals (#WhySwitch, #UX).

Partner with our analyst team to build a custom report designed around your business priorities. From analysing market trends to assessing competitors or crafting bespoke datasets, we tailor insights to your needs.
Supplier Intelligence
Discovery & Profiling
Capacity & Footprint
Performance & Risk
Compliance & Governance
Commercial Readiness
Who Supplies Whom
Scorecards & Shortlists
Playbooks & Docs
Category Intelligence
Definition & Scope
Demand & Use Cases
Cost Drivers
Market Structure
Supply Chain Map
Trade & Policy
Operating Norms
Deliverables
Buyer Intelligence
Account Basics
Spend & Scope
Procurement Model
Vendor Requirements
Terms & Policies
Entry Strategy
Pain Points & Triggers
Outputs
Pricing Analysis
Benchmarks
Trends
Should-Cost
Indexation
Landed Cost
Commercial Terms
Deliverables
Brand Analysis
Positioning & Value Prop
Share & Presence
Customer Evidence
Go-to-Market
Digital & Reputation
Compliance & Trust
KPIs & Gaps
Outputs
Full Research Suite comprises of:
Market outlook & trends analysis
Interviews & case studies
Strategic recommendations
Vendor profiles & capabilities analysis
5-year forecasts
8 regions and 60+ country-level data splits
Market segment data splits
12 months of continuous data updates
DELIVERED AS:
PDF EXCEL ONLINE
Low Power Wide Area Network (LPWAN) Market Size and Share Forecast Outlook 2025 to 2035
Software-Defined Wide Area Network SD-WAN Market Size and Share Forecast Outlook 2025 to 2035
Storage Area Network (SAN) Market Analysis by Component, SAN Type, Technology, Vertical, and Region through 2035
Smart Grid Home Area Network (HAN) Market Size and Share Forecast Outlook 2025 to 2035
Area Gripper Market Size and Share Forecast Outlook 2025 to 2035
Wide Temperature MEMS Oscillator Market Size and Share Forecast Outlook 2025 to 2035
Network Simulator Software Market Size and Share Forecast Outlook 2025 to 2035
Network Connectivity Tester Market Size and Share Forecast Outlook 2025 to 2035
Network Analyzers Market Size and Share Forecast Outlook 2025 to 2035
Network as a Service (NaaS) Market Size and Share Forecast Outlook 2025 to 2035
Network Analytics Market Size and Share Forecast Outlook 2025 to 2035
Network Devices Market Size and Share Forecast Outlook 2025 to 2035
Network Sandboxing Market Size and Share Forecast Outlook 2025 to 2035
Network Access Control (NAC) Market Size and Share Forecast Outlook 2025 to 2035
Network Monitoring Market Size and Share Forecast Outlook 2025 to 2035
Network Encryption Market Size and Share Forecast Outlook 2025 to 2035
Network Packet Broker Market Size and Share Forecast Outlook 2025 to 2035
Network Traffic Analytics Market Size and Share Forecast Outlook 2025 to 2035
Network Function Virtualization (NFV) Market Size and Share Forecast Outlook 2025 to 2035
Network Cable Tester Market Size and Share Forecast Outlook 2025 to 2035

Thank you!
You will receive an email from our Business Development Manager. Please be sure to check your SPAM/JUNK folder too.
Chat With
MaRIA