Reports

- Global Locations -

Headquarters

Future Market Insights, Inc.

Christiana Corporate, 200
Continental Drive, Suite 401,
Newark, Delaware - 19713,
United States

T: +1-845-579-5705

Americas

Future Market Insights, Inc.

616 Corporate Way, Suite 2-9018,
Valley Cottage, NY 10989, United States

T: +1-347-918-3531

MEA

Future Market Insights

1602-6 Jumeirah Bay X2 Tower, Plot No: JLT-PH2-X2A,
Jumeirah Lakes Towers, Dubai,
United Arab Emirates

Europe

Future Market Insights

3rd Floor, 207 Regent Street,
W1B 3HH London
United Kingdom

T: + 44 (0) 20 8123 9659
D: +44 (0) 20 3287 4268

Asia Pacific

Future Market Insights

IndiaLand Global Tech Park, Unit UG-1, Behind Grand HighStreet, Phase 1, Hinjawadi, MH, Pune – 411057, India

Network Optimization Market Outlook (2022-2032)

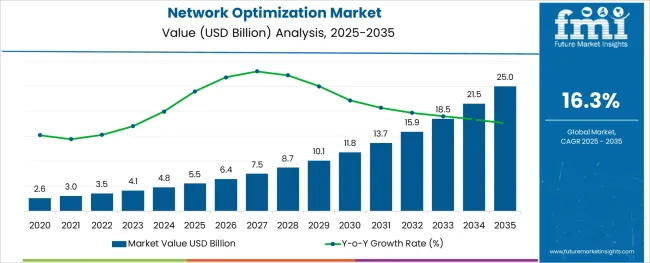
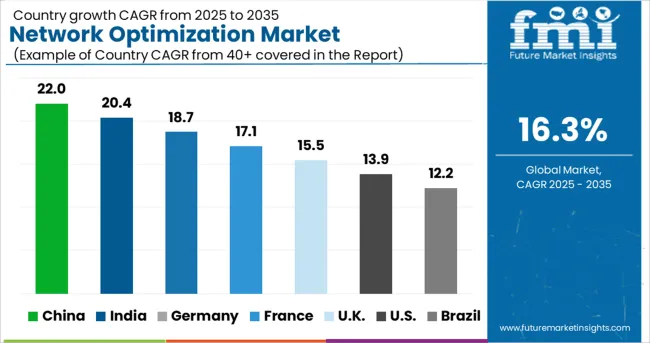
[342 Pages Report] The global network optimization market is forecasted to reach US$ 15859.7 million by 2032, up from US$ 3513.2 million in 2022, expanding at a CAGR of 16.3% through 2032.

Network optimization enables larger amounts of data to be transferred over the network without needing additional bandwidth. As a result, the demand for network optimization is surging, owing to expanding businesses and the availability of restricted bandwidth.

Network optimization encompasses the tools, technologies, and techniques which assist in improving, maintaining, or maximizing performance across all network domains. These components are utilized to manage, monitor, and optimize the performance metrics to ensure the maximum levels of services for users in all networks. All-in-all, the network optimization market is likely to grow at a strong rate through 2032.

Report Attribute Details
Network Optimization Market Value (2022) US$ 3513.2 Million
Network Optimization Market Anticipated Value (2032) US$ 15859.7 Million
Network Optimization Projected Growth Rate (2022-2032) 16.3%

The primary goal of network optimization is to give users the best possible network experience. Network performance optimization is crucial as the interrelated real-time world is completely dependent on the secure, reliable, and available transfer of data.

Network optimization has witnessed a great impact on various businesses by altering the way businesses broadcast information to their employees. Network optimization is a technology by which a huge amount of data can be transferred in a constant method by compressing and prioritizing the data, streamlining the process, staging the local caches, and removing duplicate broadcasts.

These techniques assisted in saving the bandwidth and improved the network performance by escalating the transfer speed. This technology is used to level novel applications and undertake projects. The market sales of network optimization are lucratively rising and are said to grow exponentially during the forecast period. It is used when there is a demand for network performance upgradation for any given or proposed situation.

The key market driving factor and the demand for network optimization market are rising need for information technology, and this assists in generating a greater volume of data. Moreover, the COVID-19 pandemic lucratively affected the network optimization services market due to considerable modification towards accepting digital and online platforms along with remote working policies. This led to an additional load on enterprise network architecture and an increasing prevalence of cyber-attacks and cyber threats.

Don't pay for what you don't need

Customize your report by selecting specific countries or regions and save 30%!

How is the Driver-to-Restraint Influence on the Network Optimization Market?

The primary factor driving the global network optimization market is fast growth in IP and Ethernet services. Consequently, the rising number of users coupled with restricted bandwidth, and availability of organizations, might experience problems in bulk data transfer over the internet.

Furthermore, in recent years all organizations are majorly concerned regarding the transfer of data and are thus shifting to web-based versions for easily accessing remote employees and expanding data transfer security. However, this shift to web-based versions leads to a heavy load on the network, and this results in lower performance output on an occasional basis.

Many service providers are advancing towards global and regional growth by making use of software-as-a-service (SaaS) technology. These technologies assist in enhancing the markets by rendering solutions which are playing a significant role in uplifting the revenue development of the network optimization services market.

The increasing demand for VoIP (Voice over Internet Protocol) services across enterprises is promoting the network optimization market growth. With the increasing need for VoIP services demanding a huge amount of high-speed internet connectivity, enterprises have a considerable impact on the need for optimizing their network to enhance functional efficiency.

By implementing technology, businesses can enjoy seamless transmission of data. Moreover, network optimization can deal with real-time applications, which include pre-population of on-demand video, Voice over Internet Protocol (VoIP), and streamlining of video, among other features. These factors assist in advantages rendered by network optimization technology and, therefore, the need of the hour for all businesses regardless of their functional field.

Given the number of prominent drivers, the network optimization market is likely to thrive significantly during the forecast period.

“The growth momentum of the network optimization market is not without any roadblock.”

There is a significant lack of awareness pertaining to the advantages offered, especially in the developing region, regarding the network optimization service. As a result, it could cause a hindrance in the global network optimization market. In developing countries, many companies do not comprehend the advantages of network and optimizing services. Network optimization services can assist in faster transfer of data, disaster recovery, transfer of massive data, and response to time restrictions of various interactive applications like database and software applications.

A crucial leap in RAN and WAN optimization technology offers several opportunities in the network optimization market. Developments in technologies for RAN and WAN optimization assist in the transmission of ample data and solutions for data traffic. This helps in the market growth of network optimization across the world and renders opportunities for growth of the market during the forecast period. Lastly, a shortage of awareness pertaining to network optimization and high initial investments are the primary reasons which have negatively affected the growth of the global network optimization market.

Outcome Forecast: All-in-all, the network optimization market is likely to have a healthy growth rate during the forecast period, as the influence of the driver is prominently observed over the restraints.
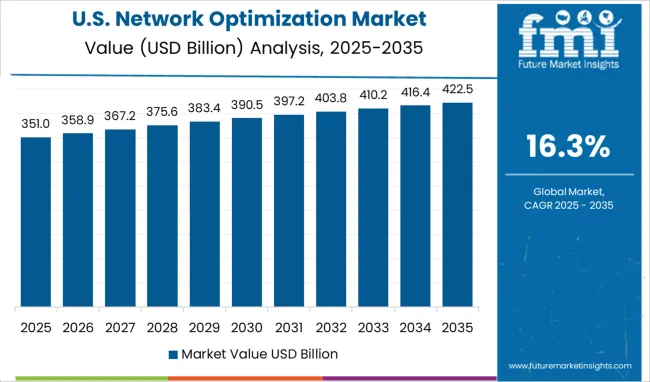
‘Cloud’ to Shower Profitability in Abundance in North American Network Optimization Market

North America is anticipated to experience a remarkable growth during the forecast period. North America is responsible for holding a 35.20% share of the global network optimization market by the end of 2022. The key factor accountable for this growth is the increasing adoption of novel technologies such as cloud-based platforms and smartphones.

Moreover, the positioning of cloud-based systems and solutions and services are delivered via online mode. These are responsible for the growth of the North American network optimization market. To strengthen their position and support in the global network optimization services market, many key market players in this region are adopting some inert strategies.
Sudip Saha
Sudip Saha

Principal Consultant

Talk to Analyst

Find your sweet spots for generating winning opportunities in this market.

Asia Pacific to Leap the Highest in the Network Optimization Market through 2032

Asia Pacific is said to garner the highest CAGR during the forecast period. This region is presently one of the swiftest growing network optimization markets. In the Asia Pacific, countries such as Japan, India, China, and Australia are four of the most significant contributors to the lucrative growth of the Asia Pacific network optimization market.

To enhance performance in a specific area, a network optimization technique is used. Network optimization is the primary factor that contributes to the efficient and effective management of information systems. Technology plays a significant role in and constantly evolves at an exponential rate.

Low Entry Barriers Unlocks Wide Opportunities for the Network Optimization Market

The network optimization industry opens numerous opportunities for new entrants who focus on segments such as cybersecurity. In April 2022, AMD declared that it would be acquiring data centre optimization start-up, Pensando, for approximately $1.9 billion.

In April 2022, Intel announced that it would reportedly buy cloud optimization start-up Granulate for $650 million. In October 2021, Deci, an AI model optimization start-up based in Tel Aviv, Israel, announced that it raised $21 million, which will be utilized to encourage the growth of the company by expanding marketing, sales, and service operations.
Get the data you need at a Fraction of the cost

Personalize your report by choosing insights you need
and save 40%!

Technological Innovations is the Way Out of the Rat Race in Network Optimization Market

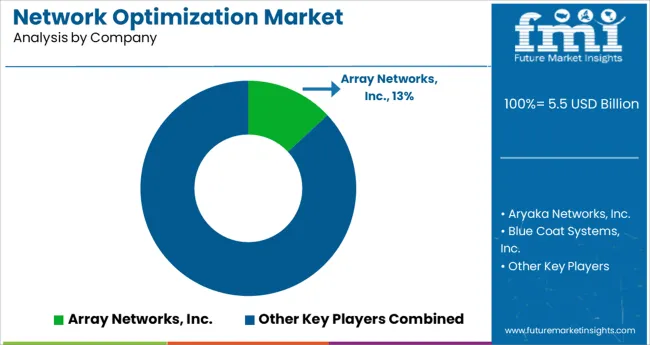
Some of the key players in the network optimization market are Array Networks, Inc., Aryaka Networks, Inc., Blue Coat Systems, Inc., CISCO Systems Inc., Circadence Corporation, Citrix Systems, Inc., Exinda, Ipanema Technologies, InfoVista, and Riverbed Technology and Silver Peak, Inc.

High Investment in R&D and continuous technological innovations to eliminate network issues pertaining to data transfer is the key strategy followed by major market vendors to gain a competitive edge. In April 2021, Cisco Systems, Inc. had a strategic partnership with Circadence Corporation to help expand global deployments of 5G IP transport networks. Besides, in October 2020, InfoVista had a collaboration with Rakuten Mobile to assist in delivering cloud-based network planning services to deploy 5G.

Report Scope

Report Attribute Details
Growth Rate CAGR of 16.30% from 2022 to 2032
Base Year for Estimation 2021
Historical Data 2016-2021
Forecast Period 2022-2032
Quantitative Units Revenue in USD million and CAGR from 2022-2032
Report Coverage Revenue Forecast, Volume Forecast, Company Ranking, Competitive Landscape, Growth Factors, Trends and Pricing Analysis
Segments Covered
  • Deployment Type
  • Verticals
  • Region
Regions Covered
  • North America
  • Latin America
  • Europe
  • East Asia
  • South Asia
  • Oceania
  • Middle East and Africa
Key Countries Profiled
  • USA
  • Canada
  • Brazil
  • Argentina
  • Germany
  • UK
  • France
  • Spain
  • Italy
  • Nordics
  • BENELUX
  • Australia & New Zealand
  • China
  • India
  • ASEAN
  • GCC
  • South Africa
Key Companies Profiled
  • Array Networks, Inc.
  • Aryaka Networks, Inc.
  • Blue Coat Systems, Inc.
  • CISCO Systems Inc.
  • Circadence Corporation
  • Citrix Systems, Inc.
  • Exinda
  • Ipanema Technologies
  • Riverbed Technology and Silver Peak, Inc.
  • InfoVista
Customization Available Upon Request

Key Segments of the Network Optimization Market

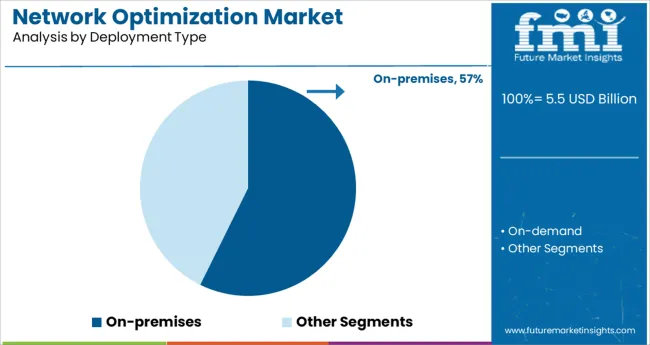
By Deployment Type:

  • On-premises
  • On-demand

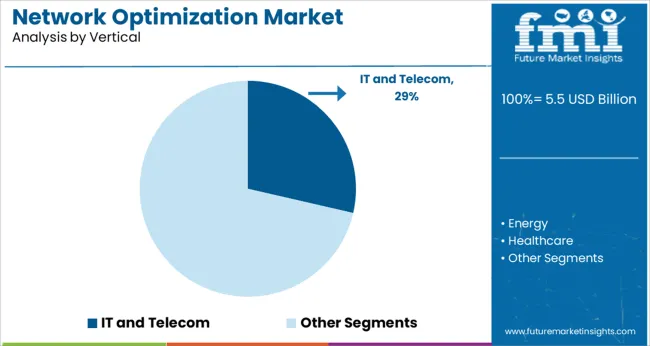
By Vertical:

  • IT and Telecom
  • Energy
  • Healthcare
  • Manufacturing
  • Retail
  • Others

By Region:

  • North America
  • Latin America
  • Asia Pacific
  • MEA
  • Europe

Frequently Asked Questions

What is the Growth Outlook for the Network Optimization Market?

The network optimization market is predicted to advance at a CAGR of 16.3% through 2032.

Which Region Leads the Network Optimization Market?

North America is the leading network optimization market during the forecast period.

How much Growth Potential does the Network Optimization Market hold?

The network optimization market is likely to hold a valuation of US$ 15859.7 million by 2032.

Table of Content

1. Executive Summary

    1.1. Global Market Outlook

    1.2. Demand-side Trends

    1.3. Supply-side Trends

    1.4. Technology Roadmap Analysis

    1.5. Analysis and Recommendations

2. Market Overview

    2.1. Market Coverage / Taxonomy

    2.2. Market Definition / Scope / Limitations

3. Market Background

    3.1. Market Dynamics

        3.1.1. Drivers

        3.1.2. Restraints

        3.1.3. Opportunity

        3.1.4. Trends

    3.2. Scenario Forecast

        3.2.1. Demand in Optimistic Scenario

        3.2.2. Demand in Likely Scenario

        3.2.3. Demand in Conservative Scenario

    3.3. Opportunity Map Analysis

    3.4. Investment Feasibility Matrix

    3.5. PESTLE and Porter’s Analysis

    3.6. Regulatory Landscape

        3.6.1. By Key Regions

        3.6.2. By Key Countries

    3.7. Regional Parent Market Outlook

4. Global Network Optimization Market Analysis 2017-2021 and Forecast, 2022-2032

    4.1. Historical Market Size Value (US$ Mn) Analysis, 2017-2021

    4.2. Current and Future Market Size Value (US$ Mn) Projections, 2022-2032

        4.2.1. Y-o-Y Growth Trend Analysis

        4.2.2. Absolute $ Opportunity Analysis

5. Global Network Optimization Market Analysis 2017-2021 and Forecast 2022-2032, By Deployment Type

    5.1. Introduction / Key Findings

    5.2. Historical Market Size Value (US$ Mn) Analysis By Deployment Type, 2017-2021

    5.3. Current and Future Market Size Value (US$ Mn) Analysis and Forecast By Deployment Type, 2022-2032

        5.3.1. On-Premises

        5.3.2. On-Demand

    5.4. Y-o-Y Growth Trend Analysis By Deployment Type, 2017-2021

    5.5. Absolute $ Opportunity Analysis By Deployment Type, 2022-2032

6. Global Network Optimization Market Analysis 2017-2021 and Forecast 2022-2032, By Verticals

    6.1. Introduction / Key Findings

    6.2. Historical Market Size Value (US$ Mn) Analysis By Verticals, 2017-2021

    6.3. Current and Future Market Size Value (US$ Mn) Analysis and Forecast By Verticals, 2022-2032

        6.3.1. IT and Telecom

        6.3.2. Energy

        6.3.3. Healthcare

        6.3.4. Manufacturing

        6.3.5. Retail

    6.4. Y-o-Y Growth Trend Analysis By Verticals, 2017-2021

    6.5. Absolute $ Opportunity Analysis By Verticals, 2022-2032

7. Global Network Optimization Market Analysis 2017-2021 and Forecast 2022-2032, By Region

    7.1. Introduction

    7.2. Historical Market Size Value (US$ Mn) Analysis By Region, 2017-2021

    7.3. Current Market Size Value (US$ Mn) Analysis and Forecast By Region, 2022-2032

        7.3.1. North America

        7.3.2. Latin America

        7.3.3. Europe

        7.3.4. Asia Pacific

        7.3.5. MEA

    7.4. Market Attractiveness Analysis By Region

8. North America Network Optimization Market Analysis 2017-2021 and Forecast 2022-2032, By Country

    8.1. Historical Market Size Value (US$ Mn) Trend Analysis By Market Taxonomy, 2017-2021

    8.2. Market Size Value (US$ Mn) Forecast By Market Taxonomy, 2022-2032

        8.2.1. By Country

            8.2.1.1. U.S.

            8.2.1.2. Canada

        8.2.2. By Deployment Type

        8.2.3. By Verticals

    8.3. Market Attractiveness Analysis

        8.3.1. By Country

        8.3.2. By Deployment Type

        8.3.3. By Verticals

    8.4. Key Takeaways

9. Latin America Network Optimization Market Analysis 2017-2021 and Forecast 2022-2032, By Country

    9.1. Historical Market Size Value (US$ Mn) Trend Analysis By Market Taxonomy, 2017-2021

    9.2. Market Size Value (US$ Mn) Forecast By Market Taxonomy, 2022-2032

        9.2.1. By Country

            9.2.1.1. Brazil

            9.2.1.2. Mexico

            9.2.1.3. Rest of Latin America

        9.2.2. By Deployment Type

        9.2.3. By Verticals

    9.3. Market Attractiveness Analysis

        9.3.1. By Country

        9.3.2. By Deployment Type

        9.3.3. By Verticals

    9.4. Key Takeaways

10. Europe Network Optimization Market Analysis 2017-2021 and Forecast 2022-2032, By Country

    10.1. Historical Market Size Value (US$ Mn) Trend Analysis By Market Taxonomy, 2017-2021

    10.2. Market Size Value (US$ Mn) Forecast By Market Taxonomy, 2022-2032

        10.2.1. By Country

            10.2.1.1. Germany

            10.2.1.2. U.K.

            10.2.1.3. France

            10.2.1.4. Spain

            10.2.1.5. Italy

            10.2.1.6. Rest of Europe

        10.2.2. By Deployment Type

        10.2.3. By Verticals

    10.3. Market Attractiveness Analysis

        10.3.1. By Country

        10.3.2. By Deployment Type

        10.3.3. By Verticals

    10.4. Key Takeaways

11. Asia Pacific Network Optimization Market Analysis 2017-2021 and Forecast 2022-2032, By Country

    11.1. Historical Market Size Value (US$ Mn) Trend Analysis By Market Taxonomy, 2017-2021

    11.2. Market Size Value (US$ Mn) Forecast By Market Taxonomy, 2022-2032

        11.2.1. By Country

            11.2.1.1. China

            11.2.1.2. Japan

            11.2.1.3. South Korea

            11.2.1.4. India

            11.2.1.5. Malaysia

            11.2.1.6. Singapore

            11.2.1.7. Australia

            11.2.1.8. New Zealand

            11.2.1.9. Rest of APAC

        11.2.2. By Deployment Type

        11.2.3. By Verticals

    11.3. Market Attractiveness Analysis

        11.3.1. By Country

        11.3.2. By Deployment Type

        11.3.3. By Verticals

    11.4. Key Takeaways

12. MEA Network Optimization Market Analysis 2017-2021 and Forecast 2022-2032, By Country

    12.1. Historical Market Size Value (US$ Mn) Trend Analysis By Market Taxonomy, 2017-2021

    12.2. Market Size Value (US$ Mn) Forecast By Market Taxonomy, 2022-2032

        12.2.1. By Country

            12.2.1.1. GCC Countries

            12.2.1.2. South Africa

            12.2.1.3. Israel

            12.2.1.4. Rest of MEA

        12.2.2. By Deployment Type

        12.2.3. By Verticals

    12.3. Market Attractiveness Analysis

        12.3.1. By Country

        12.3.2. By Deployment Type

        12.3.3. By Verticals

    12.4. Key Takeaways

13. Key Countries Network Optimization Market Analysis

    13.1. U.S.

        13.1.1. Pricing Analysis

        13.1.2. Market Share Analysis, 2021

            13.1.2.1. By Deployment Type

            13.1.2.2. By Verticals

    13.2. Canada

        13.2.1. Pricing Analysis

        13.2.2. Market Share Analysis, 2021

            13.2.2.1. By Deployment Type

            13.2.2.2. By Verticals

    13.3. Brazil

        13.3.1. Pricing Analysis

        13.3.2. Market Share Analysis, 2021

            13.3.2.1. By Deployment Type

            13.3.2.2. By Verticals

    13.4. Mexico

        13.4.1. Pricing Analysis

        13.4.2. Market Share Analysis, 2021

            13.4.2.1. By Deployment Type

            13.4.2.2. By Verticals

    13.5. Germany

        13.5.1. Pricing Analysis

        13.5.2. Market Share Analysis, 2021

            13.5.2.1. By Deployment Type

            13.5.2.2. By Verticals

    13.6. U.K.

        13.6.1. Pricing Analysis

        13.6.2. Market Share Analysis, 2021

            13.6.2.1. By Deployment Type

            13.6.2.2. By Verticals

    13.7. France

        13.7.1. Pricing Analysis

        13.7.2. Market Share Analysis, 2021

            13.7.2.1. By Deployment Type

            13.7.2.2. By Verticals

    13.8. Spain

        13.8.1. Pricing Analysis

        13.8.2. Market Share Analysis, 2021

            13.8.2.1. By Deployment Type

            13.8.2.2. By Verticals

    13.9. Italy

        13.9.1. Pricing Analysis

        13.9.2. Market Share Analysis, 2021

            13.9.2.1. By Deployment Type

            13.9.2.2. By Verticals

    13.10. China

        13.10.1. Pricing Analysis

        13.10.2. Market Share Analysis, 2021

            13.10.2.1. By Deployment Type

            13.10.2.2. By Verticals

    13.11. Japan

        13.11.1. Pricing Analysis

        13.11.2. Market Share Analysis, 2021

            13.11.2.1. By Deployment Type

            13.11.2.2. By Verticals

    13.12. South Korea

        13.12.1. Pricing Analysis

        13.12.2. Market Share Analysis, 2021

            13.12.2.1. By Deployment Type

            13.12.2.2. By Verticals

    13.13. Malaysia

        13.13.1. Pricing Analysis

        13.13.2. Market Share Analysis, 2021

            13.13.2.1. By Deployment Type

            13.13.2.2. By Verticals

    13.14. Singapore

        13.14.1. Pricing Analysis

        13.14.2. Market Share Analysis, 2021

            13.14.2.1. By Deployment Type

            13.14.2.2. By Verticals

    13.15. Australia

        13.15.1. Pricing Analysis

        13.15.2. Market Share Analysis, 2021

            13.15.2.1. By Deployment Type

            13.15.2.2. By Verticals

    13.16. New Zealand

        13.16.1. Pricing Analysis

        13.16.2. Market Share Analysis, 2021

            13.16.2.1. By Deployment Type

            13.16.2.2. By Verticals

    13.17. GCC Countries

        13.17.1. Pricing Analysis

        13.17.2. Market Share Analysis, 2021

            13.17.2.1. By Deployment Type

            13.17.2.2. By Verticals

    13.18. South Africa

        13.18.1. Pricing Analysis

        13.18.2. Market Share Analysis, 2021

            13.18.2.1. By Deployment Type

            13.18.2.2. By Verticals

    13.19. Israel

        13.19.1. Pricing Analysis

        13.19.2. Market Share Analysis, 2021

            13.19.2.1. By Deployment Type

            13.19.2.2. By Verticals

14. Market Structure Analysis

    14.1. Competition Dashboard

    14.2. Competition Benchmarking

    14.3. Market Share Analysis of Top Players

        14.3.1. By Regional

        14.3.2. By Deployment Type

        14.3.3. By Verticals

15. Competition Analysis

    15.1. Competition Deep Dive

        15.1.1. Array Networks, Inc.

            15.1.1.1. Overview

            15.1.1.2. Product Portfolio

            15.1.1.3. Profitability by Market Segments

            15.1.1.4. Sales Footprint

            15.1.1.5. Strategy Overview

                15.1.1.5.1. Marketing Strategy

        15.1.2. Aryaka Networks, Inc.

            15.1.2.1. Overview

            15.1.2.2. Product Portfolio

            15.1.2.3. Profitability by Market Segments

            15.1.2.4. Sales Footprint

            15.1.2.5. Strategy Overview

                15.1.2.5.1. Marketing Strategy

        15.1.3. Blue Coat Systems, Inc.

            15.1.3.1. Overview

            15.1.3.2. Product Portfolio

            15.1.3.3. Profitability by Market Segments

            15.1.3.4. Sales Footprint

            15.1.3.5. Strategy Overview

                15.1.3.5.1. Marketing Strategy

        15.1.4. CISCO Systems Inc.

            15.1.4.1. Overview

            15.1.4.2. Product Portfolio

            15.1.4.3. Profitability by Market Segments

            15.1.4.4. Sales Footprint

            15.1.4.5. Strategy Overview

                15.1.4.5.1. Marketing Strategy

        15.1.5. Circadence Corporation

            15.1.5.1. Overview

            15.1.5.2. Product Portfolio

            15.1.5.3. Profitability by Market Segments

            15.1.5.4. Sales Footprint

            15.1.5.5. Strategy Overview

                15.1.5.5.1. Marketing Strategy

        15.1.6. Citrix Systems, Inc.

            15.1.6.1. Overview

            15.1.6.2. Product Portfolio

            15.1.6.3. Profitability by Market Segments

            15.1.6.4. Sales Footprint

            15.1.6.5. Strategy Overview

                15.1.6.5.1. Marketing Strategy

        15.1.7. Exinda

            15.1.7.1. Overview

            15.1.7.2. Product Portfolio

            15.1.7.3. Profitability by Market Segments

            15.1.7.4. Sales Footprint

            15.1.7.5. Strategy Overview

                15.1.7.5.1. Marketing Strategy

        15.1.8. Ipanema Technologies

            15.1.8.1. Overview

            15.1.8.2. Product Portfolio

            15.1.8.3. Profitability by Market Segments

            15.1.8.4. Sales Footprint

            15.1.8.5. Strategy Overview

                15.1.8.5.1. Marketing Strategy

        15.1.9. Riverbed Technology and Silver Peak, Inc.

            15.1.9.1. Overview

            15.1.9.2. Product Portfolio

            15.1.9.3. Profitability by Market Segments

            15.1.9.4. Sales Footprint

            15.1.9.5. Strategy Overview

                15.1.9.5.1. Marketing Strategy

        15.1.10. Aledade, Inc.

            15.1.10.1. Overview

            15.1.10.2. Product Portfolio

            15.1.10.3. Profitability by Market Segments

            15.1.10.4. Sales Footprint

            15.1.10.5. Strategy Overview

                15.1.10.5.1. Marketing Strategy

16. Assumptions & Acronyms Used

17. Research Methodology

Don't pay for what you don't need

Customize your report by selecting specific countries or regions and save 30%!

List of Tables

Table 1: Global Network Optimization Market Value (US$ Mn) Forecast by Region, 2017-2032

Table 2: Global Network Optimization Market Value (US$ Mn) Forecast by Deployment Type, 2017-2032

Table 3: Global Network Optimization Market Value (US$ Mn) Forecast by Verticals, 2017-2032

Table 4: North America Network Optimization Market Value (US$ Mn) Forecast by Country, 2017-2032

Table 5: North America Network Optimization Market Value (US$ Mn) Forecast by Deployment Type, 2017-2032

Table 6: North America Network Optimization Market Value (US$ Mn) Forecast by Verticals, 2017-2032

Table 7: Latin America Network Optimization Market Value (US$ Mn) Forecast by Country, 2017-2032

Table 8: Latin America Network Optimization Market Value (US$ Mn) Forecast by Deployment Type, 2017-2032

Table 9: Latin America Network Optimization Market Value (US$ Mn) Forecast by Verticals, 2017-2032

Table 10: Europe Network Optimization Market Value (US$ Mn) Forecast by Country, 2017-2032

Table 11: Europe Network Optimization Market Value (US$ Mn) Forecast by Deployment Type, 2017-2032

Table 12: Europe Network Optimization Market Value (US$ Mn) Forecast by Verticals, 2017-2032

Table 13: Asia Pacific Network Optimization Market Value (US$ Mn) Forecast by Country, 2017-2032

Table 14: Asia Pacific Network Optimization Market Value (US$ Mn) Forecast by Deployment Type, 2017-2032

Table 15: Asia Pacific Network Optimization Market Value (US$ Mn) Forecast by Verticals, 2017-2032

Table 16: MEA Network Optimization Market Value (US$ Mn) Forecast by Country, 2017-2032

Table 17: MEA Network Optimization Market Value (US$ Mn) Forecast by Deployment Type, 2017-2032

Table 18: MEA Network Optimization Market Value (US$ Mn) Forecast by Verticals, 2017-2032
Sudip Saha
Sudip Saha

Principal Consultant

Talk to Analyst

Find your sweet spots for generating winning opportunities in this market.

List of Charts

Figure 1: Global Network Optimization Market Value (US$ Mn) by Deployment Type, 2022-2032

Figure 2: Global Network Optimization Market Value (US$ Mn) by Verticals, 2022-2032

Figure 3: Global Network Optimization Market Value (US$ Mn) by Region, 2022-2032

Figure 4: Global Network Optimization Market Value (US$ Mn) Analysis by Region, 2017-2032

Figure 5: Global Network Optimization Market Value Share (%) and BPS Analysis by Region, 2022-2032

Figure 6: Global Network Optimization Market Y-o-Y Growth (%) Projections by Region, 2022-2032

Figure 7: Global Network Optimization Market Value (US$ Mn) Analysis by Deployment Type, 2017-2032

Figure 8: Global Network Optimization Market Value Share (%) and BPS Analysis by Deployment Type, 2022-2032

Figure 9: Global Network Optimization Market Y-o-Y Growth (%) Projections by Deployment Type, 2022-2032

Figure 10: Global Network Optimization Market Value (US$ Mn) Analysis by Verticals, 2017-2032

Figure 11: Global Network Optimization Market Value Share (%) and BPS Analysis by Verticals, 2022-2032

Figure 12: Global Network Optimization Market Y-o-Y Growth (%) Projections by Verticals, 2022-2032

Figure 13: Global Network Optimization Market Attractiveness by Deployment Type, 2022-2032

Figure 14: Global Network Optimization Market Attractiveness by Verticals, 2022-2032

Figure 15: Global Network Optimization Market Attractiveness by Region, 2022-2032

Figure 16: North America Network Optimization Market Value (US$ Mn) by Deployment Type, 2022-2032

Figure 17: North America Network Optimization Market Value (US$ Mn) by Verticals, 2022-2032

Figure 18: North America Network Optimization Market Value (US$ Mn) by Country, 2022-2032

Figure 19: North America Network Optimization Market Value (US$ Mn) Analysis by Country, 2017-2032

Figure 20: North America Network Optimization Market Value Share (%) and BPS Analysis by Country, 2022-2032

Figure 21: North America Network Optimization Market Y-o-Y Growth (%) Projections by Country, 2022-2032

Figure 22: North America Network Optimization Market Value (US$ Mn) Analysis by Deployment Type, 2017-2032

Figure 23: North America Network Optimization Market Value Share (%) and BPS Analysis by Deployment Type, 2022-2032

Figure 24: North America Network Optimization Market Y-o-Y Growth (%) Projections by Deployment Type, 2022-2032

Figure 25: North America Network Optimization Market Value (US$ Mn) Analysis by Verticals, 2017-2032

Figure 26: North America Network Optimization Market Value Share (%) and BPS Analysis by Verticals, 2022-2032

Figure 27: North America Network Optimization Market Y-o-Y Growth (%) Projections by Verticals, 2022-2032

Figure 28: North America Network Optimization Market Attractiveness by Deployment Type, 2022-2032

Figure 29: North America Network Optimization Market Attractiveness by Verticals, 2022-2032

Figure 30: North America Network Optimization Market Attractiveness by Country, 2022-2032

Figure 31: Latin America Network Optimization Market Value (US$ Mn) by Deployment Type, 2022-2032

Figure 32: Latin America Network Optimization Market Value (US$ Mn) by Verticals, 2022-2032

Figure 33: Latin America Network Optimization Market Value (US$ Mn) by Country, 2022-2032

Figure 34: Latin America Network Optimization Market Value (US$ Mn) Analysis by Country, 2017-2032

Figure 35: Latin America Network Optimization Market Value Share (%) and BPS Analysis by Country, 2022-2032

Figure 36: Latin America Network Optimization Market Y-o-Y Growth (%) Projections by Country, 2022-2032

Figure 37: Latin America Network Optimization Market Value (US$ Mn) Analysis by Deployment Type, 2017-2032

Figure 38: Latin America Network Optimization Market Value Share (%) and BPS Analysis by Deployment Type, 2022-2032

Figure 39: Latin America Network Optimization Market Y-o-Y Growth (%) Projections by Deployment Type, 2022-2032

Figure 40: Latin America Network Optimization Market Value (US$ Mn) Analysis by Verticals, 2017-2032

Figure 41: Latin America Network Optimization Market Value Share (%) and BPS Analysis by Verticals, 2022-2032

Figure 42: Latin America Network Optimization Market Y-o-Y Growth (%) Projections by Verticals, 2022-2032

Figure 43: Latin America Network Optimization Market Attractiveness by Deployment Type, 2022-2032

Figure 44: Latin America Network Optimization Market Attractiveness by Verticals, 2022-2032

Figure 45: Latin America Network Optimization Market Attractiveness by Country, 2022-2032

Figure 46: Europe Network Optimization Market Value (US$ Mn) by Deployment Type, 2022-2032

Figure 47: Europe Network Optimization Market Value (US$ Mn) by Verticals, 2022-2032

Figure 48: Europe Network Optimization Market Value (US$ Mn) by Country, 2022-2032

Figure 49: Europe Network Optimization Market Value (US$ Mn) Analysis by Country, 2017-2032

Figure 50: Europe Network Optimization Market Value Share (%) and BPS Analysis by Country, 2022-2032

Figure 51: Europe Network Optimization Market Y-o-Y Growth (%) Projections by Country, 2022-2032

Figure 52: Europe Network Optimization Market Value (US$ Mn) Analysis by Deployment Type, 2017-2032

Figure 53: Europe Network Optimization Market Value Share (%) and BPS Analysis by Deployment Type, 2022-2032

Figure 54: Europe Network Optimization Market Y-o-Y Growth (%) Projections by Deployment Type, 2022-2032

Figure 55: Europe Network Optimization Market Value (US$ Mn) Analysis by Verticals, 2017-2032

Figure 56: Europe Network Optimization Market Value Share (%) and BPS Analysis by Verticals, 2022-2032

Figure 57: Europe Network Optimization Market Y-o-Y Growth (%) Projections by Verticals, 2022-2032

Figure 58: Europe Network Optimization Market Attractiveness by Deployment Type, 2022-2032

Figure 59: Europe Network Optimization Market Attractiveness by Verticals, 2022-2032

Figure 60: Europe Network Optimization Market Attractiveness by Country, 2022-2032

Figure 61: Asia Pacific Network Optimization Market Value (US$ Mn) by Deployment Type, 2022-2032

Figure 62: Asia Pacific Network Optimization Market Value (US$ Mn) by Verticals, 2022-2032

Figure 63: Asia Pacific Network Optimization Market Value (US$ Mn) by Country, 2022-2032

Figure 64: Asia Pacific Network Optimization Market Value (US$ Mn) Analysis by Country, 2017-2032

Figure 65: Asia Pacific Network Optimization Market Value Share (%) and BPS Analysis by Country, 2022-2032

Figure 66: Asia Pacific Network Optimization Market Y-o-Y Growth (%) Projections by Country, 2022-2032

Figure 67: Asia Pacific Network Optimization Market Value (US$ Mn) Analysis by Deployment Type, 2017-2032

Figure 68: Asia Pacific Network Optimization Market Value Share (%) and BPS Analysis by Deployment Type, 2022-2032

Figure 69: Asia Pacific Network Optimization Market Y-o-Y Growth (%) Projections by Deployment Type, 2022-2032

Figure 70: Asia Pacific Network Optimization Market Value (US$ Mn) Analysis by Verticals, 2017-2032

Figure 71: Asia Pacific Network Optimization Market Value Share (%) and BPS Analysis by Verticals, 2022-2032

Figure 72: Asia Pacific Network Optimization Market Y-o-Y Growth (%) Projections by Verticals, 2022-2032

Figure 73: Asia Pacific Network Optimization Market Attractiveness by Deployment Type, 2022-2032

Figure 74: Asia Pacific Network Optimization Market Attractiveness by Verticals, 2022-2032

Figure 75: Asia Pacific Network Optimization Market Attractiveness by Country, 2022-2032

Figure 76: MEA Network Optimization Market Value (US$ Mn) by Deployment Type, 2022-2032

Figure 77: MEA Network Optimization Market Value (US$ Mn) by Verticals, 2022-2032

Figure 78: MEA Network Optimization Market Value (US$ Mn) by Country, 2022-2032

Figure 79: MEA Network Optimization Market Value (US$ Mn) Analysis by Country, 2017-2032

Figure 80: MEA Network Optimization Market Value Share (%) and BPS Analysis by Country, 2022-2032

Figure 81: MEA Network Optimization Market Y-o-Y Growth (%) Projections by Country, 2022-2032

Figure 82: MEA Network Optimization Market Value (US$ Mn) Analysis by Deployment Type, 2017-2032

Figure 83: MEA Network Optimization Market Value Share (%) and BPS Analysis by Deployment Type, 2022-2032

Figure 84: MEA Network Optimization Market Y-o-Y Growth (%) Projections by Deployment Type, 2022-2032

Figure 85: MEA Network Optimization Market Value (US$ Mn) Analysis by Verticals, 2017-2032

Figure 86: MEA Network Optimization Market Value Share (%) and BPS Analysis by Verticals, 2022-2032

Figure 87: MEA Network Optimization Market Y-o-Y Growth (%) Projections by Verticals, 2022-2032

Figure 88: MEA Network Optimization Market Attractiveness by Deployment Type, 2022-2032

Figure 89: MEA Network Optimization Market Attractiveness by Verticals, 2022-2032

Figure 90: MEA Network Optimization Market Attractiveness by Country, 2022-2032

Recommendations

Technology

WAN Optimization Market

Published : July 2023

Technology

Experience Optimization Platforms Market

Published : March 2023

Technology

WAN Optimization Controllers Market

Published : February 2023

Technology

Web Performance Optimization (WPO) Solution Market

Published : October 2021

Explore Technology Insights

View Reports

Network Optimization Market