Reports

- Global Locations -

Headquarters

Future Market Insights, Inc.

Christiana Corporate, 200
Continental Drive, Suite 401,
Newark, Delaware - 19713,
United States

T: +1-845-579-5705

Americas

Future Market Insights, Inc.

616 Corporate Way, Suite 2-9018,
Valley Cottage, NY 10989, United States

T: +1-347-918-3531

MEA

Future Market Insights

1602-6 Jumeirah Bay X2 Tower, Plot No: JLT-PH2-X2A,
Jumeirah Lakes Towers, Dubai,
United Arab Emirates

Europe

Future Market Insights

3rd Floor, 207 Regent Street,
W1B 3HH London
United Kingdom

T: + 44 (0) 20 8123 9659
D: +44 (0) 20 3287 4268

Asia Pacific

Future Market Insights

IndiaLand Global Tech Park, Unit UG-1, Behind Grand HighStreet, Phase 1, Hinjawadi, MH, Pune – 411057, India

Network Cable Tester Market Snapshot (2022 to 2032)

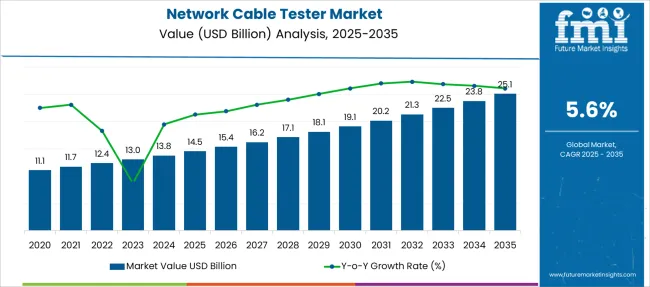
The market for network cable testers is anticipated to be worth US$ 21.6 Billion by the end of the 2022 to 2032 forecast period, expected to flourish at a value CAGR of 5.6%. From 2021 to 2022, the market is expected to surge at a Y-o-Y growth rate of 6.8%, reaching US$ 12.5 Billion in 2022, up from US$ 11.7 Billion in 2021.

Report Attribute Details
Estimated Base Year Value (2021) US$ 11.7 Billion
Expected Market Value (2022) US$ 12.5 Billion
Anticipated Forecast Value (2032) US$ 21.6 Billion
Projected Growth Rate (2022 to 2032) 5.6% CAGR

Technical advancements in communication, electronics, and other industries have resulted in the development of effective network cable testers in the current scenario. Network cable testers are essential when installing new cables and troubleshooting existing ones. Attenuation, wire map, length, DC loop resistance, and return loss are all common cable tests.

Organizations such as IEE, ISO, and TIA are constantly researching to provide guidelines for cabling professionals to follow when installing, troubleshooting, and certifying cable networks. These network transmission technologies have specific requirements and potential difficulties.

With higher-speed Ethernet standards, keeping up with the latest proliferation in cabling communications and network cable testing is becoming increasingly important. The growing networking industry is expected to boost the network cable tester market significantly.

Don't pay for what you don't need

Customize your report by selecting specific countries or regions and save 30%!

Which are Some Prominent Drivers Spearheading Network cable tester Market Growth?

As networks evolve, so does the need for cabling infrastructure to support them. Network cable testers are designed with a variety of features tailored to specific field tasks. They provide a level of assurance that the installed cable links provide the desired network transmission capabilities to assist users with data communication.

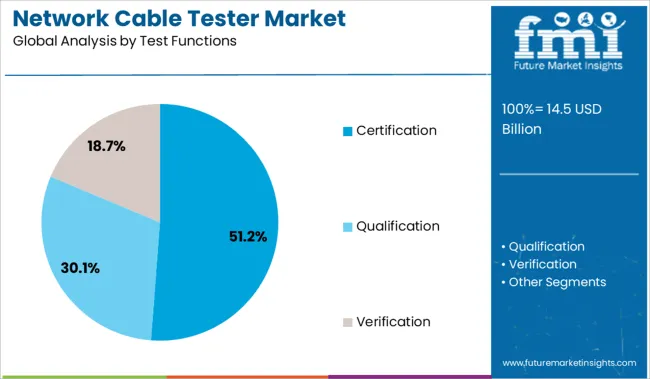
Network cable testers are commercially classified into one of three hierarchical sets: qualification, verification, and certification. Certification A network cable tester is a tool that provides pass or fails results based on industry standards.

Furthermore, the rapid development of gaming devices and equipment in LAN (Local Area Network) is increasing cable sales, which has resulted in an increase in demand for network cable testers to provide quality and safe connectivity.

What are the Challenges Faced by the Network cable tester Industry?

The cable testers market is also growing due to its applications in other fields such as the army, railways, and others. On the other hand, the high cost of cable testers and a lack of awareness about tester applications are two significant challenges confronting the cable tester market.

Nikhil Kaitwade
Nikhil Kaitwade

Principal Consultant

Talk to Analyst

Find your sweet spots for generating winning opportunities in this market.

Why is Asia-Pacific Emerging as an Opportunistic Network cable tester Market?

Asia Pacific is the world's largest Network cable tester market. The increased demand for cables is associated with increased electricity generation and distribution as a result of rapid industrialization and urbanization. The Asia Pacific region's demand for cables from industries such as energy and electronics, transportation, and power services is expected to support the region's Network cable tester business. The Asia-Pacific region is expected to be the world's fastest-growing market for Network cable testers.

Because of its distinct culture and market size, Japan has a thriving network and cabling industry. Many of the world's most significant and innovative industrial firms are Japanese. These factors are propelling the Asia Pacific Network Cable Tester market forward.
How is Europe Contributing to Growth of the Network cable tester Market?

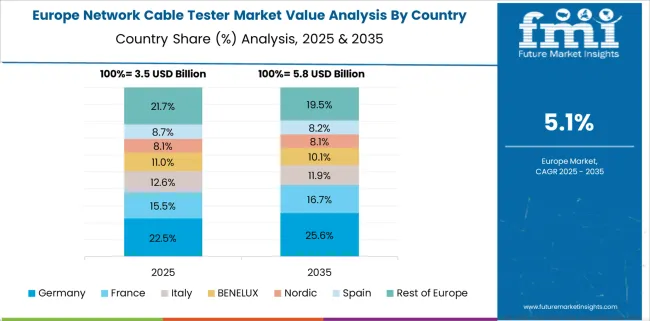
Europe is the second-largest market for cable testers, owing to the high demand for efficient network connections in industries such as aviation, defense, manufacturing, and others. Furthermore, industries in this region are more focused on providing excellent data transmission over networks; thus, the use of cable testers is increasing in this region.

The network cable tester market in Europe is expected to grow slowly. Technological advancements in the cabling industry have seen significant growth in Germany, resulting in increased demand for Network Cable Tester equipment.
Get the data you need at a Fraction of the cost

Personalize your report by choosing insights you need
and save 40%!

Market Competition

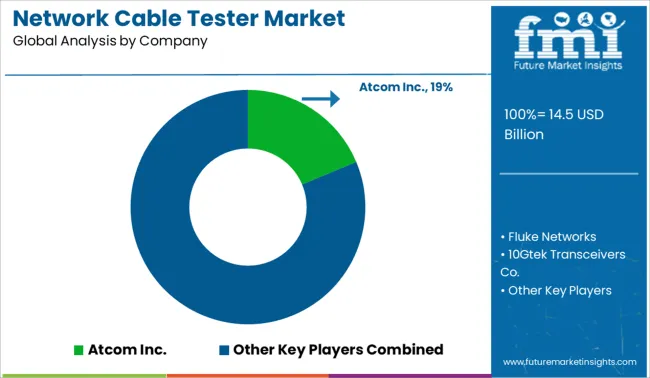
The number of competitors in the Network Cable Tester market is insignificant. Atcom Inc., Fluke Networks, 10Gtek Transceivers Co., LTD., GENERIC, NetScout Systems, Inc., Ologymart, Transway's Marketplace, TeKit, axGear, Advanced Fiber Solutions, AEMC Instruments, L-com, Platinum Tools, Klein Tools, and others are among the key players operating in the global Network Cable Tester market.

Report Scope

Report Attribute Details
Growth Rate CAGR of 5.6% from 2022 to 2032
Market Value in 2022 US$ 12.5 Billion
Market Value in 2032 US$ 21.6 Billion
Base Year for Estimation 2021
Historical Data 2015 to 2021
Forecast Period 2022 to 2032
Quantitative Units Revenue in USD Billion, Volume in Kilotons, and CAGR from 2022 to 2032
Report Coverage Revenue Forecast, Volume Forecast, Company Ranking, Competitive Landscape, Growth Factors, Trends, and Pricing Analysis
Segments Covered
  • Product Type
  • Test Function
  • Region
Regions Covered
  • North America
  • Latin America
  • Europe
  • Asia Pacific
  • Middle East and Africa
Key Countries Profiled
  • USA
  • Canada
  • Brazil
  • Mexico
  • Argentina
  • Chile
  • Peru
  • Germany
  • United Kingdom
  • France
  • Spain
  • Italy
  • Russia
  • BENELUX
  • China
  • Japan
  • South Korea
  • GCC Countries
  • South Africa
  • Turkey
Key Companies Profiled
  • Atcom Inc.
  • Fluke Networks
  • 10Gtek Transceivers Co.
  • GENERIC
  • NetScout Systems
  • Ologymart
  • Transway’s
  • Telit
  • axGear
  • Advanced Fiber Solutions
  • AEMC Instruments
  • L-com
  • Platinum Tools
  • Klein Tools
Customization Available Upon Request

Key Segments Profiled in the Network Cable Tester Industry Survey

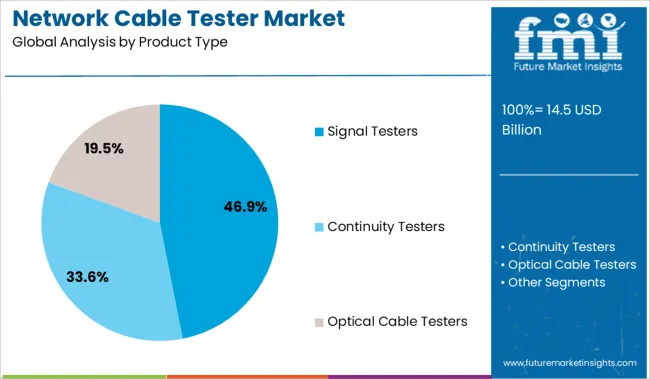
Network Cable Tester market by Product Type:

  • Network Cable Signal Testers
  • Network Cable Continuity Testers
  • Optical Network Cable Testers

Network Cable Tester Market by Test Functions:

  • Network Cable Certification Tests
  • Network Cable Qualification Tests
  • Network Cable Verification Tests

Network Cable Tester Market by Region:

  • North America Network Cable Tester Market
  • Latin America Network Cable Tester Market
  • Europe Network Cable Tester Market
  • Asia Pacific Network Cable Tester Market
  • Middle East & Africa Network Cable Tester Market

Frequently Asked Questions

What is the anticipated growth of the Network cable tester market until 2032?

FMI projects the global Network cable tester market to expand at a 5.6% value CAGR by 2032

Which region is forecast to be the most lucrative for Network cable tester market growth?

Asia Pacific is expected to be the most opportunistic Network cable tester market, expanding at a 5% CAGR

Which are some prominent Network cable tester manufacturers?

Atcom Inc., Fluke Networks, 10Gtek Transceivers Co., LTD., and GENERIC, NetScout Systems Inc. are some prominent Network cable tester manufacturers.

Table of Content

1. Executive Summary | Network Cable Tester Market

    1.1. Global Market Outlook

    1.2. Demand-side Trends

    1.3. Supply-side Trends

    1.4. Technology Roadmap Analysis

    1.5. Analysis and Recommendations

2. Market Overview

    2.1. Market Coverage / Taxonomy

    2.2. Market Definition / Scope / Limitations

3. Market Background

    3.1. Market Dynamics

        3.1.1. Drivers

        3.1.2. Restraints

        3.1.3. Opportunity 

        3.1.4. Trends

    3.2. Scenario Forecast

        3.2.1. Demand in Optimistic Scenario

        3.2.2. Demand in Likely Scenario

        3.2.3. Demand in Conservative Scenario

    3.3. Opportunity Map Analysis

    3.4. Product Life Cycle Analysis

    3.5. Supply Chain Analysis

        3.5.1. Supply Side Participants and their Roles

            3.5.1.1. Producers

            3.5.1.2. Mid-Level Participants (Traders/ Agents/ Brokers)

            3.5.1.3. Wholesalers and Distributors

        3.5.2. Value Added and Value Created at Node in the Supply Chain

        3.5.3. List of Raw Material Suppliers

        3.5.4. List of Existing and Potential Buyers

    3.6. Investment Feasibility Matrix

    3.7. Value Chain Analysis

        3.7.1. Profit Margin Analysis

        3.7.2. Wholesalers and Distributors

        3.7.3. Retailers

    3.8. PESTLE and Porter’s Analysis

    3.9. Regulatory Landscape

        3.9.1. By Key Regions

        3.9.2. By Key Countries

    3.10. Regional Parent Market Outlook

    3.11. Production and Consumption Statistics

    3.12. Import and Export Statistics

4. Global Market Analysis 2017 to 2021 and Forecast, 2022 to 2032

    4.1. Historical Market Size Value (US$ Million) & Volume (Units) Analysis, 2017 to 2021

    4.2. Current and Future Market Size Value (US$ Million) & Volume (Units) Projections, 2022 to 2032

        4.2.1. Y-o-Y Growth Trend Analysis

        4.2.2. Absolute $ Opportunity Analysis

5. Global Market Analysis 2017 to 2021 and Forecast 2022 to 2032, By Product Type

    5.1. Introduction / Key Findings

    5.2. Historical Market Size Value (US$ Million) & Volume (Units) Analysis By Product Type, 2017 to 2021

    5.3. Current and Future Market Size Value (US$ Million) & Volume (Units) Analysis and Forecast By Product Type, 2022 to 2032

        5.3.1. Signal Testers

        5.3.2. Continuity Testers

        5.3.3. Optical Cable Testers

    5.4. Y-o-Y Growth Trend Analysis By Product Type, 2017 to 2021

    5.5. Absolute $ Opportunity Analysis By Product Type, 2022 to 2032

6. Global Market Analysis 2017 to 2021 and Forecast 2022 to 2032, By Test Functions

    6.1. Introduction / Key Findings

    6.2. Historical Market Size Value (US$ Million) & Volume (Units) Analysis By Test Functions, 2017 to 2021

    6.3. Current and Future Market Size Value (US$ Million) & Volume (Units) Analysis and Forecast By Test Functions, 2022 to 2032

        6.3.1. Certification

        6.3.2. Qualification

        6.3.3. Verification 

    6.4. Y-o-Y Growth Trend Analysis By Test Functions, 2017 to 2021

    6.5. Absolute $ Opportunity Analysis By Test Functions, 2022 to 2032

7. Global Market Analysis 2017 to 2021 and Forecast 2022 to 2032, By Region

    7.1. Introduction

    7.2. Historical Market Size Value (US$ Million) & Volume (Units) Analysis By Region, 2017 to 2021

    7.3. Current Market Size Value (US$ Million) & Volume (Units) Analysis and Forecast By Region, 2022 to 2032

        7.3.1. North America

        7.3.2. Latin America

        7.3.3. Europe

        7.3.4. Asia Pacific

        7.3.5. Middle East and Africa

    7.4. Market Attractiveness Analysis By Region

8. North America Market Analysis 2017 to 2021 and Forecast 2022 to 2032, By Country

    8.1. Historical Market Size Value (US$ Million) & Volume (Units) Trend Analysis By Market Taxonomy, 2017 to 2021

    8.2. Market Size Value (US$ Million) & Volume (Units) Forecast By Market Taxonomy, 2022 to 2032

        8.2.1. By Country

            8.2.1.1. USA

            8.2.1.2. Canada

        8.2.2. By Product Type

        8.2.3. By Test Functions

    8.3. Market Attractiveness Analysis

        8.3.1. By Country

        8.3.2. By Product Type

        8.3.3. By Test Functions

    8.4. Key Takeaways

9. Latin America Market Analysis 2017 to 2021 and Forecast 2022 to 2032, By Country

    9.1. Historical Market Size Value (US$ Million) & Volume (Units) Trend Analysis By Market Taxonomy, 2017 to 2021

    9.2. Market Size Value (US$ Million) & Volume (Units) Forecast By Market Taxonomy, 2022 to 2032

        9.2.1. By Country

            9.2.1.1. Brazil

            9.2.1.2. Mexico

            9.2.1.3. Argentina

            9.2.1.4. Chile

            9.2.1.5. Peru

            9.2.1.6. Rest of Latin America

        9.2.2. By Product Type

        9.2.3. By Test Functions

    9.3. Market Attractiveness Analysis

        9.3.1. By Country

        9.3.2. By Product Type

        9.3.3. By Test Functions

    9.4. Key Takeaways

10. Europe Market Analysis 2017 to 2021 and Forecast 2022 to 2032, By Country

    10.1. Historical Market Size Value (US$ Million) & Volume (Units) Trend Analysis By Market Taxonomy, 2017 to 2021

    10.2. Market Size Value (US$ Million) & Volume (Units) Forecast By Market Taxonomy, 2022 to 2032

        10.2.1. By Country

            10.2.1.1. Germany

            10.2.1.2. Italy

            10.2.1.3. France

            10.2.1.4. United Kingdom

            10.2.1.5. Spain

            10.2.1.6. Russia

            10.2.1.7. BENELUX

            10.2.1.8. Rest of Europe

        10.2.2. By Product Type

        10.2.3. By Test Functions

    10.3. Market Attractiveness Analysis

        10.3.1. By Country

        10.3.2. By Product Type

        10.3.3. By Test Functions

    10.4. Key Takeaways

11. Asia Pacific Market Analysis 2017 to 2021 and Forecast 2022 to 2032, By Country

    11.1. Historical Market Size Value (US$ Million) & Volume (Units) Trend Analysis By Market Taxonomy, 2017 to 2021

    11.2. Market Size Value (US$ Million) & Volume (Units) Forecast By Market Taxonomy, 2022 to 2032

        11.2.1. By Country

            11.2.1.1. China

            11.2.1.2. Japan

            11.2.1.3. South Korea

            11.2.1.4. Rest of Asia Pacific

        11.2.2. By Product Type

        11.2.3. By Test Functions

    11.3. Market Attractiveness Analysis

        11.3.1. By Country

        11.3.2. By Product Type

        11.3.3. By Test Functions

    11.4. Key Takeaways

12. Middle East and Africa Market Analysis 2017 to 2021 and Forecast 2022 to 2032, By Country

    12.1. Historical Market Size Value (US$ Million) & Volume (Units) Trend Analysis By Market Taxonomy, 2017 to 2021

    12.2. Market Size Value (US$ Million) & Volume (Units) Forecast By Market Taxonomy, 2022 to 2032

        12.2.1. By Country

            12.2.1.1. GCC Countries

            12.2.1.2. South Africa

            12.2.1.3. Turkey

            12.2.1.4. Rest of Middle East and Africa

        12.2.2. By Product Type

        12.2.3. By Test Functions

    12.3. Market Attractiveness Analysis

        12.3.1. By Country

        12.3.2. By Product Type

        12.3.3. By Test Functions

    12.4. Key Takeaways

13. Key Countries Market Analysis

    13.1. USA

        13.1.1. Pricing Analysis

        13.1.2. Market Share Analysis, 2021

            13.1.2.1. By Product Type

            13.1.2.2. By Test Functions

    13.2. Canada

        13.2.1. Pricing Analysis

        13.2.2. Market Share Analysis, 2021

            13.2.2.1. By Product Type

            13.2.2.2. By Test Functions

    13.3. Brazil

        13.3.1. Pricing Analysis

        13.3.2. Market Share Analysis, 2021

            13.3.2.1. By Product Type

            13.3.2.2. By Test Functions

    13.4. Mexico

        13.4.1. Pricing Analysis

        13.4.2. Market Share Analysis, 2021

            13.4.2.1. By Product Type

            13.4.2.2. By Test Functions

    13.5. Argentina

        13.5.1. Pricing Analysis

        13.5.2. Market Share Analysis, 2021

            13.5.2.1. By Product Type

            13.5.2.2. By Test Functions

    13.6. Chile

        13.6.1. Pricing Analysis

        13.6.2. Market Share Analysis, 2021

            13.6.2.1. By Product Type

            13.6.2.2. By Test Functions

    13.7. Peru

        13.7.1. Pricing Analysis

        13.7.2. Market Share Analysis, 2021

            13.7.2.1. By Product Type

            13.7.2.2. By Test Functions

    13.8. Germany

        13.8.1. Pricing Analysis

        13.8.2. Market Share Analysis, 2021

            13.8.2.1. By Product Type

            13.8.2.2. By Test Functions

    13.9. Italy

        13.9.1. Pricing Analysis

        13.9.2. Market Share Analysis, 2021

            13.9.2.1. By Product Type

            13.9.2.2. By Test Functions

    13.10. France

        13.10.1. Pricing Analysis

        13.10.2. Market Share Analysis, 2021

            13.10.2.1. By Product Type

            13.10.2.2. By Test Functions

    13.11. United Kingdom

        13.11.1. Pricing Analysis

        13.11.2. Market Share Analysis, 2021

            13.11.2.1. By Product Type

            13.11.2.2. By Test Functions

    13.12. Spain

        13.12.1. Pricing Analysis

        13.12.2. Market Share Analysis, 2021

            13.12.2.1. By Product Type

            13.12.2.2. By Test Functions

    13.13. Russia

        13.13.1. Pricing Analysis

        13.13.2. Market Share Analysis, 2021

            13.13.2.1. By Product Type

            13.13.2.2. By Test Functions

    13.14. BENELUX

        13.14.1. Pricing Analysis

        13.14.2. Market Share Analysis, 2021

            13.14.2.1. By Product Type

            13.14.2.2. By Test Functions

    13.15. China

        13.15.1. Pricing Analysis

        13.15.2. Market Share Analysis, 2021

            13.15.2.1. By Product Type

            13.15.2.2. By Test Functions

    13.16. Japan

        13.16.1. Pricing Analysis

        13.16.2. Market Share Analysis, 2021

            13.16.2.1. By Product Type

            13.16.2.2. By Test Functions

    13.17. South Korea

        13.17.1. Pricing Analysis

        13.17.2. Market Share Analysis, 2021

            13.17.2.1. By Product Type

            13.17.2.2. By Test Functions

    13.18. GCC Countries

        13.18.1. Pricing Analysis

        13.18.2. Market Share Analysis, 2021

            13.18.2.1. By Product Type

            13.18.2.2. By Test Functions

    13.19. South Africa

        13.19.1. Pricing Analysis

        13.19.2. Market Share Analysis, 2021

            13.19.2.1. By Product Type

            13.19.2.2. By Test Functions

    13.20. Turkey

        13.20.1. Pricing Analysis

        13.20.2. Market Share Analysis, 2021

            13.20.2.1. By Product Type

            13.20.2.2. By Test Functions

14. Market Structure Analysis

    14.1. Competition Dashboard

    14.2. Competition Benchmarking

    14.3. Market Share Analysis of Top Players

        14.3.1. By Regional

        14.3.2. By Product Type

        14.3.3. By Test Functions

15. Competition Analysis

    15.1. Competition Deep Dive

        15.1.1. Atcom Inc.

            15.1.1.1. Overview

            15.1.1.2. Product Portfolio

            15.1.1.3. Profitability by Market Segments

            15.1.1.4. Sales Footprint

            15.1.1.5. Strategy Overview

                15.1.1.5.1. Marketing Strategy

                15.1.1.5.2. Product Strategy

                15.1.1.5.3. Channel Strategy

        15.1.2. Fluke Networks

            15.1.2.1. Overview

            15.1.2.2. Product Portfolio

            15.1.2.3. Profitability by Market Segments

            15.1.2.4. Sales Footprint

            15.1.2.5. Strategy Overview

                15.1.2.5.1. Marketing Strategy

                15.1.2.5.2. Product Strategy

                15.1.2.5.3. Channel Strategy

        15.1.3. 10Gtek Transceivers Co.

            15.1.3.1. Overview

            15.1.3.2. Product Portfolio

            15.1.3.3. Profitability by Market Segments

            15.1.3.4. Sales Footprint

            15.1.3.5. Strategy Overview

                15.1.3.5.1. Marketing Strategy

                15.1.3.5.2. Product Strategy

                15.1.3.5.3. Channel Strategy

        15.1.4. GENERIC

            15.1.4.1. Overview

            15.1.4.2. Product Portfolio

            15.1.4.3. Profitability by Market Segments

            15.1.4.4. Sales Footprint

            15.1.4.5. Strategy Overview

                15.1.4.5.1. Marketing Strategy

                15.1.4.5.2. Product Strategy

                15.1.4.5.3. Channel Strategy

        15.1.5. NetScout Systems

            15.1.5.1. Overview

            15.1.5.2. Product Portfolio

            15.1.5.3. Profitability by Market Segments

            15.1.5.4. Sales Footprint

            15.1.5.5. Strategy Overview

                15.1.5.5.1. Marketing Strategy

                15.1.5.5.2. Product Strategy

                15.1.5.5.3. Channel Strategy

        15.1.6. Ologymart

            15.1.6.1. Overview

            15.1.6.2. Product Portfolio

            15.1.6.3. Profitability by Market Segments

            15.1.6.4. Sales Footprint

            15.1.6.5. Strategy Overview

                15.1.6.5.1. Marketing Strategy

                15.1.6.5.2. Product Strategy

                15.1.6.5.3. Channel Strategy

        15.1.7. Trans way's 

            15.1.7.1. Overview

            15.1.7.2. Product Portfolio

            15.1.7.3. Profitability by Market Segments

            15.1.7.4. Sales Footprint

            15.1.7.5. Strategy Overview

                15.1.7.5.1. Marketing Strategy

                15.1.7.5.2. Product Strategy

                15.1.7.5.3. Channel Strategy

        15.1.8. TeKit

            15.1.8.1. Overview

            15.1.8.2. Product Portfolio

            15.1.8.3. Profitability by Market Segments

            15.1.8.4. Sales Footprint

            15.1.8.5. Strategy Overview

                15.1.8.5.1. Marketing Strategy

                15.1.8.5.2. Product Strategy

                15.1.8.5.3. Channel Strategy

        15.1.9. axGear

            15.1.9.1. Overview

            15.1.9.2. Product Portfolio

            15.1.9.3. Profitability by Market Segments

            15.1.9.4. Sales Footprint

            15.1.9.5. Strategy Overview

                15.1.9.5.1. Marketing Strategy

                15.1.9.5.2. Product Strategy

                15.1.9.5.3. Channel Strategy

        15.1.10. Advanced Fiber Solutions

            15.1.10.1. Overview

            15.1.10.2. Product Portfolio

            15.1.10.3. Profitability by Market Segments

            15.1.10.4. Sales Footprint

            15.1.10.5. Strategy Overview

                15.1.10.5.1. Marketing Strategy

                15.1.10.5.2. Product Strategy

                15.1.10.5.3. Channel Strategy

        15.1.11. AEMC Instruments

            15.1.11.1. Overview

            15.1.11.2. Product Portfolio

            15.1.11.3. Profitability by Market Segments

            15.1.11.4. Sales Footprint

            15.1.11.5. Strategy Overview

                15.1.11.5.1. Marketing Strategy

                15.1.11.5.2. Product Strategy

                15.1.11.5.3. Channel Strategy

        15.1.12. L-com

            15.1.12.1. Overview

            15.1.12.2. Product Portfolio

            15.1.12.3. Profitability by Market Segments

            15.1.12.4. Sales Footprint

            15.1.12.5. Strategy Overview

                15.1.12.5.1. Marketing Strategy

                15.1.12.5.2. Product Strategy

                15.1.12.5.3. Channel Strategy

        15.1.13. Platinum Tools

            15.1.13.1. Overview

            15.1.13.2. Product Portfolio

            15.1.13.3. Profitability by Market Segments

            15.1.13.4. Sales Footprint

            15.1.13.5. Strategy Overview

                15.1.13.5.1. Marketing Strategy

                15.1.13.5.2. Product Strategy

                15.1.13.5.3. Channel Strategy

        15.1.14. Klein Tools

            15.1.14.1. Overview

            15.1.14.2. Product Portfolio

            15.1.14.3. Profitability by Market Segments

            15.1.14.4. Sales Footprint

            15.1.14.5. Strategy Overview

                15.1.14.5.1. Marketing Strategy

                15.1.14.5.2. Product Strategy

                15.1.14.5.3. Channel Strategy

16. Assumptions & Acronyms Used

17. Research Methodology

Don't pay for what you don't need

Customize your report by selecting specific countries or regions and save 30%!

List of Tables

Table 1: Global Market Value (US$ Million) Forecast by Region, 2017 to 2032

Table 2: Global Market Volume (Units) Forecast by Region, 2017 to 2032

Table 3: Global Market Value (US$ Million) Forecast by Product Type, 2017 to 2032

Table 4: Global Market Volume (Units) Forecast by Product Type, 2017 to 2032

Table 5: Global Market Value (US$ Million) Forecast by Test Functions, 2017 to 2032

Table 6: Global Market Volume (Units) Forecast by Test Functions, 2017 to 2032

Table 7: North America Market Value (US$ Million) Forecast by Country, 2017 to 2032

Table 8: North America Market Volume (Units) Forecast by Country, 2017 to 2032

Table 9: North America Market Value (US$ Million) Forecast by Product Type, 2017 to 2032

Table 10: North America Market Volume (Units) Forecast by Product Type, 2017 to 2032

Table 11: North America Market Value (US$ Million) Forecast by Test Functions, 2017 to 2032

Table 12: North America Market Volume (Units) Forecast by Test Functions, 2017 to 2032

Table 13: Latin America Market Value (US$ Million) Forecast by Country, 2017 to 2032

Table 14: Latin America Market Volume (Units) Forecast by Country, 2017 to 2032

Table 15: Latin America Market Value (US$ Million) Forecast by Product Type, 2017 to 2032

Table 16: Latin America Market Volume (Units) Forecast by Product Type, 2017 to 2032

Table 17: Latin America Market Value (US$ Million) Forecast by Test Functions, 2017 to 2032

Table 18: Latin America Market Volume (Units) Forecast by Test Functions, 2017 to 2032

Table 19: Europe Market Value (US$ Million) Forecast by Country, 2017 to 2032

Table 20: Europe Market Volume (Units) Forecast by Country, 2017 to 2032

Table 21: Europe Market Value (US$ Million) Forecast by Product Type, 2017 to 2032

Table 22: Europe Market Volume (Units) Forecast by Product Type, 2017 to 2032

Table 23: Europe Market Value (US$ Million) Forecast by Test Functions, 2017 to 2032

Table 24: Europe Market Volume (Units) Forecast by Test Functions, 2017 to 2032

Table 25: Asia Pacific Market Value (US$ Million) Forecast by Country, 2017 to 2032

Table 26: Asia Pacific Market Volume (Units) Forecast by Country, 2017 to 2032

Table 27: Asia Pacific Market Value (US$ Million) Forecast by Product Type, 2017 to 2032

Table 28: Asia Pacific Market Volume (Units) Forecast by Product Type, 2017 to 2032

Table 29: Asia Pacific Market Value (US$ Million) Forecast by Test Functions, 2017 to 2032

Table 30: Asia Pacific Market Volume (Units) Forecast by Test Functions, 2017 to 2032

Table 31: Middle East and Africa Market Value (US$ Million) Forecast by Country, 2017 to 2032

Table 32: Middle East and Africa Market Volume (Units) Forecast by Country, 2017 to 2032

Table 33: Middle East and Africa Market Value (US$ Million) Forecast by Product Type, 2017 to 2032

Table 34: Middle East and Africa Market Volume (Units) Forecast by Product Type, 2017 to 2032

Table 35: Middle East and Africa Market Value (US$ Million) Forecast by Test Functions, 2017 to 2032

Table 36: Middle East and Africa Market Volume (Units) Forecast by Test Functions, 2017 to 2032
Nikhil Kaitwade
Nikhil Kaitwade

Principal Consultant

Talk to Analyst

Find your sweet spots for generating winning opportunities in this market.

List of Charts

Figure 1: Global Market Value (US$ Million) by Product Type, 2022 to 2032

Figure 2: Global Market Value (US$ Million) by Test Functions, 2022 to 2032

Figure 3: Global Market Value (US$ Million) by Region, 2022 to 2032

Figure 4: Global Market Value (US$ Million) Analysis by Region, 2017 to 2032

Figure 5: Global Market Volume (Units) Analysis by Region, 2017 to 2032

Figure 6: Global Market Value Share (%) and BPS Analysis by Region, 2022 to 2032

Figure 7: Global Market Y-o-Y Growth (%) Projections by Region, 2022 to 2032

Figure 8: Global Market Value (US$ Million) Analysis by Product Type, 2017 to 2032

Figure 9: Global Market Volume (Units) Analysis by Product Type, 2017 to 2032

Figure 10: Global Market Value Share (%) and BPS Analysis by Product Type, 2022 to 2032

Figure 11: Global Market Y-o-Y Growth (%) Projections by Product Type, 2022 to 2032

Figure 12: Global Market Value (US$ Million) Analysis by Test Functions, 2017 to 2032

Figure 13: Global Market Volume (Units) Analysis by Test Functions, 2017 to 2032

Figure 14: Global Market Value Share (%) and BPS Analysis by Test Functions, 2022 to 2032

Figure 15: Global Market Y-o-Y Growth (%) Projections by Test Functions, 2022 to 2032

Figure 16: Global Market Attractiveness by Product Type, 2022 to 2032

Figure 17: Global Market Attractiveness by Test Functions, 2022 to 2032

Figure 18: Global Market Attractiveness by Region, 2022 to 2032

Figure 19: North America Market Value (US$ Million) by Product Type, 2022 to 2032

Figure 20: North America Market Value (US$ Million) by Test Functions, 2022 to 2032

Figure 21: North America Market Value (US$ Million) by Country, 2022 to 2032

Figure 22: North America Market Value (US$ Million) Analysis by Country, 2017 to 2032

Figure 23: North America Market Volume (Units) Analysis by Country, 2017 to 2032

Figure 24: North America Market Value Share (%) and BPS Analysis by Country, 2022 to 2032

Figure 25: North America Market Y-o-Y Growth (%) Projections by Country, 2022 to 2032

Figure 26: North America Market Value (US$ Million) Analysis by Product Type, 2017 to 2032

Figure 27: North America Market Volume (Units) Analysis by Product Type, 2017 to 2032

Figure 28: North America Market Value Share (%) and BPS Analysis by Product Type, 2022 to 2032

Figure 29: North America Market Y-o-Y Growth (%) Projections by Product Type, 2022 to 2032

Figure 30: North America Market Value (US$ Million) Analysis by Test Functions, 2017 to 2032

Figure 31: North America Market Volume (Units) Analysis by Test Functions, 2017 to 2032

Figure 32: North America Market Value Share (%) and BPS Analysis by Test Functions, 2022 to 2032

Figure 33: North America Market Y-o-Y Growth (%) Projections by Test Functions, 2022 to 2032

Figure 34: North America Market Attractiveness by Product Type, 2022 to 2032

Figure 35: North America Market Attractiveness by Test Functions, 2022 to 2032

Figure 36: North America Market Attractiveness by Country, 2022 to 2032

Figure 37: Latin America Market Value (US$ Million) by Product Type, 2022 to 2032

Figure 38: Latin America Market Value (US$ Million) by Test Functions, 2022 to 2032

Figure 39: Latin America Market Value (US$ Million) by Country, 2022 to 2032

Figure 40: Latin America Market Value (US$ Million) Analysis by Country, 2017 to 2032

Figure 41: Latin America Market Volume (Units) Analysis by Country, 2017 to 2032

Figure 42: Latin America Market Value Share (%) and BPS Analysis by Country, 2022 to 2032

Figure 43: Latin America Market Y-o-Y Growth (%) Projections by Country, 2022 to 2032

Figure 44: Latin America Market Value (US$ Million) Analysis by Product Type, 2017 to 2032

Figure 45: Latin America Market Volume (Units) Analysis by Product Type, 2017 to 2032

Figure 46: Latin America Market Value Share (%) and BPS Analysis by Product Type, 2022 to 2032

Figure 47: Latin America Market Y-o-Y Growth (%) Projections by Product Type, 2022 to 2032

Figure 48: Latin America Market Value (US$ Million) Analysis by Test Functions, 2017 to 2032

Figure 49: Latin America Market Volume (Units) Analysis by Test Functions, 2017 to 2032

Figure 50: Latin America Market Value Share (%) and BPS Analysis by Test Functions, 2022 to 2032

Figure 51: Latin America Market Y-o-Y Growth (%) Projections by Test Functions, 2022 to 2032

Figure 52: Latin America Market Attractiveness by Product Type, 2022 to 2032

Figure 53: Latin America Market Attractiveness by Test Functions, 2022 to 2032

Figure 54: Latin America Market Attractiveness by Country, 2022 to 2032

Figure 55: Europe Market Value (US$ Million) by Product Type, 2022 to 2032

Figure 56: Europe Market Value (US$ Million) by Test Functions, 2022 to 2032

Figure 57: Europe Market Value (US$ Million) by Country, 2022 to 2032

Figure 58: Europe Market Value (US$ Million) Analysis by Country, 2017 to 2032

Figure 59: Europe Market Volume (Units) Analysis by Country, 2017 to 2032

Figure 60: Europe Market Value Share (%) and BPS Analysis by Country, 2022 to 2032

Figure 61: Europe Market Y-o-Y Growth (%) Projections by Country, 2022 to 2032

Figure 62: Europe Market Value (US$ Million) Analysis by Product Type, 2017 to 2032

Figure 63: Europe Market Volume (Units) Analysis by Product Type, 2017 to 2032

Figure 64: Europe Market Value Share (%) and BPS Analysis by Product Type, 2022 to 2032

Figure 65: Europe Market Y-o-Y Growth (%) Projections by Product Type, 2022 to 2032

Figure 66: Europe Market Value (US$ Million) Analysis by Test Functions, 2017 to 2032

Figure 67: Europe Market Volume (Units) Analysis by Test Functions, 2017 to 2032

Figure 68: Europe Market Value Share (%) and BPS Analysis by Test Functions, 2022 to 2032

Figure 69: Europe Market Y-o-Y Growth (%) Projections by Test Functions, 2022 to 2032

Figure 70: Europe Market Attractiveness by Product Type, 2022 to 2032

Figure 71: Europe Market Attractiveness by Test Functions, 2022 to 2032

Figure 72: Europe Market Attractiveness by Country, 2022 to 2032

Figure 73: Asia Pacific Market Value (US$ Million) by Product Type, 2022 to 2032

Figure 74: Asia Pacific Market Value (US$ Million) by Test Functions, 2022 to 2032

Figure 75: Asia Pacific Market Value (US$ Million) by Country, 2022 to 2032

Figure 76: Asia Pacific Market Value (US$ Million) Analysis by Country, 2017 to 2032

Figure 77: Asia Pacific Market Volume (Units) Analysis by Country, 2017 to 2032

Figure 78: Asia Pacific Market Value Share (%) and BPS Analysis by Country, 2022 to 2032

Figure 79: Asia Pacific Market Y-o-Y Growth (%) Projections by Country, 2022 to 2032

Figure 80: Asia Pacific Market Value (US$ Million) Analysis by Product Type, 2017 to 2032

Figure 81: Asia Pacific Market Volume (Units) Analysis by Product Type, 2017 to 2032

Figure 82: Asia Pacific Market Value Share (%) and BPS Analysis by Product Type, 2022 to 2032

Figure 83: Asia Pacific Market Y-o-Y Growth (%) Projections by Product Type, 2022 to 2032

Figure 84: Asia Pacific Market Value (US$ Million) Analysis by Test Functions, 2017 to 2032

Figure 85: Asia Pacific Market Volume (Units) Analysis by Test Functions, 2017 to 2032

Figure 86: Asia Pacific Market Value Share (%) and BPS Analysis by Test Functions, 2022 to 2032

Figure 87: Asia Pacific Market Y-o-Y Growth (%) Projections by Test Functions, 2022 to 2032

Figure 88: Asia Pacific Market Attractiveness by Product Type, 2022 to 2032

Figure 89: Asia Pacific Market Attractiveness by Test Functions, 2022 to 2032

Figure 90: Asia Pacific Market Attractiveness by Country, 2022 to 2032

Figure 91: Middle East and Africa Market Value (US$ Million) by Product Type, 2022 to 2032

Figure 92: Middle East and Africa Market Value (US$ Million) by Test Functions, 2022 to 2032

Figure 93: Middle East and Africa Market Value (US$ Million) by Country, 2022 to 2032

Figure 94: Middle East and Africa Market Value (US$ Million) Analysis by Country, 2017 to 2032

Figure 95: Middle East and Africa Market Volume (Units) Analysis by Country, 2017 to 2032

Figure 96: Middle East and Africa Market Value Share (%) and BPS Analysis by Country, 2022 to 2032

Figure 97: Middle East and Africa Market Y-o-Y Growth (%) Projections by Country, 2022 to 2032

Figure 98: Middle East and Africa Market Value (US$ Million) Analysis by Product Type, 2017 to 2032

Figure 99: Middle East and Africa Market Volume (Units) Analysis by Product Type, 2017 to 2032

Figure 100: Middle East and Africa Market Value Share (%) and BPS Analysis by Product Type, 2022 to 2032

Figure 101: Middle East and Africa Market Y-o-Y Growth (%) Projections by Product Type, 2022 to 2032

Figure 102: Middle East and Africa Market Value (US$ Million) Analysis by Test Functions, 2017 to 2032

Figure 103: Middle East and Africa Market Volume (Units) Analysis by Test Functions, 2017 to 2032

Figure 104: Middle East and Africa Market Value Share (%) and BPS Analysis by Test Functions, 2022 to 2032

Figure 105: Middle East and Africa Market Y-o-Y Growth (%) Projections by Test Functions, 2022 to 2032

Figure 106: Middle East and Africa Market Attractiveness by Product Type, 2022 to 2032

Figure 107: Middle East and Africa Market Attractiveness by Test Functions, 2022 to 2032

Figure 108: Middle East and Africa Market Attractiveness by Country, 2022 to 2032

Recommendations

Technology

Network Function Virtualization (NFV) Market

Published : October 2022

Testing Equipment

RF Tester Market

Published : February 2019

Explore Testing Equipment Insights

View Reports

Network Cable Tester Market