The Network Encryption Market is estimated to be valued at USD 4.8 billion in 2025 and is projected to reach USD 10.0 billion by 2035, registering a compound annual growth rate (CAGR) of 7.7% over the forecast period.
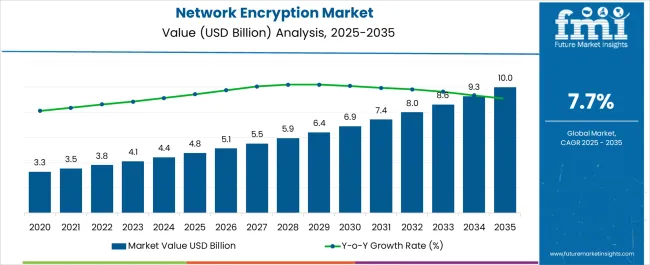
| Metric | Value |
|---|---|
| Network Encryption Market Estimated Value in (2025 E) | USD 4.8 billion |
| Network Encryption Market Forecast Value in (2035 F) | USD 10.0 billion |
| Forecast CAGR (2025 to 2035) | 7.7% |
The network encryption market is experiencing consistent growth fueled by rising cybersecurity threats, expanding digital infrastructure, and regulatory compliance requirements across critical sectors. Enterprises are increasingly prioritizing secure data transfer and protection against advanced cyberattacks, driving the deployment of encryption technologies.
Technological advancements in cloud-based security, 5G connectivity, and software-defined networking are further supporting market expansion. Additionally, governments and regulatory bodies are mandating stringent data privacy standards, compelling organizations across industries to adopt robust encryption practices.
Growing reliance on cloud services, remote working models, and the surge in data-intensive applications are strengthening the need for scalable and adaptive encryption solutions. The market outlook remains strong as enterprises and government entities continue to invest heavily in safeguarding sensitive information while ensuring operational continuity in an increasingly digitized ecosystem.
The market is segmented by Solution, Enterprise Size, and Industry and region. By Solution, the market is divided into Network Encryption Platforms, Network Encryption Devices, Services, Security Consulting, Training & Education, and Support & Maintenance. In terms of Enterprise Size, the market is classified into Small and Medium Enterprises (SMEs) and Large Enterprises. Based on Industry, the market is segmented into Government & Defense, BFSI, Telecom & IT, Media & Entertainment, Healthcare, Retail & E-Commerce, and Others. Regionally, the market is classified into North America, Latin America, Western Europe, Eastern Europe, Balkan & Baltic Countries, Russia & Belarus, Central Asia, East Asia, South Asia & Pacific, and the Middle East & Africa.
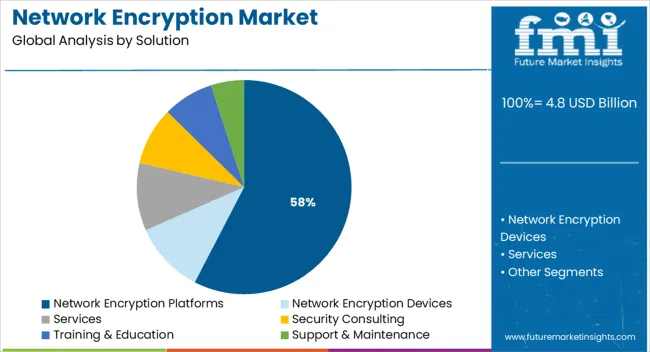
The network encryption platforms segment is expected to account for 57.60% of total market revenue by 2025, making it the leading solution type. This dominance is driven by the ability of platforms to provide centralized, scalable, and interoperable security solutions across complex enterprise networks.
They enable secure transmission of data across wide area networks, cloud environments, and critical communication infrastructures, reducing vulnerabilities. The demand has been further accelerated by increasing incidences of ransomware and targeted data breaches.
Additionally, platforms support compliance with international cybersecurity frameworks, offering organizations confidence in meeting regulatory mandates. Their ability to integrate with diverse IT architectures while maintaining performance efficiency has reinforced their adoption, solidifying their leadership within the solution segment.
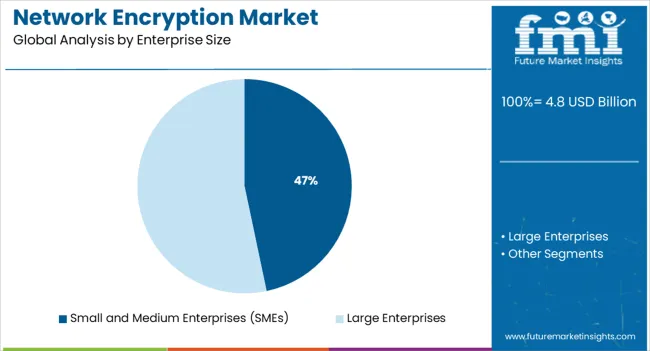
The small and medium enterprises segment is projected to represent 46.70% of market revenue by 2025, making it a significant contributor within enterprise size. Growth in this segment is attributed to the rising adoption of cost-effective and flexible encryption solutions tailored for SMEs.
As cyberattacks increasingly target smaller organizations due to perceived lower security maturity, SMEs are prioritizing network encryption to protect sensitive business and customer data. Cloud adoption, e-commerce expansion, and digitization of financial transactions within this segment have further increased vulnerability, necessitating encryption adoption.
Vendors are responding by offering subscription-based, easy-to-deploy, and managed service models, lowering the barrier to entry for SMEs. This has reinforced the prominence of this segment, reflecting its rising role in overall market expansion.
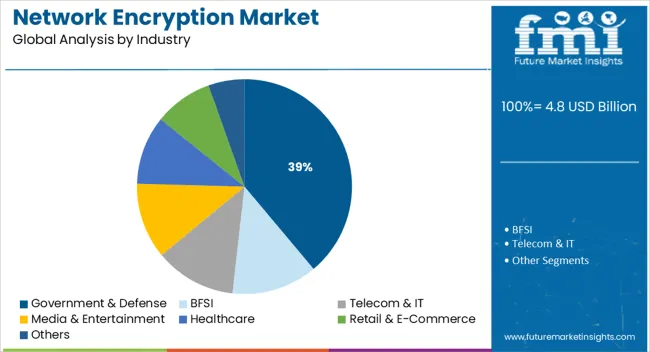
The government and defense segment is anticipated to hold 38.90% of the market revenue by 2025, establishing it as the leading industry vertical. This prominence is linked to the critical importance of securing national security data, defense communications, and confidential government records.
Rising incidents of state-sponsored cyber threats and espionage have necessitated the deployment of high-assurance encryption systems across government agencies and defense networks. Strict regulatory frameworks and defense modernization programs are also driving investments in advanced encryption solutions.
Furthermore, the growing use of cloud platforms, remote collaboration tools, and digital intelligence systems in the public sector has amplified the need for robust network protection. The reliance on encryption technologies to ensure confidentiality, integrity, and national security resilience has solidified government and defense as the leading industry segment in this market.
Several organizations are implementing network encryption solution to apply security to its network to control and protect data internally. The network layer of the open systems interface (OSI) concept is where network encryption takes place.
By applying one or more algorithms, the data packet is sent over the network layer from one node to destination node. The data packet is decrypted when it arrives at the destination node. Use of this software is extensive in sectors such as government & defense, BFSI and IT and others.
On the back of these factors, the network encryption demand is estimated to rise at 7.5% CAGR between 2025 and 2035, estimates Future Market Insights (FMI). The global network encryption market is anticipated to witness an increase in revenue from USD 4.8.0 Billion in 2025 to ~USD 10 Billion by 2035.
The adoption of next generation security solutions helps improve the company's product and operational efficiency. It also enables the network activity to detect anomalies. Next-gen security solutions incorporate real-time threat analysis to protect organization's network infrastructure from cyber threats.
Further, these network encryption solutions help to protect network data, network traffic, email and other data. With rapid growth of advanced IT networks, these next generation security solutions are expected to aid organizations to secure their entire network infrastructure.
BYOE, also known as BYOK (Bring Your Own Key), is an encryption system in which the data owner uses and produces its own cryptographic keys and has access to them. BYOE and BYOK as a solution help boost data security in the cloud without having to rely on a third-party key management vendor.
Customers can use the BYOE solution to run virtualized instances of their own encryption software alongside cloud-hosted business apps. BYOK, in many ways, mirrors the issues with more standard usernames and passwords, primarily adding another degree of operational complexity. Hence, adoption of bring your own encryption in SMEs and large enterprises is boosting the network encryption market.
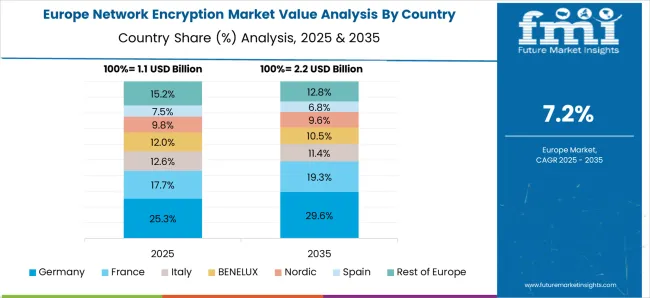
Several companies are focusing on deploying network encryption on their platforms, including telecom and IT, banking and financial services, media and entertainment, and government. As per FMI, Europe is expected to grow by 1.8X during the forecast period.
Furthermore, organizations in the region are growing rapidly and are in need of network encryption. Adoption of BYOE (Bring Your Own Encryption) concepts in several industries and organizations is expected to boost the Europe market.
However, with burgeoning adoption of BYOE, risk of cyber threats and corporate data breach has increased. Therefore, most organizations in Europe are adopting network encryption solutions to prevent information breaches.
| Countries | BPS Change (H2'22 (O) - H2'22 (P)) |
|---|---|
| USA | (+)44 |
| India | (+)45 |
| United kingdom | (+)43 |
| Japan | (+)39 |
| China | (+)42 |
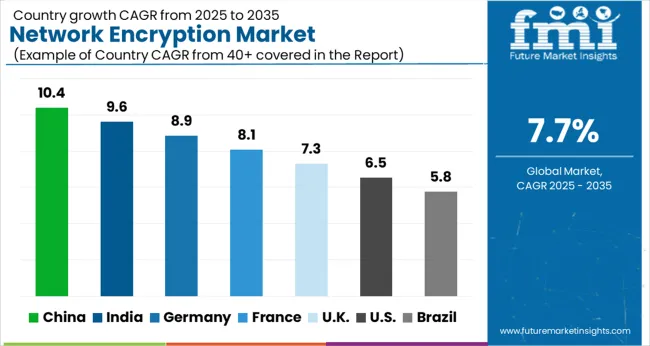
The H2’22(O) - H2’22(P) BPS change in India was of (+)45 units due to the growing number of cyber-attacks has led organizations to adopt network encryption technology to secure their data and protect sensitive information. Where as in USA rising privacy regulations such as GDPR, HIPAA, and PCI-DSS, organizations are required to implement encryption technology to secure customer data and meet compliance requirements leading to the deviation of (+)44 units.
The proliferation of Internet of Things (IoT) devices has increased the potential attack surface for botnets, thereby boosting the market growth of botnet detection technology resulting in USA a BPS change of (+)43 units for the network encryption market.
United kingdom encountered a BPS change of (+)39 units for the network encryption market due to the increasing use of IoT devices has led to the growth of network encryption technology to secure data transmitted between these devices.
China witnessed a BPS of (+)42 BPS units for the network encryption market attributed to the an increase in remote work, which has created a demand for secure virtual private networks (VPNs) and other network encryption solutions.
Presence of Prominent Network Encryption Solutions Vendors in Germany to Boost the Market
Europe is predicted to remain one of the most attractive markets during the forecast period. According to the study, Germany is expected to account for nearly 12.6% of the Europe market share through 2035.
Key vendors operating in network encryption market are focusing on collaborating and entering into partnership with other players to target new innovations within the market. The strategy helps the vendors in enhancing their product portfolio with the release of new products.
Companies in Germany are launching industry-specific solutions in order to render industry needs. For instance, in March 2025, a German company Rohde & Schwarz introduced an automated test solution.
The software will allow for time-saving and precise compliance tests of backplanes and cables for ethernet cable assemblies of high speed up to IEEE 802.3ck. Backed by these aforementioned factors, Germany network encryption market will witness an impressive growth rate over the forecast period.
Compliance of End-to-End Encryption will Improve Adoption of Network Encryption Solutions
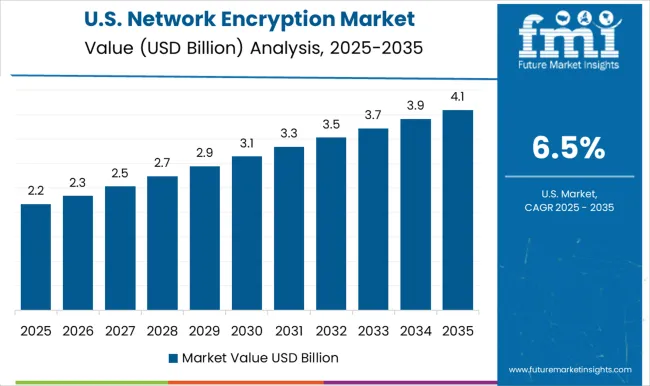
The network encryption demand in the USA is expected to account for nearly 86.0% of North America market share through 2035. End-to-end encryption has been a major contention between huge tech corporations and law enforcement in the USA
To combat this, three republican senators presented legislation in June 2024 requiring tech companies to provide a backdoor to end-to-end encrypted communication. In response to this, companies such as Apple have claimed that they are incapable of doing so as they do not have access to data that uses this type of encryption.
However, companies were targeted by the bill, who were refusing to cooperate with law enforcement. Further, there is a rise in number of network breaches in the country, driving the demand for network encryption in the country.
Stringent Regulations to Ensure the Privacy of Online Platforms will Fuel Network Encryption Solutions Demand in India
As per FMI, sales of network encryption solutions in India are estimated to increase at 12.5% CAGR between 2025 and 2035. Demand for network encryption solution is rapidly evolving with new law enforcements and policies in India.
Encryption is extensively used for protecting the confidentiality and security of online communication in India. Due to rapid digitalization, domestic and foreign online communication companies are emerging in the country.
For instance, in February 2024, the government of India came up with new regulations which included large social media platforms must allow traceability, or the capacity to disclose information about the originator of online interactions, under these requirements.
Traceability would entail breaching the end-to-end encryption used by many online communication platforms like WhatsApp, which would endanger the security of online communications on such platforms. Such factors are contributing to growth of network encryption solution in India.
Large Enterprises to Account for Nearly Half of Network Encryption Market Sales
In terms of enterprise size, the large enterprises segment is expected to showcase higher market share in 2025. This segment dominated the global market in past and is predicted to account for nearly 49.5% of market share by the end of 2025.
Large enterprises operate differently and have unique security concerns. These enterprises focus on technology like network encryption to protect their core digital assets. Further, large enterprises are adopting cloud services in search of greater efficiencies.
As cybercriminals are increasingly targeting large enterprises, the need for network encryption solution is increasing. The solution provides strong data protection, encode data and files for large enterprises in a way that unauthorized devices or users cannot access it.
Need for Data Security in Healthcare Sector to Propel the Demand for Network Encryption Solutions
The healthcare industry segment accounted for around 14.5% of the overall market share in 2025, and is expected to continue its dominance during the forecast period. The industry is implementing network encryption solution to solve their cyber-attacks and data breach problems.
Over the past few years, healthcare providers are facing data breaches resulting in increasing need for data security. Proliferation of work from home model among healthcare providers, is increasing the number of cyber-attacks for those using an unencrypted and unsecured network.
At the back of these factors, adoption of network encryption solution in healthcare will fuel the growth of global market.
Sales of Network Encryption Devices to Increase at Rapid Pace
The network encryption devices segment is expected to contribute a revenue share of close to 34.1% in 2025, and is expected to showcase a strong CAGR growth over the upcoming years.
File-level encryption, on the other hand, protects both data at rest and data in use. FLE allows to encrypt particular files and folders. IT administrators may secure vital files from prying eyes and corporate drives from being compromised by using both hard-drive encryption and file-level encryption for their workplace devices.
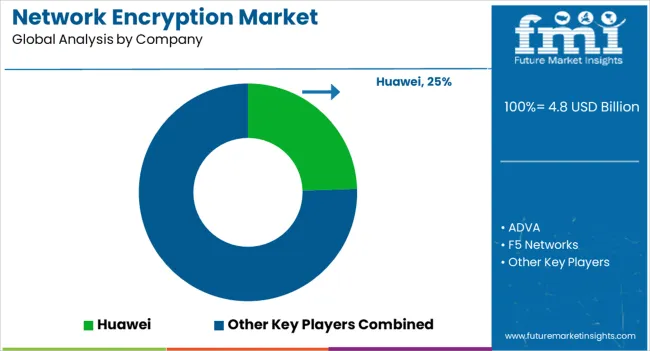
The network encryption market is characterized by the presence of both large-scale and medium-scale players. The network encryption market players are focusing on various strategies for increasing their investments in research and development to support future technologies.
| Attributes | Details |
|---|---|
| Forecast Period | 2025 to 2035 |
| Historical Data Available for | 2020 to 2025 |
| Market Analysis | USD Million for Value |
| Key Regions Covered | North America; Latin America; Europe; South Asia & Pacific; East Asia and the Middle East & Africa |
| Key Countries Covered | USA, Canada, Germany, United kingdom, France, Italy, Spain, Russia, China, Japan, South Korea, India, Australia & New Zealand, GCC Countries, Turkey and South Africa |
| Key Segments Covered | Solution, Enterprise Size, Industry, and Region |
| Key Companies Profiled | Ciena; Huawei; ADVA; F5 Networks; Viasat; TCC; Certes Networks; Atos; Securosys; Thales; Aruba; Juniper Networks; PacketLight Networks; Atmedia; Rhode & Schwarz Cybersecurity |
| Report Coverage | Market Forecast, Company Share Analysis, Competition Intelligence, DROT Analysis, Market Dynamics and Challenges, and Strategic Growth Initiatives |
| Customization & Pricing | Available upon Request |
The global network encryption market is estimated to be valued at USD 4.8 billion in 2025.
The market size for the network encryption market is projected to reach USD 10.0 billion by 2035.
The network encryption market is expected to grow at a 7.7% CAGR between 2025 and 2035.
The key product types in network encryption market are network encryption platforms, _on-premise, _cloud-based, network encryption devices, services, _professional services, security consulting, training & education, support & maintenance and _managed services.
In terms of enterprise size, small and medium enterprises (smes) segment to command 46.7% share in the network encryption market in 2025.


Our Research Products

The "Full Research Suite" delivers actionable market intel, deep dives on markets or technologies, so clients act faster, cut risk, and unlock growth.

The Leaderboard benchmarks and ranks top vendors, classifying them as Established Leaders, Leading Challengers, or Disruptors & Challengers.

Locates where complements amplify value and substitutes erode it, forecasting net impact by horizon

We deliver granular, decision-grade intel: market sizing, 5-year forecasts, pricing, adoption, usage, revenue, and operational KPIs—plus competitor tracking, regulation, and value chains—across 60 countries broadly.

Spot the shifts before they hit your P&L. We track inflection points, adoption curves, pricing moves, and ecosystem plays to show where demand is heading, why it is changing, and what to do next across high-growth markets and disruptive tech

Real-time reads of user behavior. We track shifting priorities, perceptions of today’s and next-gen services, and provider experience, then pace how fast tech moves from trial to adoption, blending buyer, consumer, and channel inputs with social signals (#WhySwitch, #UX).

Partner with our analyst team to build a custom report designed around your business priorities. From analysing market trends to assessing competitors or crafting bespoke datasets, we tailor insights to your needs.
Supplier Intelligence
Discovery & Profiling
Capacity & Footprint
Performance & Risk
Compliance & Governance
Commercial Readiness
Who Supplies Whom
Scorecards & Shortlists
Playbooks & Docs
Category Intelligence
Definition & Scope
Demand & Use Cases
Cost Drivers
Market Structure
Supply Chain Map
Trade & Policy
Operating Norms
Deliverables
Buyer Intelligence
Account Basics
Spend & Scope
Procurement Model
Vendor Requirements
Terms & Policies
Entry Strategy
Pain Points & Triggers
Outputs
Pricing Analysis
Benchmarks
Trends
Should-Cost
Indexation
Landed Cost
Commercial Terms
Deliverables
Brand Analysis
Positioning & Value Prop
Share & Presence
Customer Evidence
Go-to-Market
Digital & Reputation
Compliance & Trust
KPIs & Gaps
Outputs
Full Research Suite comprises of:
Market outlook & trends analysis
Interviews & case studies
Strategic recommendations
Vendor profiles & capabilities analysis
5-year forecasts
8 regions and 60+ country-level data splits
Market segment data splits
12 months of continuous data updates
DELIVERED AS:
PDF EXCEL ONLINE
Network Simulator Software Market Size and Share Forecast Outlook 2025 to 2035
Network Connectivity Tester Market Size and Share Forecast Outlook 2025 to 2035
Encryption Software Market Size and Share Forecast Outlook 2025 to 2035
Encryption as A Service Market Analysis - Size, Share, and Forecast Outlook 2025 to 2035
Network Analyzers Market Size and Share Forecast Outlook 2025 to 2035
Network as a Service (NaaS) Market Size and Share Forecast Outlook 2025 to 2035
Network Analytics Market Size and Share Forecast Outlook 2025 to 2035
Network Devices Market Size and Share Forecast Outlook 2025 to 2035
Network Sandboxing Market Size and Share Forecast Outlook 2025 to 2035
Network Access Control (NAC) Market Size and Share Forecast Outlook 2025 to 2035
Network Monitoring Market Size and Share Forecast Outlook 2025 to 2035
Network Packet Broker Market Size and Share Forecast Outlook 2025 to 2035
Network Traffic Analytics Market Size and Share Forecast Outlook 2025 to 2035
Network Function Virtualization (NFV) Market Size and Share Forecast Outlook 2025 to 2035
Network Cable Tester Market Size and Share Forecast Outlook 2025 to 2035
Network Point-of-Care Glucose Testing Market Size and Share Forecast Outlook 2025 to 2035
Network Forensics Market Size and Share Forecast Outlook 2025 to 2035
Network Telemetry Market Size and Share Forecast Outlook 2025 to 2035
Network Security Policy Management Market Size and Share Forecast Outlook 2025 to 2035
Network Probe Market Size and Share Forecast Outlook 2025 to 2035

Thank you!
You will receive an email from our Business Development Manager. Please be sure to check your SPAM/JUNK folder too.
Chat With
MaRIA