Network Probe Market
Market Insights on Network Probe covering sales outlook, demand forecast & up-to-date key trends
Network Probe Market by Component, Organization Size, Deployment Mode, End Users & Region - Forecast 2022 - 2032
Network Probe Market Outlook (2022-2032)
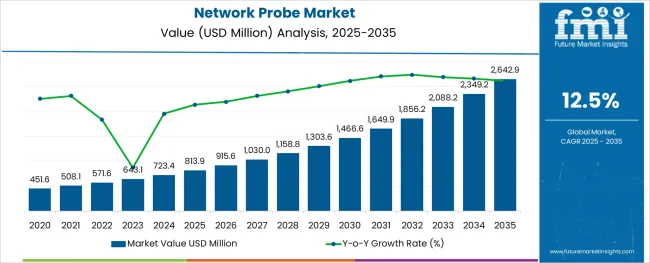
[303 Pages Report] The network probe market is anticipated to have a steady CAGR of 12.5% during the period 2022-2032.
The demand for network probe is predicted to grow from US$ 571.6 Million in 2022 to US$ 1.9 Billion in 2032. Previously, the network probe market was thriving at a higher CAGR of 14% (2016-2021), resulting in market size of US$ 509 Million in 2021.
The increased security concerns and network complexity can be related to the network probe market's rise. Simultaneously, the necessity to manage network downtime issues and stress caused by the exponential increase in IP traffic is fuelling the expanding the network probe market adoption. A growing number of businesses are embracing the latest cloud-based technologies, necessitating the use of well-established network frameworks. This is transforming the network probe market outlook.
Attributes |
Details |
Network Probe Market CAGR (2022-2032) |
12.5% |
Network Probe Market Size (2022) |
US$ 571.6 Million |
Network Probe Market Size (2032) |
US$ 1.9 Billion |
How does COVID-19 influence the Network Probe Market?
Several countries have enforced rigorous lockdowns, shutdowns, and mobility restrictions in response to the COVID-19 pandemic in place to avert the virus from spreading. Border closures, strict lockdowns, and supply chain concerns all function as roadblocks to the deployment of network probe equipment on-site.
The virus has had an impact on worldwide corporate effectiveness and profitability. The Internet traffic has increased dramatically as a result of many people using work from home facilities as a result of lockdown measures in numerous nations. As a result, network probe solutions are in higher demand to manage the rising connectivity and network risks. This is leading to change in the network probe market outlook and thus the network probe market share is expected to grow following the outbreak.
Let us know your requirement to get
100% FREE customization
What is Propelling the Network Probe Market?
As per the network probe market analysis, device interconnection and virtualization technology have grown rapidly as a result of the increased usage of modern technologies. As a result, the rate of cyber and unauthorised access has skyrocketed, prompting the creation of a comprehensive network efficiency and security evaluation system.
The companies are starting to deploy network probes to comprehend their network design. Network probe solutions safeguard both wired and wireless networks, as well as the core system, reducing the danger of cyberattacks. The demand for network probe is on a steady rise owing to the changing global requirements.
What Restrains the Network Probe Market?
Despite a global rise in the demand for network probe, there are still few restrictions that continue to hamper the growth of the network probe market share. Network probes aren't designed to provide a high level of visibility and control. The network probing tools are unable to access certain blind areas in the network. If there were any network challenges, it would be a costly process.
The network probe market's growth is projected to be hampered by high initial investment and a lack of awareness. The market is constrained because small and medium-sized organisations have smaller resources and cannot finance substantial capital outlay in outsourced network probing technologies. The adoption of network probe is still limited due to this factor.
The network probe market size's growth is also projected to be hampered by a lack of understanding about the benefits of network probing tools among small and medium businesses. This lack of awareness about network probe market needs to be dealt with to increase the growth of the industry.
Find your sweet spots for generating winning opportunities in this market.
Talk to AnalystWhat are the Trends in the Network Probe Market?
Major driving factors of the rising demand for network probe include the introduction of analytics and cloud technology, as well as the rising demand for proactive monitoring solutions. With the growing requirement for cybersecurity management, the network probe market is expected to grow significantly in the future. Improved cloud computing capabilities and an increase in the number of cloud-based infrastructure throughout the world are driving up network probe market share.
Furthermore, the expanding adoption of cloud and IoT, as well as growing network complexities and security issues, support the need for adoption of network probes. On the other hand, a lack of technical expertise stifles the network probe market expansion. Nonetheless, the growing demand for network monitoring tools among SMEs is expected to support market growth, providing lucrative growth opportunities for network probe market participants.
The internet is used by all major industries for day-to-day business activities, which has a favourable impact on the network probe market size. Furthermore, the increasing adoption of network probe capabilities in emerging enterprises is accelerating the network probe market share.
Comparative View of Adjacent Network Probe Market
Network Probe Market:
Attributes |
Network Probe Market |
CAGR (2022-2032) |
12.5% |
Market Value (2026) |
US$ 909 Million |
Growth Factor |
The use of cloud and IoT, as well as the optimization of company operations, are predicted to be the primary factors driving the growth of the network probe market. |
Opportunity |
Attacks on network security, increased labour efficiency, and cheaper costs are all driving drivers for network probe tool use. Vendors in the network probing market are projected to have new opportunities as a result of SMEs. |
Key Trends |
The demand for next-generation network detection and response (NDR) solutions to improve performance and visibility is expected to drive network probe market expansion. The market is expected to grow as a result of the development of a new wave of next-generation NDR products that simplify network security. |
Network Analytics Market:
Attributes |
Network Analytics Market |
CAGR (2022-2032) |
21% |
Market Value (2026) |
US$ 3.8 Billion |
Growth Factor |
Factors like tackling network complexity brought on by new technologies such as 5G, IoT, and cloud; increased data volume and traffic patterns; and increased SDN integration with existing network infrastructures are leading the network analytics market. |
Opportunity |
Rising share of voice assistant application market is creating new opportunities in the network analytics industry. |
Key Trends |
The rapid expansion of the network analytics market can be ascribed to the fast speed of infrastructure development in the United States, as well as the rapid growth of Internet of Things (IoT), Artificial Intelligence (AI), Machine Learning (ML), and cloud computing. |
LTE and 5G Broadcast Market:
Attributes |
LTE and 5G Broadcast Market |
CAGR (2022-2032) |
10.8% |
Market Value (2026) |
US$ 1072 Million |
Growth Factor |
The growing popularity of on-demand content and smooth mobile data services, as well as the growing requirement for vast connectivity of devices due to the evolution of IoT, are some of the major reasons driving the global LTE and 5G broadcast industry. |
Opportunity |
Mobile network operators have new revenue opportunities owing to LTE and 5G broadcast. |
Key Trends |
The core network and radio network have high upfront deployment expenses which might hinder the market growth rate. |
During the COVID-19 lockdown, demand for network probes declined, but it is expected to surge following the pandemic, as the need for network probe solutions to control increased network attacks and network traffic grows.
The network probe provides an overview of the most active protocols, listeners, talkers, hosts, and talks on a network, as well as notifying and proactively resolving any anomalies before they become problematic.
For every communication, protocol, or host, the network probe aids in the filtering and searching process. Simply type in the search area, and a network probe will propose entries that have been discovered on the network.
One of the primary reasons driving network probe market share expansion is the growing number of network-connected devices around the world. The network probe is used to track down problems or connection failures that stifle data flow between linked devices.

An unified Market Research Subscription Platform, built for today’s disparate research needs.
Which is the Leading Segment in the Network Probe Market by Deployment?
In 2020, the on-premise segment led the network probe market, accounting for more than 61.0 percent of worldwide revenue. When opposed to cloud-based solutions, on-premise network monitoring gives you more control over your network. This sort of deployment is preferred by IT experts because it allows them to customise solutions to match their specific needs.
Additionally, one of the primary drivers driving the adoption of network probe is the benefits provided by this deployment, such as performance reliability to service providers.
Over the projected period, the cloud segment of the network probe market is expected to increase at the fastest rate. The increased adoption of cloud-based software by enterprises to avoid the burden and expense of administering a system can be contributed to the segment's growth. Cloud-based software's smooth integration capability is contributing to its rising demand.
Which is the Leading Segment in the Network Probe Market by Enterprise Size?
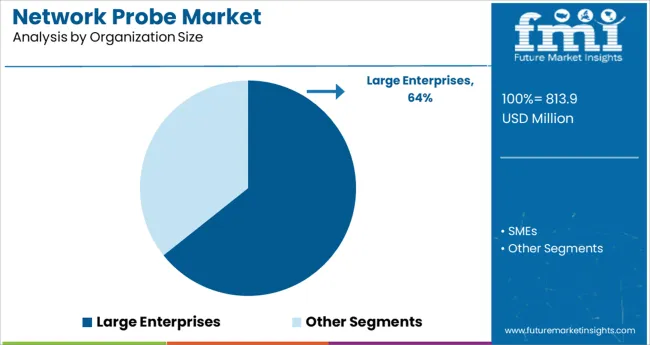
In 2020, the large companies segment led the network probe market, accounting for more than 53.0 percent of global revenue. Large organisations working in situations like geographically dispersed locations, cloud as a service architecture, and others are vulnerable to threats like cyber-attacks, necessitating the use of network monitoring software.
Furthermore, the growing investments made by large corporations to address cyber-attack worries are adding to the network probe market segment's growth.
Over the projected period, the small and medium enterprise segment is expected to increase the most. To stay competitive in the market, many small and medium enterprises are adopting the bring your own device and internet of things trends.
There is a growing demand for IT infrastructure to accommodate enterprises' increasing network traffic. As a result, the network probe market size is rising due to increased network traffic in small business activities.
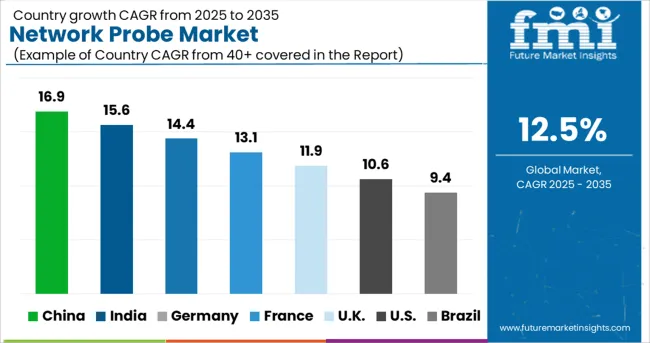
Which is the Leading Region in the Network Probe Market?
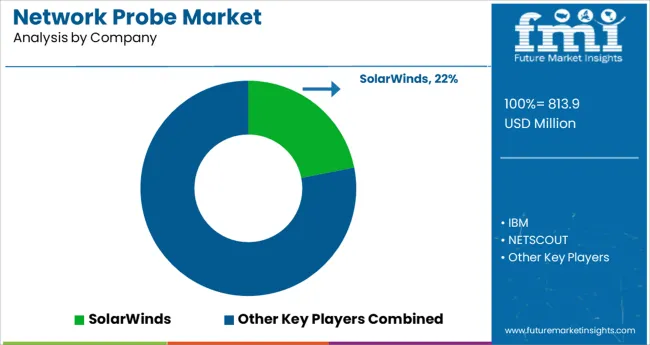
The greatest market for network probe technology is in North America. The network probe market's growth is fuelled by the existence of important industry players such as SolarWinds, NETSCOUT, and Broadcom, as well as significant technological advancements.
In addition, the region's network probe market size is boosted by increasing demand and early acceptance of cloud-based platforms, as well as well-established IT and telecom industries.
The regional demand for network probe is bolstered by the expanding use of innovative solutions and the growing number of SMEs in the region. The market is rising due to a growing focus on innovation, significant R&D investments, and an increase in the number of IT firms in the region.
Furthermore, the emerging trends in network probe market are influenced by the increased need for technology and services for web applications, mobile applications, API monitoring, and SaaS application monitoring.
The APAC network probe market is expected to grow rapidly in the next years. APAC is one of the world's fastest-growing regions. With the ongoing advancement of technology, the volume of data flow within corporate networks is steadily increasing.
As a result, the number of cyber-attacks such as malware, virus, and denial-of-service (DoS) on enterprise networks has increased, driving up demand for network probing solutions among businesses in the area, particularly in fast-growing countries like China, Japan, and India.
Regions |
CAGR (2022-2032) |
United States |
US$ 597.8 Mn |
United Kingdom |
US$ 82.3 Mn |
China |
US$ 132.4 Mn |
Japan |
US$ 110.8 Mn |
South Korea |
US$ 69.9 Mn |
How Competition Influences the Network Probe Market?
This network probe market appears to be extremely competitive and fragmented, with a competitive landscape formed by multiple mature firms. Mergers and acquisitions, collaborations, expansion, and product/technology development are all examples of strategic tactics taken by these players. They invest much in product development and growing their global footprints.
Some of the recent developments in the network probe market are:
SolarWinds and DNSFilter announced a collaboration in April 2021 to help MSPs defend their customers from internet security risks using advanced DNS technology. DNSFilter's cloud-based security solution would be integrated with N-Central to deliver threat protection and content filtering to MSPs.
Broadcom and Google established a partnership in April 2021 to accelerate innovation and increase cloud services integration. Broadcom will be able to provide its suites on Google Cloud Platform as a result of the partnership.
Nokia teamed with Tele2 in January 2021 to speed its digitalization using a distributed cloud core. Nokia will deliver the NetAct Network Management System as part of the agreement to help protect, automate, and scale network management operations.
Key Segments
By Component:
- Solution
- Services
- Consulting
- Integration and deployment
- Training and support
By Organization Size:
- SMEs
- Large Enterprises
By Deployment Mode:
- On-premises
- Cloud
By End Users:
- Service Providers
- Enterprises
- BFSI
- IT and ITeS
- Government
- Others
By Region:
-
North America
- US
- Canada
- Europe
- UK
- Germany
- France
- Rest of Europe
- APAC
- China
- Japan
- India
- Rest of APAC
- MEA
- Middle East
- Africa
- Latin America
- Brazil
- Mexico
- Rest of Latin America
Frequently Asked Questions
The network probe market is projected to have a CAGR of 12.5% during the forecast period.
North America is the leading region, with an anticipated CAGR of 11.9% through 2032.
Cloud segment leads the market with the projected CAGR of 10.9% through 2032.
The network probe market is predicted to grow US$ 1.9 Million by 2032.
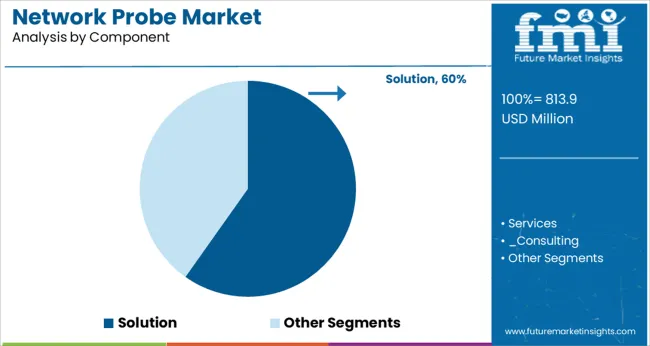
Solution component leads the network probe market with the projected CAGR of 11.6% through 2032.
1. Executive Summary
1.1. Global Market Outlook
1.2. Summary of Statistics
1.3. Key Market Characteristics & Attributes
1.4. FMI Analysis and Recommendations
2. Market Overview
2.1. Market Coverage
2.2. Market Definition
3. Market Risks and Trends Assessment
3.1. Risk Assessment
3.1.1. COVID-19 Crisis and Impact on Network Probe Demand
3.1.2. COVID-19 Impact Benchmark with Previous Crisis
3.1.3. Impact on Market Value (US$ Mn)
3.1.4. Assessment by Key Countries
3.1.5. Assessment by Key Market Segments
3.1.6. Action Points and Recommendation for Suppliers
3.2. Key Trends Impacting the Market
3.3. Formulation and Product Development Trends
4. Market Background
4.1. Network Probe Market, By Key Countries
4.2. Network Probe Market Opportunity Assessment (US$ Mn)
4.2.1. Total Available Market
4.2.2. Serviceable Addressable Market
4.2.3. Serviceable Obtainable Market
4.3. Market Scenario Forecast
4.3.1. Demand in optimistic Scenario
4.3.2. Demand in Likely Scenario
4.3.3. Demand in Conservative Scenario
4.4. Investment Feasibility Analysis
4.4.1. Investment in Established Markets
4.4.1.1. In Short Term
4.4.1.2. In Long Term
4.4.2. Investment in Emerging Markets
4.4.2.1. In Short Term
4.4.2.2. In Long Term
4.5. Forecast Factors - Relevance & Impact
4.5.1. Top Companies Historical Growth
4.5.2. Global Network Probe Market Growth
4.5.3. Network Probe Adoption Rate, By Country
4.6. Market Dynamics
4.6.1. Market Driving Factors and Impact Assessment
4.6.2. Prominent Market Challenges and Impact Assessment
4.6.3. Network Probe Market Opportunities
4.6.4. Prominent Trends in the Global Market & Their Impact Assessment
5. Key Success Factors
5.1. Manufacturers’ Focus on Low Penetration High Growth Markets
5.2. Banking on with Segments High Incremental Opportunity
5.3. Peer Benchmarking
6. Global Network Probe Market Demand Analysis 2015-2021 and Forecast, 2022-2032
6.1. Historical Market Analysis, 2015-2021
6.2. Current and Future Market Projections, 2022-2032
6.3. Y-o-Y Growth Trend Analysis
7. Global Network Probe Market Value Analysis 2015-2021 and Forecast, 2022-2032
7.1. Historical Market Value (US$ Mn) Analysis, 2015-2021
7.2. Current and Future Market Value (US$ Mn) Projections, 2022-2032
7.2.1. Y-o-Y Growth Trend Analysis
7.2.2. Absolute $ Opportunity Analysis
8. Global Network Probe Market Analysis 2015-2021 and Forecast 2022-2032, By Organization Size
8.1. Introduction / Key Findings
8.2. Historical Market Size (US$ Mn) Analysis By Organization Size, 2015-2021
8.3. Current and Future Market Size (US$ Mn) Analysis and Forecast By Organization Size, 2022-2032
8.3.1. Large Enterprises
8.3.2. SMEs
8.4. Market Attractiveness Analysis By Organization Size
9. Global Network Probe Market Analysis 2015-2021 and Forecast 2022-2032, By Component
9.1. Introduction / Key Findings
9.2. Historical Market Size (US$ Mn) Analysis By Component, 2015-2021
9.3. Current and Future Market Size (US$ Mn) Analysis and Forecast By Component, 2022-2032
9.3.1. Solution
9.3.2. Services
9.3.2.1. Consulting
9.3.2.2. Integration and Deployment
9.3.2.3. Training and Support
9.4. Market Attractiveness Analysis By Component
10. Global Network Probe Market Analysis 2015-2021 and Forecast 2022-2032, By End User
10.1. Introduction / Key Findings
10.2. Historical Market Size (US$ Mn) Analysis By End User, 2015-2021
10.3. Current and Future Market Size (US$ Mn) Analysis and Forecast By End User, 2022-2032
10.3.1. Service Providers
10.3.2. Enterprises
10.3.2.1. BFSI
10.3.2.2. IT and ITeS
10.3.2.3. Government
10.3.2.4. Others
10.4. Market Attractiveness Analysis By End User
11. Global Network Probe Market Analysis 2015-2021 and Forecast 2022-2032, By Deployment Mode
11.1. Introduction / Key Findings
11.2. Historical Market Size (US$ Mn) Analysis By Deployment Mode, 2015-2021
11.3. Current and Future Market Size (US$ Mn) Analysis and Forecast By Deployment Mode, 2022-2032
11.3.1. Cloud
11.3.2. On-premises
11.4. Market Attractiveness Analysis By Deployment Mode
12. Global Network Probe Market Analysis 2015-2021 and Forecast 2022-2032, By Region
12.1. Introduction
12.2. Historical Market Size (US$ Mn) Analysis By Region, 2015-2021
12.3. Current Market Size (US$ Mn) & Analysis and Forecast By Region, 2022-2032
12.3.1. North America
12.3.2. Latin America
12.3.3. Europe
12.3.4. Asia Pacific
12.3.5. Middle East and Africa (MEA)
12.4. Market Attractiveness Analysis By Region
13. North America Network Probe Market Analysis 2015-2021 and Forecast 2022-2032
13.1. Introduction
13.2. Pricing Analysis
13.3. Historical Market Value (US$ Mn) Trend Analysis By Market Taxonomy, 2015-2021
13.4. Market Value (US$ Mn) & Forecast By Market Taxonomy, 2022-2032
13.4.1. By Country
13.4.1.1. U.S.
13.4.1.2. Canada
13.4.2. By Organization Size
13.4.3. By Component
13.4.4. By Deployment Mode
13.4.5. By End User
13.5. Market Attractiveness Analysis
13.5.1. By Country
13.5.2. By Organization Size
13.5.3. By Component
13.5.4. By Deployment Mode
13.5.5. By End User
14. Latin America Network Probe Market Analysis 2015-2021 and Forecast 2022-2032
14.1. Introduction
14.2. Pricing Analysis
14.3. Historical Market Value (US$ Mn) Trend Analysis By Market Taxonomy, 2015-2021
14.4. Market Value (US$ Mn) & Forecast By Market Taxonomy, 2022-2032
14.4.1. By Country
14.4.1.1. Brazil
14.4.1.2. Mexico
14.4.1.3. Rest of Latin America
14.4.2. By Organization Size
14.4.3. By Component
14.4.4. By Deployment Mode
14.4.5. By End User
14.5. Market Attractiveness Analysis
14.5.1. By Country
14.5.2. By Organization Size
14.5.3. By Component
14.5.4. By Deployment Mode
14.5.5. By End User
15. Europe Network Probe Market Analysis 2015-2021 and Forecast 2022-2032
15.1. Introduction
15.2. Pricing Analysis
15.3. Historical Market Value (US$ Mn) Trend Analysis By Market Taxonomy, 2015-2021
15.4. Market Value (US$ Mn) & Forecast By Market Taxonomy, 2022-2032
15.4.1. By Country
15.4.1.1. Germany
15.4.1.2. France
15.4.1.3. U.K.
15.4.1.4. Italy
15.4.1.5. Benelux
15.4.1.6. Nordic Countries
15.4.1.7. Rest of Europe
15.4.2. By Organization Size
15.4.3. By Component
15.4.4. By Deployment Mode
15.4.5. By End User
15.5. Market Attractiveness Analysis
15.5.1. By Country
15.5.2. By Organization Size
15.5.3. By Component
15.5.4. By Deployment Mode
15.5.5. By End User
16. Asia Pacific Network Probe Market Analysis 2015-2021 and Forecast 2022-2032
16.1. Introduction
16.2. Pricing Analysis
16.3. Historical Market Value (US$ Mn) Trend Analysis By Market Taxonomy, 2015-2021
16.4. Market Value (US$ Mn) & Forecast By Market Taxonomy, 2022-2032
16.4.1. By Country
16.4.1.1. China
16.4.1.2. Japan
16.4.1.3. South Korea
16.4.1.4. Rest of Asia Pacific
16.4.2. By Organization Size
16.4.3. By Component
16.4.4. By Deployment Mode
16.4.5. By End User
16.5. Market Attractiveness Analysis
16.5.1. By Country
16.5.2. By Organization Size
16.5.3. By Component
16.5.4. By Deployment Mode
16.5.5. By End User
17. Middle East and Africa Network Probe Market Analysis 2015-2021 and Forecast 2022-2032
17.1. Introduction
17.2. Pricing Analysis
17.3. Historical Market Value (US$ Mn) Trend Analysis By Market Taxonomy, 2015-2021
17.4. Market Value (US$ Mn) & Forecast By Market Taxonomy, 2022-2032
17.4.1. By Country
17.4.1.1. GCC Countries
17.4.1.2. South Africa
17.4.1.3. Turkey
17.4.1.4. Rest of Middle East and Africa
17.4.2. By Organization Size
17.4.3. By Component
17.4.4. By Deployment Mode
17.4.5. By End User
17.5. Market Attractiveness Analysis
17.5.1. By Country
17.5.2. By Organization Size
17.5.3. By Component
17.5.4. By Deployment Mode
17.5.5. By End User
18. Key Countries Network Probe Market Analysis 2015-2021 and Forecast 2022-2032
18.1. Introduction
18.1.1. Market Value Proportion Analysis, By Key Countries
18.1.2. Global Vs. Country Growth Comparison
18.2. US Network Probe Market Analysis
18.2.1. Value Proportion Analysis by Market Taxonomy
18.2.2. Value Analysis and Forecast by Market Taxonomy, 2015-2032
18.2.2.1. By Organization Size
18.2.2.2. By Component
18.2.2.3. By Deployment Mode
18.2.2.4. By End User
18.3. Canada Network Probe Market Analysis
18.3.1. Value Proportion Analysis by Market Taxonomy
18.3.2. Value Analysis and Forecast by Market Taxonomy, 2015-2032
18.3.2.1. By Organization Size
18.3.2.2. By Component
18.3.2.3. By Deployment Mode
18.3.2.4. By End User
18.4. Mexico Network Probe Market Analysis
18.4.1. Value Proportion Analysis by Market Taxonomy
18.4.2. Value Analysis and Forecast by Market Taxonomy, 2015-2032
18.4.2.1. By Organization Size
18.4.2.2. By Component
18.4.2.3. By Deployment Mode
18.4.2.4. By End User
18.5. Brazil Network Probe Market Analysis
18.5.1. Value Proportion Analysis by Market Taxonomy
18.5.2. Value Analysis and Forecast by Market Taxonomy, 2015-2032
18.5.2.1. By Organization Size
18.5.2.2. By Component
18.5.2.3. By Deployment Mode
18.5.2.4. By End User
18.6. Germany Network Probe Market Analysis
18.6.1. Value Proportion Analysis by Market Taxonomy
18.6.2. Value Analysis and Forecast by Market Taxonomy, 2015-2032
18.6.2.1. By Organization Size
18.6.2.2. By Component
18.6.2.3. By Deployment Mode
18.6.2.4. By End User
18.7. France Network Probe Market Analysis
18.7.1. Value Proportion Analysis by Market Taxonomy
18.7.2. Value Analysis and Forecast by Market Taxonomy, 2015-2032
18.7.2.1. By Organization Size
18.7.2.2. By Component
18.7.2.3. By Deployment Mode
18.7.2.4. By End User
18.8. Italy Network Probe Market Analysis
18.8.1. Value Proportion Analysis by Market Taxonomy
18.8.2. Value Analysis and Forecast by Market Taxonomy, 2015-2032
18.8.2.1. By Organization Size
18.8.2.2. By Component
18.8.2.3. By Deployment Mode
18.8.2.4. By End User
18.9. BENELUX Network Probe Market Analysis
18.9.1. Value Proportion Analysis by Market Taxonomy
18.9.2. Value Analysis and Forecast by Market Taxonomy, 2015-2032
18.9.2.1. By Organization Size
18.9.2.2. By Component
18.9.2.3. By Deployment Mode
18.9.2.4. By End User
18.10. UK Network Probe Market Analysis
18.10.1. Value Proportion Analysis by Market Taxonomy
18.10.2. Value Analysis and Forecast by Market Taxonomy, 2015-2032
18.10.2.1. By Organization Size
18.10.2.2. By Component
18.10.2.3. By Deployment Mode
18.10.2.4. By End User
18.11. Nordic Countries Network Probe Market Analysis
18.11.1. Value Proportion Analysis by Market Taxonomy
18.11.2. Value Analysis and Forecast by Market Taxonomy, 2015-2032
18.11.2.1. By Organization Size
18.11.2.2. By Component
18.11.2.3. By Deployment Mode
18.11.2.4. By End User
18.12. China Network Probe Market Analysis
18.12.1. Value Proportion Analysis by Market Taxonomy
18.12.2. Value Analysis and Forecast by Market Taxonomy, 2015-2032
18.12.2.1. By Organization Size
18.12.2.2. By Component
18.12.2.3. By Deployment Mode
18.12.2.4. By End User
18.13. Japan Network Probe Market Analysis
18.13.1. Value Proportion Analysis by Market Taxonomy
18.13.2. Value Analysis and Forecast by Market Taxonomy, 2015-2032
18.13.2.1. By Organization Size
18.13.2.2. By Component
18.13.2.3. By Deployment Mode
18.13.2.4. By End User
18.14. South Korea Network Probe Market Analysis
18.14.1. Value Proportion Analysis by Market Taxonomy
18.14.2. Value Analysis and Forecast by Market Taxonomy, 2015-2032
18.14.2.1. By Organization Size
18.14.2.2. By Component
18.14.2.3. By Deployment Mode
18.14.2.4. By End User
18.15. GCC Countries Network Probe Market Analysis
18.15.1. Value Proportion Analysis by Market Taxonomy
18.15.2. Value Analysis and Forecast by Market Taxonomy, 2015-2032
18.15.2.1. By Organization Size
18.15.2.2. By Component
18.15.2.3. By Deployment Mode
18.15.2.4. By End User
18.16. South Africa Network Probe Market Analysis
18.16.1. Value Proportion Analysis by Market Taxonomy
18.16.2. Value Analysis and Forecast by Market Taxonomy, 2015-2032
18.16.2.1. By Organization Size
18.16.2.2. By Component
18.16.2.3. By Deployment Mode
18.16.2.4. By End User
18.17. Turkey Network Probe Market Analysis
18.17.1. Value Proportion Analysis by Market Taxonomy
18.17.2. Value Analysis and Forecast by Market Taxonomy, 2015-2032
18.17.2.1. By Organization Size
18.17.2.2. By Component
18.17.2.3. By Deployment Mode
18.17.2.4. By End User
18.17.3. Competition Landscape and Player Concentration in the Country
19. Market Structure Analysis
19.1. Market Analysis by Tier of Companies
19.2. Market Concentration
19.3. Market Share Analysis of Top Players
19.4. Market Presence Analysis
19.4.1. By Regional footprint of Players
19.4.2. Product footprint by Players
20. Competition Analysis
20.1. Competition Dashboard
20.2. Competition Benchmarking
20.3. Competition Deep Dive
20.3.1. SOLARWINDS
20.3.1.1. Overview
20.3.1.2. Product Portfolio
20.3.1.3. Sales Footprint
20.3.1.4. Strategy Overview
20.3.2. IBM
20.3.2.1. Overview
20.3.2.2. Product Portfolio
20.3.2.3. Sales Footprint
20.3.2.4. Strategy Overview
20.3.3. NETSCOUT
20.3.3.1. Overview
20.3.3.2. Product Portfolio
20.3.3.3. Sales Footprint
20.3.3.4. Strategy Overview
20.3.4. BROADCOM
20.3.4.1. Overview
20.3.4.2. Product Portfolio
20.3.4.3. Sales Footprint
20.3.4.4. Strategy Overview
20.3.5. CISCO
20.3.5.1. Overview
20.3.5.2. Product Portfolio
20.3.5.3. Sales Footprint
20.3.5.4. Strategy Overview
20.3.6. NOKIA
20.3.6.1. Overview
20.3.6.2. Product Portfolio
20.3.6.3. Sales Footprint
20.3.6.4. Strategy Overview
20.3.7. Kentik
20.3.7.1. Overview
20.3.7.2. Product Portfolio
20.3.7.3. Sales Footprint
20.3.7.4. Strategy Overview
20.3.8. Catchpoint
20.3.8.1. Overview
20.3.8.2. Product Portfolio
20.3.8.3. Sales Footprint
20.3.8.4. Strategy Overview
20.3.9. NEC Corporation
20.3.9.1. Overview
20.3.9.2. Product Portfolio
20.3.9.3. Sales Footprint
20.3.9.4. Strategy Overview
20.3.10. AppNeta
20.3.10.1. Overview
20.3.10.2. Product Portfolio
20.3.10.3. Sales Footprint
20.3.10.4. Strategy Overview
21. Assumptions and Acronyms Used
22. Research Methodology
Let us know your requirement to get
100% FREE customization
Table 1: Global Network Probe Market Value (US$ Mn),By Organization Size, 2015 – 2021
Table 2: Global Network Probe Market Value (US$ Mn),By Organization Size, 2022 – 2032
Table 3: Global Network Probe Market Value (US$ Mn), By Component, 2015 – 2021
Table 4: Global Network Probe Market Value (US$ Mn), By Component, 2022 – 2032
Table 5: Global Network Probe Market Value (US$ Mn), By End User, 2015 – 2021
Table 6: Global Network Probe Market Value (US$ Mn), By End User, 2022 – 2032
Table 7: Global Network Probe Market Value (US$ Mn), By Deployment Mode, 2015 – 2021
Table 8: Global Network Probe Market Value (US$ Mn), By Deployment Mode, 2022 – 2032
Table 9: Global Network Probe Market, By Region, 2015 – 2021
Table 10: Global Network Probe Market, By Region, 2022 – 2032
Table 11: North America Network Probe Market Value (US$ Mn),By Organization Size, 2015 – 2021
Table 12: North America Network Probe Market Value (US$ Mn),By Organization Size, 2022 – 2032
Table 13: North America Network Probe Market Value (US$ Mn), By Component, 2015 – 2021
Table 14: North America Network Probe Market Value (US$ Mn), By Component, 2022 – 2032
Table 15: North America Network Probe Market Value (US$ Mn), By End User, 2015 – 2021
Table 16: North America Network Probe Market Value (US$ Mn), By End User, 2022 – 2032
Table 17: North America Network Probe Market Value (US$ Mn), By Deployment Mode, 2015 – 2021
Table 18: North America Network Probe Market Value (US$ Mn), By Deployment Mode, 2022 – 2032
Table 19: North America Network Probe Market, By Country, 2015 – 2021
Table 20: North America Network Probe Market, By Country, 2022 – 2032
Table 21: Latin America Network Probe Market Value (US$ Mn),By Organization Size, 2015 – 2021
Table 22: Latin America Network Probe Market Value (US$ Mn),By Organization Size, 2022 – 2032
Table 23: Latin America Network Probe Market Value (US$ Mn), By Component, 2015 – 2021
Table 24: Latin America Network Probe Market Value (US$ Mn), By Component, 2022 – 2032
Table 25: Latin America Network Probe Market Value (US$ Mn), By End User, 2015 – 2021
Table 26: Latin America Network Probe Market Value (US$ Mn), By End User, 2022 – 2032
Table 27: Latin America Network Probe Market Value (US$ Mn), By Deployment Mode, 2015 – 2021
Table 28: Latin America Network Probe Market Value (US$ Mn), By Deployment Mode, 2022 – 2032
Table 29: Latin America Network Probe Market, By Country, 2015 – 2021
Table 30: Latin America Network Probe Market, By Country, 2022 – 2032
Table 31: Europe Network Probe Market Value (US$ Mn),By Organization Size, 2015 – 2021
Table 32: Europe Network Probe Market Value (US$ Mn),By Organization Size, 2022 – 2032
Table 33: Europe Network Probe Market Value (US$ Mn), By Component, 2015 – 2021
Table 34: Europe Network Probe Market Value (US$ Mn), By Component, 2022 – 2032
Table 35: Europe Network Probe Market Value (US$ Mn), By End User, 2015 – 2021
Table 36: Europe Network Probe Market Value (US$ Mn), By End User, 2022 – 2032
Table 37: Europe Network Probe Market Value (US$ Mn), By Deployment Mode, 2015 – 2021
Table 38: Europe Network Probe Market Value (US$ Mn), By Deployment Mode, 2022 – 2032
Table 39: Europe Network Probe Market, By Country, 2015 – 2021
Table 40: Europe Network Probe Market, By Country, 2022 – 2032
Table 41: Asia Pacific Network Probe Market Value (US$ Mn),By Organization Size, 2015 – 2021
Table 42: Asia Pacific Network Probe Market Value (US$ Mn),By Organization Size, 2022 – 2032
Table 43: Asia Pacific Network Probe Market Value (US$ Mn), By Component, 2015 – 2021
Table 44: Asia Pacific Network Probe Market Value (US$ Mn), By Component, 2022 – 2032
Table 45: Asia Pacific Network Probe Market Value (US$ Mn), By End User, 2015 – 2021
Table 46: Asia Pacific Network Probe Market Value (US$ Mn), By End User, 2022 – 2032
Table 47: Asia Pacific Network Probe Market Value (US$ Mn), By Deployment Mode, 2015 – 2021
Table 48: Asia Pacific Network Probe Market Value (US$ Mn), By Deployment Mode, 2022 – 2032
Table 49: Asia Pacific Network Probe Market, By Country, 2015 – 2021
Table 50: Asia Pacific Network Probe Market, By Country, 2022 – 2032
Table 51: MEA Network Probe Market Value (US$ Mn),By Organization Size, 2015 – 2021
Table 52: MEA Network Probe Market Value (US$ Mn),By Organization Size, 2022 – 2032
Table 53: MEA Network Probe Market Value (US$ Mn), By Component, 2015 – 2021
Table 54: MEA Network Probe Market Value (US$ Mn), By Component, 2022 – 2032
Table 55: MEA Network Probe Market Value (US$ Mn), By End User, 2015 – 2021
Table 56: MEA Network Probe Market Value (US$ Mn), By End User, 2022 – 2032
Table 57: MEA Network Probe Market Value (US$ Mn), By Deployment Mode, 2015 – 2021
Table 58: MEA Network Probe Market Value (US$ Mn), By Deployment Mode, 2022 – 2032
Table 59: MEA Network Probe Market, By Country, 2015 – 2021
Table 60: MEA Network Probe Market, By Country, 2022 – 2032
Find your sweet spots for generating winning opportunities in this market.
Talk to AnalystFigure 1: Global Network Probe Market Value (US$ Mn) and Year-on-Year Growth, 2015-2032
Figure 2: Global Network Probe Market Absolute $ Historical Gain (2015 - 2021) and Opportunity (2022 – 2032), US$ Mn
Figure 3: Global Network Probe Market Share, By By Organization Size, 2022 & 2032
Figure 4: Global Network Probe Market Y-o-Y Growth Projections, By Organization Size – 2022-2032
Figure 5: Global Network Probe Market Attractiveness Index, By Organization Size – 2022-2032
Figure 6: Global Network Probe Market Share, By Component, 2022 & 2032
Figure 7: Global Network Probe Market Y-o-Y Growth Projections, By Component – 2022-2032
Figure 8: Global Network Probe Market Attractiveness Index, By Component – 2022-2032
Figure 9: Global Network Probe Market Share, By Deployment Mode, 2022 & 2032
Figure 10: Global Network Probe Market Y-o-Y Growth Projections, By Deployment Mode – 2022-2032
Figure 11: Global Network Probe Market Attractiveness Index, By Deployment Mode – 2022-2032
Figure 12: Global Network Probe Market Share, By End User, 2022 & 2032
Figure 13: Global Network Probe Market Y-o-Y Growth Projections, By End User – 2022-2032
Figure 14: Global Network Probe Market Attractiveness Index, By End User – 2022-2032
Figure 15: Global Network Probe Market Share, By Region, 2022 & 2032
Figure 16: Global Network Probe Market Y-o-Y Growth Projections, By Region – 2022-2032
Figure 17: Global Network Probe Market Attractiveness Index, By Region – 2022-2032
Figure 18: North America Network Probe Market Value (US$ Mn) and Year-on-Year Growth, 2015-2032
Figure 19: North America Network Probe Market Absolute $ Opportunity Historical (2015 - 2021) and Forecast Period (2022 – 2032), US$ Mn
Figure 20: North America Network Probe Market Share, By Organization Size, 2022 & 2032
Figure 21: North America Network Probe Market Y-o-Y Growth Projections, By Organization Size – 2022-2032
Figure 22: North America Network Probe Market Attractiveness Index, By Organization Size – 2022-2032
Figure 23: North America Network Probe Market Share, By Component, 2022 & 2032
Figure 24: North America Network Probe Market Y-o-Y Growth Projections, By Component – 2022-2032
Figure 25: North America Network Probe Market Attractiveness Index, By Component – 2022-2032
Figure 26: North America Network Probe Market Share, By Deployment Mode, 2022 & 2032
Figure 27: North America Network Probe Market Y-o-Y Growth Projections, By Deployment Mode – 2022-2032
Figure 28: North America Network Probe Market Attractiveness Index, By Deployment Mode – 2022-2032
Figure 29: North America Network Probe Market Share, By End User, 2022 & 2032
Figure 30: North America Network Probe Market Y-o-Y Growth Projections, By End User – 2022-2032
Figure 31: North America Network Probe Market Attractiveness Index, By End User – 2022-2032
Figure 32: North America Network Probe Market Share, By Country, 2022 & 2032
Figure 33: North America Network Probe Market Y-o-Y Growth Projections, By Country – 2022-2032
Figure 34: North America Network Probe Market Attractiveness Index, By Country – 2022-2032
Figure 35: Latin America Network Probe Market Value (US$ Mn) and Year-on-Year Growth, 2015-2032
Figure 36: Latin America Network Probe Market Absolute $ Opportunity Historical (2015 - 2021) and Forecast Period (2022 – 2032), US$ Mn
Figure 37: Latin America Network Probe Market Share, By Organization Size, 2022 & 2032
Figure 38: Latin America Network Probe Market Y-o-Y Growth Projections, By Organization Size – 2022-2032
Figure 39: Latin America Network Probe Market Attractiveness Index, By Organization Size – 2022-2032
Figure 40: Latin America Network Probe Market Share, By Component, 2022 & 2032
Figure 41: Latin America Network Probe Market Y-o-Y Growth Projections, By Component – 2022-2032
Figure 42: Latin America Network Probe Market Attractiveness Index, By Component – 2022-2032
Figure 43: Latin America Network Probe Market Share, By Deployment Mode, 2022 & 2032
Figure 44: Latin America Network Probe Market Y-o-Y Growth Projections, By Deployment Mode – 2022-2032
Figure 45: Latin America Network Probe Market Attractiveness Index, By Deployment Mode – 2022-2032
Figure 46: Latin America Network Probe Market Share, By End User, 2022 & 2032
Figure 47: Latin America Network Probe Market Y-o-Y Growth Projections, By End User – 2022-2032
Figure 48: Latin America Network Probe Market Attractiveness Index, By End User – 2022-2032
Figure 49: Latin America Network Probe Market Share, By Country, 2022 & 2032
Figure 50: Latin America Network Probe Market Y-o-Y Growth Projections, By Country – 2022-2032
Figure 51: Latin America Network Probe Market Attractiveness Index, By Country – 2022-2032
Figure 52: Europe Network Probe Market Value (US$ Mn) and Year-on-Year Growth, 2015-2032
Figure 53: Europe Network Probe Market Absolute $ Opportunity Historical (2015 - 2021) and Forecast Period (2022 – 2032), US$ Mn
Figure 54: Europe Network Probe Market Share, By Organization Size, 2022 & 2032
Figure 55: Europe Network Probe Market Y-o-Y Growth Projections, By Organization Size – 2022-2032
Figure 56: Europe Network Probe Market Attractiveness Index, By Organization Size – 2022-2032
Figure 57: Europe Network Probe Market Share, By Component, 2022 & 2032
Figure 58: Europe Network Probe Market Y-o-Y Growth Projections, By Component – 2022-2032
Figure 59: Europe Network Probe Market Attractiveness Index, By Component – 2022-2032
Figure 60: Europe Network Probe Market Share, By Deployment Mode, 2022 & 2032
Figure 61: Europe Network Probe Market Y-o-Y Growth Projections, By Deployment Mode – 2022-2032
Figure 62: Europe Network Probe Market Attractiveness Index, By Deployment Mode – 2022-2032
Figure 63: Europe Network Probe Market Share, By End User, 2022 & 2032
Figure 64: Europe Network Probe Market Y-o-Y Growth Projections, By End User – 2022-2032
Figure 65: Europe Network Probe Market Attractiveness Index, By End User – 2022-2032
Figure 66: Europe Network Probe Market Share, By Country, 2022 & 2032
Figure 67: Europe Network Probe Market Y-o-Y Growth Projections, By Country – 2022-2032
Figure 68: Europe Network Probe Market Attractiveness Index, By Country – 2022-2032
Figure 69: MEA Network Probe Market Value (US$ Mn) and Year-on-Year Growth, 2015-2032
Figure 70: MEA Network Probe Market Absolute $ Opportunity Historical (2015 - 2021) and Forecast Period (2022 – 2032), US$ Mn
Figure 71: MEA Network Probe Market Share, By Organization Size, 2022 & 2032
Figure 72: MEA Network Probe Market Y-o-Y Growth Projections, By Organization Size – 2022-2032
Figure 73: MEA Network Probe Market Attractiveness Index, By Organization Size – 2022-2032
Figure 74: MEA Network Probe Market Share, By Component, 2022 & 2032
Figure 75: MEA Network Probe Market Y-o-Y Growth Projections, By Component – 2022-2032
Figure 76: MEA Network Probe Market Attractiveness Index, By Component – 2022-2032
Figure 77: MEA Network Probe Market Share, By Deployment Mode, 2022 & 2032
Figure 78: MEA Network Probe Market Y-o-Y Growth Projections, By Deployment Mode – 2022-2032
Figure 79: MEA Network Probe Market Attractiveness Index, By Deployment Mode – 2022-2032
Figure 80: MEA Network Probe Market Share, By End User, 2022 & 2032
Figure 81: MEA Network Probe Market Y-o-Y Growth Projections, By End User – 2022-2032
Figure 82: MEA Network Probe Market Attractiveness Index, By End User – 2022-2032
Figure 83: MEA Network Probe Market Share, By Country, 2022 & 2032
Figure 84: MEA Network Probe Market Y-o-Y Growth Projections, By Country – 2022-2032
Figure 85: MEA Network Probe Market Attractiveness Index, By Country – 2022-2032
Figure 86: Asia Pacific Network Probe Market Value (US$ Mn) and Year-on-Year Growth, 2015-2032
Figure 87: Asia Pacific Network Probe Market Absolute $ Opportunity Historical (2015 - 2021) and Forecast Period (2022 – 2032), US$ Mn
Figure 88: Asia Pacific Network Probe Market Share, By Organization Size, 2022 & 2032
Figure 89: Asia Pacific Network Probe Market Y-o-Y Growth Projections, By Organization Size – 2022-2032
Figure 90: Asia Pacific Network Probe Market Attractiveness Index, By Organization Size – 2022-2032
Figure 91: Asia Pacific Network Probe Market Share, By Component, 2022 & 2032
Figure 92: Asia Pacific Network Probe Market Y-o-Y Growth Projections, By Component – 2022-2032
Figure 93: Asia Pacific Network Probe Market Attractiveness Index, By Component – 2022-2032
Figure 94: Asia Pacific Network Probe Market Share, By Deployment Mode, 2022 & 2032
Figure 95: Asia Pacific Network Probe Market Y-o-Y Growth Projections, By Deployment Mode – 2022-2032
Figure 96: Asia Pacific Network Probe Market Attractiveness Index, By Deployment Mode – 2022-2032
Figure 97: Asia Pacific Network Probe Market Share, By End User, 2022 & 2032
Figure 98: Asia Pacific Network Probe Market Y-o-Y Growth Projections, By End User – 2022-2032
Figure 99: Asia Pacific Network Probe Market Attractiveness Index, By End User – 2022-2032
Figure 100: Asia Pacific Network Probe Market Share, By Country, 2022 & 2032
Figure 101: Asia Pacific Network Probe Market Y-o-Y Growth Projections, By Country – 2022-2032
Figure 102: Asia Pacific Network Probe Market Attractiveness Index, By Country – 2022-2032
Need specific information?
Request CustomizationExplore Technology Insights
View Reports