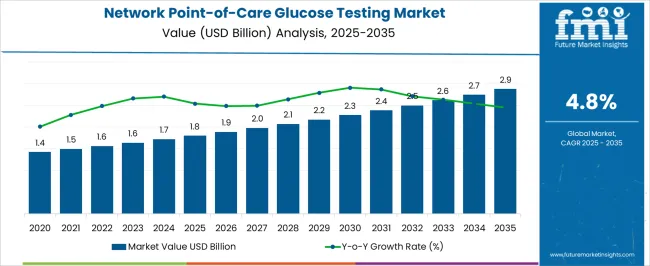
The Network Point-of-Care Glucose Testing Market is estimated to be valued at USD 1.8 billion in 2025 and is projected to reach USD 2.9 billion by 2035, registering a compound annual growth rate (CAGR) of 4.8% over the forecast period.
| Metric | Value |
|---|---|
| Network Point-of-Care Glucose Testing Market Estimated Value in (2025 E) | USD 1.8 billion |
| Network Point-of-Care Glucose Testing Market Forecast Value in (2035 F) | USD 2.9 billion |
| Forecast CAGR (2025 to 2035) | 4.8% |
The network point of care glucose testing market is experiencing notable growth driven by the global push for decentralized diagnostics, real time patient monitoring, and the integration of connected healthcare infrastructure. The increasing prevalence of diabetes and related metabolic disorders has led to the widespread adoption of portable and connected glucose monitoring systems that enable immediate clinical decisions.
Healthcare providers are prioritizing solutions that allow seamless data transfer to electronic medical records, enhancing both care coordination and patient outcomes. Advances in wireless communication, cloud connectivity, and device interoperability are contributing to the demand for smart testing solutions in hospitals, clinics, and remote care settings.
The future market landscape is expected to benefit from ongoing investments in digital health, telemedicine, and personalized treatment pathways, with point of care technologies playing a central role in chronic disease management and preventive healthcare strategies.
The market is segmented by Product Type and region. By Product Type, the market is divided into i-STAT, Accu-Chek Inform II, Stat Strip, Hemo Cue, Care Sens Expert Plus, and BARO-zen H Expert Plus. Regionally, the market is classified into North America, Latin America, Western Europe, Eastern Europe, Balkan & Baltic Countries, Russia & Belarus, Central Asia, East Asia, South Asia & Pacific, and the Middle East & Africa.
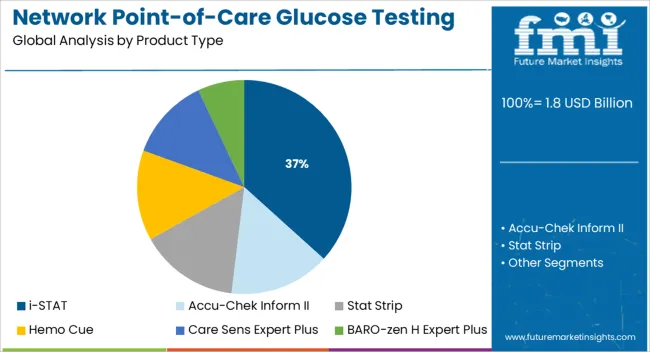
The i STAT segment is projected to represent 36.70% of the total market revenue by 2025 under the product type category, making it the most prominent segment. This leadership is attributed to its multifunctional diagnostic capabilities, compact form factor, and compatibility with networked healthcare systems.
The ability of the i STAT device to provide rapid and lab accurate glucose readings at the bedside supports its integration in critical care and emergency departments. Its proven clinical utility in reducing turnaround time and enhancing diagnostic efficiency has led to widespread adoption across both acute and chronic care environments.
Moreover, its data connectivity features enable seamless integration with hospital information systems, ensuring streamlined workflow and improved decision making. As the demand for intelligent point of care diagnostics continues to grow, the i STAT product maintains its leading position due to its proven reliability, connectivity features, and adaptability to a range of clinical scenarios.
Network point-of-care glucose testing is a growing testing method that does not require testing in the laboratory but is instead performed near or at the site of the patient to monitor the glucose levels. This ensures minimal risk of infection and provides information within a few seconds.
Future Market Insights reveals that revenue from Accu-Chek Inform II dominated the segment of product type. Revenue from Accu-Chek Inform II grew at a CAGR of 4.5% from 2020 to 2024. It is projected to achieve a growth rate of 4.9% during the forecasted period of 2025 to 2035.
On the other hand, North America dominated the market for network-point-of-care glucose testing. It achieved a growth rate of 4.8% from 2020 to 2024 and is projected to witness revenue growth of 4.9% CAGR over the forecasted period.
Network Point-of-care glucose testing is significantly gaining traction for the diagnosis of diabetes as well as for analyzing patients’ health conditions. It has come as an efficient tool for preventing delays in treatment and providing results in less time. Moreover, the demand for remote patient monitoring systems and the need for data-based patient results are driving the market for network point-of-glucose testing.
As the number of diabetes patients is surging, there is an increasing demand to incorporate the patient data and perform proper management of the data to derive insightful information and develop an advanced method for data transfer techniques.
The growing incidence of diabetes necessitates glucose testing among individuals. According to WHO data, 422 million people globally are suffering from diabetes, the majority of whom are living in underdeveloped countries.
Therefore, the treatment of glucose testing becomes vital for these nations as they remain undiagnosed and are at risk of developing diseases associated with diabetes such as blindness, kidney failure, stroke, and heart attack.
Based on a WHO report in 2020, diabetes contributed to the ninth leading cause of death with an estimation of 1.7 million deaths. According to Diabetes Federation data published in 2024, almost 1 in 2 diabetes patients were undiagnosed, and in Asia-Pacific, the proportion was estimated to be 55%, largely contributed by India, China, and Indonesia.
Therefore, it becomes essential to expand the coverage of network point-of-care glucose testing methods in low and middle-income countries as well as developed countries.
North America is the largest user of network point-of-care testing methods. Revenue through Network point-of-care glucose testing grew at a CAGR of 4.8% from 2020 to 2024. North America is expected to dominate the market with a 4.9% CAGR from 2025 to 2035. Prominent key players such as Abbott, Nova Medical, and prodigy Diabetes Care, LLC are aiding the regional market growth. Moreover, several initiatives by the government and not-for-profit organizations to increase awareness about the adoption of advanced glucose meters are driving growth in North America.
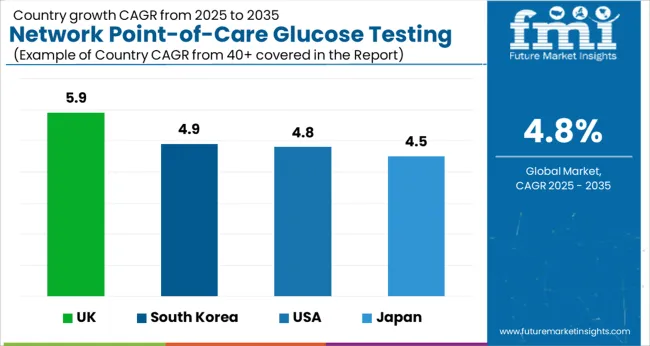
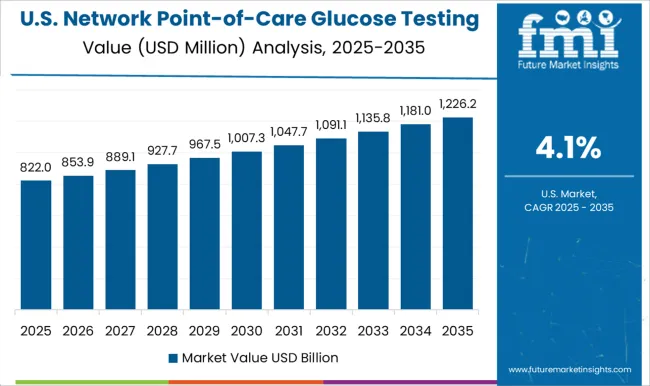
The network point-of-care glucose testing market in the USA was valued at USD 2.9 million by 2035. Revenue through the market grew at 4.6% CAGR from 2020 to 2024. The projected growth rate in the network point-of-care glucose testing market is 4.9% over the forecasted period. According to the data from American Diabetes Association, almost 1.4 million Americans, or 11.3% of the population had diabetes in 2020.
Out of which 8.5 million were undiagnosed and 244,000 children and adolescents in the USA were suffering from diabetes. This necessitates the need for conducting point-of-care glucose testing among individuals and ensuring early recovery from chronic disease.
Key companies like Abbott had maintained their presence in the USA market by providing FreeStyl e Libre 2 integrated continuous glucose monitoring system which is used by the most number of Americans to track health statistics in a mobile app. The absolute dollar opportunity growth in the network point-of-care glucose testing market in the USA is USD 276.2 million by 2035.
The network point-of-care glucose testing market in the United Kingdom is projected to reach a valuation of USD 119 million by 2035. Growing at a CAGR of 5.8%, the market is expected to register an absolute dollar opportunity of USD 1.8 million from 2025 to 2035.
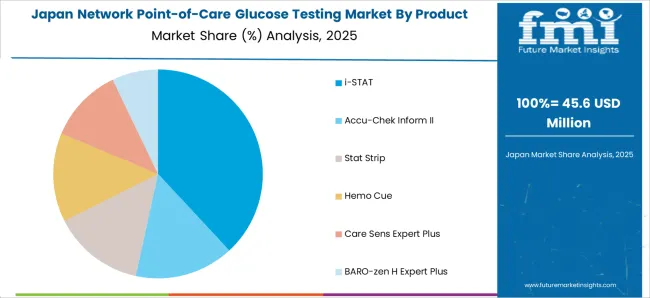
The market in Japan is expected to gross an absolute dollar opportunity of USD 36 million during the forecast period. Growing at a CAGR of 4.5%, the market is likely to reach a valuation of USD 101 million by 2035.
In South Korea, the market is projected to reach a valuation of USD 59 million by 2035. Growing at a CAGR of 4.9%, the market from 2025 to 2035 is expected to gross an absolute dollar opportunity of USD 23 million.
Accu-Chek Inform II is widely used as a point-of-care glucose testing monitor. Revenue through Accu-Chek Inform II grew at a CAGR of 4.5% from 2020 to 2024. The anticipated growth rate of Accu-Chek Inform II is 4.9% during the forecasted period of 2025 to 2035.
The rise in the use of Accu-Chek Inform II is attributed to its automatic real-time wireless features which enable proper transmission of patient data between the medical staff and the laboratories. The system also offers unique features such as unique identification of patients to avoid inaccuracy.
Due to the prevalence of diabetes in Asia, the network point-of-care glucose testing market is expected to witness growth in the forecasted period. Almost 90 million adults are suffering from diabetes in the IDF South-East Asia region and is estimated to witness a spike in diabetes patients to 152 million by 2045. Countries in the Asia-Pacific have made efforts to employ point-of-care glucose testing methods to reduce the occurrence of diabetes.
For instance, in China, the government incentivized hospitals to employ diabetes management systems. Hospitals in Tianjin have administered blood glucose information systems to improvise blood glucose monitoring, treatment, and management.
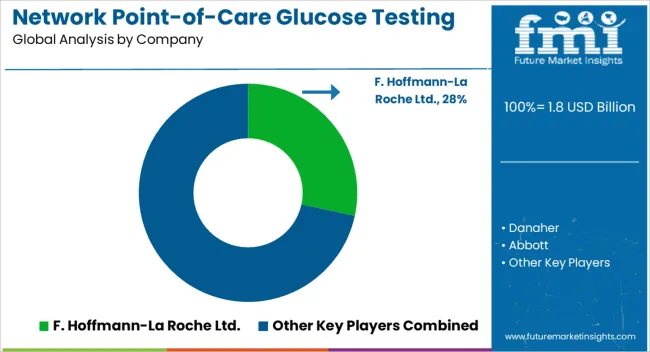
Companies involved in network point-of-care glucose testing are solely aiming at increasing diabetes awareness and producing advanced point-of-care glucose testing devices. The key companies operating in the network point-of-care glucose testing market include F.
Hoffmann-La Roche Ltd. Danaher, Abbott, Nipro, Platinum Equity Advisors, LLC (Lifescan, Inc.), Nova Biomedical, ACON Laboratories, Trividia Health, Inc., Prodigy Diabetes Care, LLC, Bayer AG/Ascensia Diabetes Care Holdings AG, EKF Diagnostics and others.
Some of the recent developments by key providers of Network Point-of-Care Glucose Testing are as follows:
Similarly, recent developments related to companies operating in the network point-of-care glucose testing market have been tracked by the team at Future Market Insights, which is available in the full report.
The global network point-of-care glucose testing market is estimated to be valued at USD 1.8 billion in 2025.
The market size for the network point-of-care glucose testing market is projected to reach USD 2.9 billion by 2035.
The network point-of-care glucose testing market is expected to grow at a 4.8% CAGR between 2025 and 2035.
The key product types in network point-of-care glucose testing market are i-stat, accu-chek inform ii, stat strip, hemo cue, care sens expert plus and baro-zen h expert plus.
In terms of , segment to command 0.0% share in the network point-of-care glucose testing market in 2025.


Our Research Products

The "Full Research Suite" delivers actionable market intel, deep dives on markets or technologies, so clients act faster, cut risk, and unlock growth.

The Leaderboard benchmarks and ranks top vendors, classifying them as Established Leaders, Leading Challengers, or Disruptors & Challengers.

Locates where complements amplify value and substitutes erode it, forecasting net impact by horizon

We deliver granular, decision-grade intel: market sizing, 5-year forecasts, pricing, adoption, usage, revenue, and operational KPIs—plus competitor tracking, regulation, and value chains—across 60 countries broadly.

Spot the shifts before they hit your P&L. We track inflection points, adoption curves, pricing moves, and ecosystem plays to show where demand is heading, why it is changing, and what to do next across high-growth markets and disruptive tech

Real-time reads of user behavior. We track shifting priorities, perceptions of today’s and next-gen services, and provider experience, then pace how fast tech moves from trial to adoption, blending buyer, consumer, and channel inputs with social signals (#WhySwitch, #UX).

Partner with our analyst team to build a custom report designed around your business priorities. From analysing market trends to assessing competitors or crafting bespoke datasets, we tailor insights to your needs.
Supplier Intelligence
Discovery & Profiling
Capacity & Footprint
Performance & Risk
Compliance & Governance
Commercial Readiness
Who Supplies Whom
Scorecards & Shortlists
Playbooks & Docs
Category Intelligence
Definition & Scope
Demand & Use Cases
Cost Drivers
Market Structure
Supply Chain Map
Trade & Policy
Operating Norms
Deliverables
Buyer Intelligence
Account Basics
Spend & Scope
Procurement Model
Vendor Requirements
Terms & Policies
Entry Strategy
Pain Points & Triggers
Outputs
Pricing Analysis
Benchmarks
Trends
Should-Cost
Indexation
Landed Cost
Commercial Terms
Deliverables
Brand Analysis
Positioning & Value Prop
Share & Presence
Customer Evidence
Go-to-Market
Digital & Reputation
Compliance & Trust
KPIs & Gaps
Outputs
Full Research Suite comprises of:
Market outlook & trends analysis
Interviews & case studies
Strategic recommendations
Vendor profiles & capabilities analysis
5-year forecasts
8 regions and 60+ country-level data splits
Market segment data splits
12 months of continuous data updates
DELIVERED AS:
PDF EXCEL ONLINE
Automotive Network Testing Market Size and Share Forecast Outlook 2025 to 2035
Network Simulator Software Market Size and Share Forecast Outlook 2025 to 2035
Glucose Sensor Market Size and Share Forecast Outlook 2025 to 2035
Network Connectivity Tester Market Size and Share Forecast Outlook 2025 to 2035
Network Analyzers Market Size and Share Forecast Outlook 2025 to 2035
Network as a Service (NaaS) Market Size and Share Forecast Outlook 2025 to 2035
Network Analytics Market Size and Share Forecast Outlook 2025 to 2035
Network Devices Market Size and Share Forecast Outlook 2025 to 2035
Network Sandboxing Market Size and Share Forecast Outlook 2025 to 2035
Network Access Control (NAC) Market Size and Share Forecast Outlook 2025 to 2035
Network Monitoring Market Size and Share Forecast Outlook 2025 to 2035
Network Encryption Market Size and Share Forecast Outlook 2025 to 2035
Network Packet Broker Market Size and Share Forecast Outlook 2025 to 2035
Network Traffic Analytics Market Size and Share Forecast Outlook 2025 to 2035
Network Function Virtualization (NFV) Market Size and Share Forecast Outlook 2025 to 2035
Network Cable Tester Market Size and Share Forecast Outlook 2025 to 2035
Network Forensics Market Size and Share Forecast Outlook 2025 to 2035
Network Telemetry Market Size and Share Forecast Outlook 2025 to 2035
Network Security Policy Management Market Size and Share Forecast Outlook 2025 to 2035
Network Probe Market Size and Share Forecast Outlook 2025 to 2035

Thank you!
You will receive an email from our Business Development Manager. Please be sure to check your SPAM/JUNK folder too.
Chat With
MaRIA