Glucose Sensor Market Size and Share Forecast Outlook 2025 to 2035

The Glucose Sensor Market is estimated to be valued at USD 9.7 billion in 2025 and is projected to reach USD 22.2 billion by 2035, registering a compound annual growth rate (CAGR) of 8.5% over the forecast period.
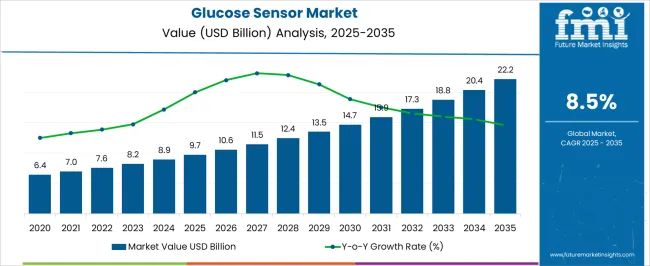
Quick Stats for Glucose Sensor Market

  • Glucose Sensor Market Industry Value (2025): USD 9.7 billion
  • Glucose Sensor Market Forecast Value (2035): USD 22.2 billion
  • Glucose Sensor Market Forecast CAGR: 8.5%
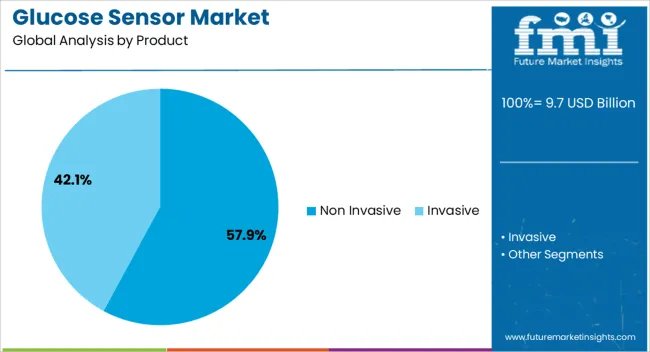
  • Leading Segment in Glucose Sensor Market in 2025: Non Invasive (57.9%)
  • Key Growth Region in Glucose Sensor Market: North America, Asia-Pacific, Europe
  • Top Key Players in Glucose Sensor Market: Abbott Diagnostics, Pinnacle Technologies Inc., 77 Elektronika KFT, Sanofi, LifeScan, Inc., Dexcom Inc., Ypsomed, GlySens Inc., Medtronic, Novo Nordisk A/S

Glucose Sensor Market Market Value Analysis

Metric Value
Glucose Sensor Market Estimated Value in (2025 E) USD 9.7 billion
Glucose Sensor Market Forecast Value in (2035 F) USD 22.2 billion
Forecast CAGR (2025 to 2035) 8.5%

Rationale for Segmental Growth in the Glucose Sensor Market

The glucose sensor market is expanding steadily, propelled by the rising global prevalence of diabetes, increasing awareness about continuous glucose monitoring, and advancements in sensor technologies. Clinical studies and healthcare reports have emphasized the importance of real-time glucose monitoring in improving patient outcomes, leading to growing adoption in both hospital and outpatient care settings.

Technological innovations, including the use of optical methods, microfluidic systems, and minimally invasive designs, have enhanced the accuracy and patient comfort of glucose sensors. Additionally, government health initiatives and reimbursement frameworks supporting diabetes management tools have further accelerated adoption.

Press releases and investor updates from medtech companies have also highlighted ongoing research collaborations aimed at developing non-invasive and wearable glucose sensors, reflecting a shift towards patient-friendly solutions. Looking ahead, the market is expected to witness continued growth, supported by digital health integration, the use of AI-driven data analytics for glucose pattern recognition, and the expansion of connected care platforms. Hospitals and healthcare institutions are projected to remain key end users, while non-invasive and optical-based technologies lead innovation and adoption.
Segmental Analysis

Insights into the Product Segment: Non Invasive

Glucose Sensor Market Analysis By Product

The Non Invasive segment is projected to hold 57.9% of the glucose sensor market revenue in 2025, establishing itself as the leading product category. Growth in this segment has been supported by the increasing demand for pain-free, convenient monitoring methods that improve patient compliance. Non-invasive sensors eliminate the need for finger pricks or implantable devices, offering greater comfort and reducing the risk of infection.

Clinical trials and product announcements have highlighted advancements in wearable devices and optical sensing methods that provide accurate readings without blood samples. Healthcare providers have increasingly recommended these devices for their ability to support continuous monitoring and early detection of glucose fluctuations.

As consumer health technology adoption rises, non-invasive glucose sensors have also gained popularity in homecare and remote monitoring. This alignment of patient preference, clinical need, and technological innovation has solidified the segment’s leading market share.
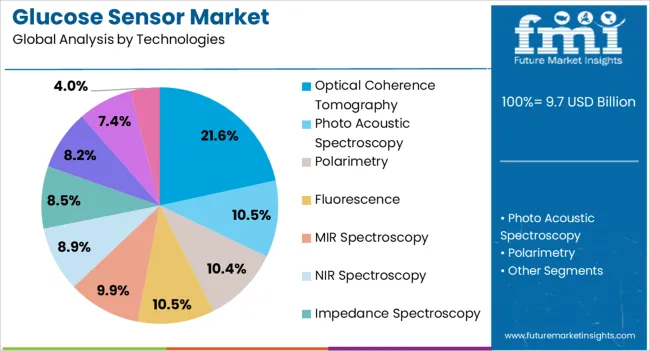
Insights into the Technologies Segment: Optical Coherence Tomography

Glucose Sensor Market Analysis By Technologies

The Optical Coherence Tomography (OCT) segment is projected to account for 21.6% of the glucose sensor market revenue in 2025, positioning itself as a leading technology. The adoption of OCT in glucose monitoring has been driven by its ability to provide high-resolution, non-contact imaging of tissue to measure glucose concentration accurately.

Research articles and technology demonstrations have shown that OCT-based systems offer precision in detecting glucose-induced changes in tissue scattering properties, making them highly reliable. This technology has been favored in both clinical and experimental settings due to its non-invasive nature and ability to generate real-time results.

Investments by medical device companies in OCT-based glucose sensors have been noted in investor presentations, underscoring the growing confidence in its scalability. As patient demand for reliable, non-invasive glucose monitoring grows, OCT technologies are expected to gain further traction, supported by ongoing miniaturization and integration with wearable platforms.
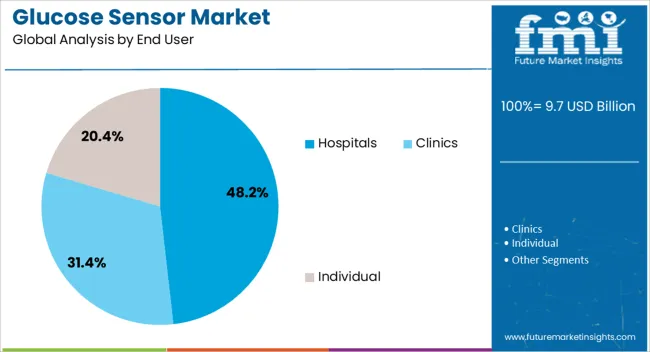
Insights into the End User Segment: Hospitals

Glucose Sensor Market Analysis By End User

The Hospitals segment is projected to contribute 48.2% of the glucose sensor market revenue in 2025, maintaining its position as the dominant end user. This leadership has been influenced by the reliance of hospitals on advanced glucose monitoring technologies to manage critically ill and diabetic patients.

Hospital-based adoption has been supported by the need for continuous, accurate, and real-time glucose data in intensive care and surgical settings. Clinical guidelines and institutional protocols have emphasized the role of glucose sensors in improving patient safety and reducing complications associated with hyperglycemia and hypoglycemia.

Furthermore, hospitals have benefited from reimbursement support and procurement initiatives that prioritize advanced monitoring systems. Training programs and clinical validation studies conducted in hospitals have also accelerated adoption, ensuring that staff are proficient in utilizing new sensor technologies. With the rising burden of diabetes-related hospitalizations and the increasing integration of connected monitoring systems, hospitals are expected to retain their leadership as the primary end users of glucose sensors.

Non-invasive Glucose Monitoring Devices Mark a Leap Forward

Non-invasive glucose sensing is a game-changer in diabetic care. Technologies like optical sensors and saliva-based monitors offer pain-free substitutions to traditional methods. They appeal to those hesitant about invasive devices due to discomfort. As these technologies get better, they could transform glucose monitoring industry and enhance life for people with diabetes.

Like, the Know Labs’ new wearable non-invasive continuous glucose monitor launched in February 2025. It is yet to undergo FDA trials but has potential in enhancing the user experience. It has a rechargeable battery and a companion mobile app.

Artificial Intelligence is Being Used in Glucose Sensing

Glucose sensors paired with AI and predictive analytics offer proactive diabetes management. These systems analyze glucose patterns to forecast future levels, foreseeing potential highs or lows.

By giving early alerts and personalized advice, AI-driven monitoring helps individuals with diabetes prevent issues and keep their blood sugar in check. As AI algorithms learn and adapt, they become better at predicting glucose levels, leading to healthier outcomes and lower healthcare costs due to fewer complications. As technology progress, the industry benefits with improved potentials.

Glucose Sensor Market Trends Analysis

  • Governments and healthcare organization are investing more in the management of diabetes and its prevention. This is creating a need for advanced glucose monitoring technologies.
  • Focus on preventive healthcare is high. Awareness of early detection and intervention for chronic diseases is raising the demand in the industry.
  • Manufacturers are focusing on product designs that are user-friendly. They are developing assistive technologies for people with disabilities. This is helping them reach more consumers and increase their revenues.

Glucose Sensor Market Opportunity Analysis

  • Providing glucose sensing solutions for specific user groups like children, athletes, and elderly individuals can be opportunistic. This can help in meeting the diverse needs of various user demographics.
  • Aligning with healthcare trends can be beneficial. Glucose sensor manufacturers can grok in digital therapeutics and precision nutrition to advance in the industry.
  • Building an open interoperable ecosystem for glucose monitoring technologies can be opportunistic. This can lead to innovation, collaboration, and value creation in the healthcare industry.

Category-wise Insights

Invasive Product Segment Bags the Leading Shares

Segment Invasive (Product)
Value Share (2025) 68.4%

The invasive product segment holds the leading glucose sensor market shares in 2025. Invasive glucose sensors, like those in CGM systems, offer reliability and accuracy in glucose measurement, owing to proven enzymatic or electrochemical sensing technologies. They provide real-time continuous monitoring, helping in gaining insights into glucose trends and patterns.

They also aid in reducing the risks of hypo- and hyperglycemia by allowing adjustments in insulin dosing. Integration with insulin pumps creates automated systems, that mimic a healthy pancreas. They are affordable and accessible, which makes them more preferred in the industry.

Hospitals Continue Being the Leading End Users

Segment Hospitals (End User)
Value Share (2025) 41.4%

The hospitals end-user segment captured the leading glucose sensor market shares in 2025. With the global rise in diabetes cases, there is a nearly equivalent surge in diabetes-related hospitalizations. Glucose sensors, particularly CGM systems, are important in managing these conditions by offering real-time data for timely interventions.

They are increasingly integrated into hospital workflows, aiding continuous monitoring and improving care coordination. In hospitals, they enhance patient safety by providing early alerts for glucose fluctuations. They help in optimizing insulin therapy and supporting critical care patients in ICUs.

Hospitals are investing in advanced monitoring technologies like these sensors to improve patient outcomes, hastening the demand for these devices in the healthcare sector.

Country-wise Insights

This section analyzes the demand for glucose sensors in key countries as given in the table below. The industry is led by sales of glucose sensors in India. The United States and China are close behind. This indicates that Asia Pacific is emerging as a key hotspot for growth. The demand in Germany is comparatively lower. Australia & New Zealand are showing prospects of promising growth in the coming years. A detailed explanation is below the table.

Countries Value CAGR (2025 to 2035)
United States 7%
Germany 5.6%
China 7.5%
India 8.4%
Australia & New Zealand 6.6%

Focus on Giving Value-based Care to Patients Amplifies Adoption in the United States

The demand for glucose sensor devices in the United States will rise at a 7% CAGR till 2035. The American healthcare sector is focusing more on helping patients get better while keeping costs down. Glucose sensors are a big part of this because they help manage diabetes better and prevent problems.

The government and insurance companies decide which sensors are allowed and paid for. People want glucose sensing devices that are easy to use and help them take charge of their health. With millions of diabetic patients in the nation, these sensors are necessary in the healthcare industry.

Dexcom Inc. and Abbott Laboratories are prominent in the United States. These companies offer various diabetic care products. They invest in marketing and promotion to raise awareness of their products. They value product affordability and accessibility.

Emphasis on Preventive Healthcare Raise Sales in Germany

The glucose sensor sales in Germany will amplify at a 5.6% CAGR until 2035. Preventive healthcare and lifestyle management, specifically for chronic conditions like diabetes, are highly valued. Glucose sensing gadgets that offer proactive monitoring and insights into lifestyle factors are in high demand in Germany.

The country's focus on personalized medicine drives demand for sensors providing tailored recommendations based on individual data. Germany's emphasis on data privacy ensures compliance with strict laws like GDPR, leading to demand for sensors that prioritize patient privacy and security. These factors accentuate the importance of glucose sensing devices in Germany's advanced healthcare system.

Medtronic PLC is popular in Germany. The company has a strong reputation and distribution network in the country, and throughout Europe.

Government Initiatives and Healthcare Reforms Catapult Sales in China

The growth of the glucose sensor market in China is estimated at a 7.5% Y.o.Y. rate until 2035. In China, the government is working on making healthcare better and encouraging new medical technology. Glucose sensor companies can benefit from this support. More people in China are using telemedicine and remote monitoring, especially in places far from hospitals. This helps manage diabetes from afar.

As China's economy grows, people can spend more on healthcare, so there's a bigger need for advanced devices like glucose sensors. More people are moving to cities and changing their lifestyles, which leads to more diabetes.

People in China want glucose monitoring devices that fit their city life. This means there are good opportunities for glucose sensor companies in China.

Focus on Developing Low-cost Options Presents Opportunities in India

The demand for glucose sensor devices in India will rise at an 8.4% CAGR until 2035. There is a strong push for healthcare services and technologies to be affordable in the country. Businesses are working on making low-cost options and spreading awareness about them, especially in rural areas.

Since India has diverse cultures, companies are making sure their sensors fit people's preferences and needs, offering language support and personalized help. This reflects a growing opportunity for glucose sensor manufacturers to make a positive impact on India's healthcare landscape.

Focus on Indigenous Health Fosters the Industry in Australia & New Zealand

The demand for glucose sensors in Australia & New Zealand will surge at a 6.6% CAGR till 2035. There is a higher focus on indigenous health in these countries. Glucose sensor manufacturers are working with indigenous communities to create diabetes management solutions tailored to their needs.

Government funding supports healthcare, including subsidies for medical devices like sensors, presenting opportunities for manufacturers. Patient education is also important, with companies investing in programs to help people manage their diabetes better. Collaboration with governments and healthcare groups is key to accessing support and expanding reach in these countries.
Competitive Landscape

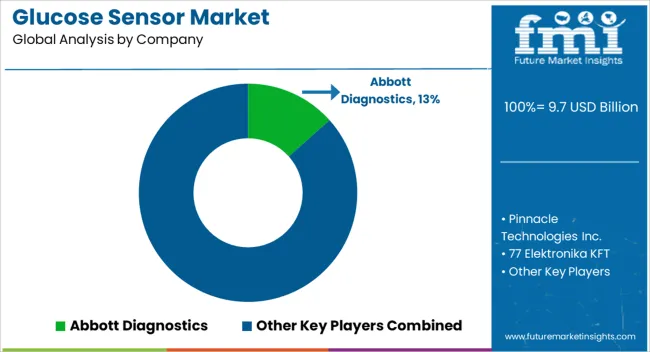
Glucose Sensor Market Analysis By Company

The glucose sensor industry is highly competitive, with players like Abbott Laboratories, Dexcom, and Medtronic leading. These firms prioritize R&D to develop and introduce new technology. Startups also add to the competition with niche solutions, challenging established players. Strategic partnerships and collaborations drive innovation, while regulatory compliance governs market entrance.

Recent Developments

  • In March 2025, Dexcom’s Stelo the new over-the-counter continuous glucose monitor, was approved by FDA for use. It is designed for patients with Type 2 diabetes who do not use insulin.
  • In March 2025, Amrita University, a private university in India, launched Amrita Spandanam, a wearable device that can measure blood glucose and monitor blood pressure without cuffs.

Key Players in the Glucose Sensor Industry

  • Abbott Laboratories
  • Dexcom, Inc.
  • Medtronic plc
  • Roche Diabetes Care
  • Senseonics Holdings, Inc.
  • Ascensia Diabetes Care
  • LifeScan, Inc. (a Johnson & Johnson company)
  • Ypsomed AG
  • Nemaura Medical Inc.
  • MicroPort Scientific Corporation

Segmentation Analysis

By Product:

The sector fragments into Non-invasive (Optical Sensors, Trans Dermal Sensors, Minimally Invasive, and Micro pore/ Micro Needles), Invasive (Intravenous Implantable, Micro Dialysis, and Subcutaneous Sensor)

By Technologies:

The industry is segmented into Photo Acoustic Spectroscopy, Optical Coherence Tomography, Polarimetry, Fluorescence, MIR Spectroscopy, NIR Spectroscopy, Impedance Spectroscopy, Skin Suction Blister Technique, Sonophoresis, and Reverse Iontophoresis.

By End User:

The industry bifurcates into Hospitals and Clinics.

By Region:

Analysis of the market has been conducted in the countries of North America, Latin America, Europe, East Asia, South Asia & Pacific, Middle East & Africa (MEA).

Frequently Asked Questions

How big is the glucose sensor market in 2025?

The global glucose sensor market is estimated to be valued at USD 9.7 billion in 2025.

What will be the size of glucose sensor market in 2035?

The market size for the glucose sensor market is projected to reach USD 22.2 billion by 2035.

How much will be the glucose sensor market growth between 2025 and 2035?

The glucose sensor market is expected to grow at a 8.5% CAGR between 2025 and 2035.

What are the key product types in the glucose sensor market?

The key product types in glucose sensor market are non invasive, _optical sensors, _trans dermal sensors, _minimally invasive, _micro pore/ micro needles, invasive, _intravenous implantable, _micro dialysis and _subcutaneous sensor.

Which technologies segment to contribute significant share in the glucose sensor market in 2025?

In terms of technologies, optical coherence tomography segment to command 21.6% share in the glucose sensor market in 2025.

Table of Content

  1. Executive Summary
    • Global Market Outlook
    • Demand-side Trends
    • Supply-side Trends
    • Technology Roadmap Analysis
    • Analysis and Recommendations
  2. Market Overview
    • Market Coverage / Taxonomy
    • Market Definition / Scope / Limitations
  3. Market Background
    • Market Dynamics
      • Drivers
      • Restraints
      • Opportunity
      • Trends
    • Scenario Forecast
      • Demand in Optimistic Scenario
      • Demand in Likely Scenario
      • Demand in Conservative Scenario
    • Opportunity Map Analysis
    • Product Life Cycle Analysis
    • Supply Chain Analysis
    • Investment Feasibility Matrix
    • Value Chain Analysis
    • PESTLE and Porter’s Analysis
    • Regulatory Landscape
    • Regional Parent Market Outlook
    • Production and Consumption Statistics
    • Import and Export Statistics
  4. Global Market Analysis 2020 to 2024 and Forecast, 2025 to 2035
    • Historical Market Size Value (USD Million) Analysis, 2020 to 2024
    • Current and Future Market Size Value (USD Million) Projections, 2025 to 2035
      • Y-o-Y Growth Trend Analysis
      • Absolute $ Opportunity Analysis
  5. Global Market Pricing Analysis 2020 to 2024 and Forecast 2025 to 2035
  6. Global Market Analysis 2020 to 2024 and Forecast 2025 to 2035, By Product
    • Introduction / Key Findings
    • Historical Market Size Value (USD Million) Analysis By Product , 2020 to 2024
    • Current and Future Market Size Value (USD Million) Analysis and Forecast By Product , 2025 to 2035
      • Non Invasive
        • Optical Sensors
        • Trans Dermal Sensors
        • Minimally Invasive
        • Micro Pore/ Micro Needles
      • Invasive
        • Intravenous Implantable
        • Micro Dialysis
        • Subcutaneous Sensor
    • Y-o-Y Growth Trend Analysis By Product , 2020 to 2024
    • Absolute $ Opportunity Analysis By Product , 2025 to 2035
  7. Global Market Analysis 2020 to 2024 and Forecast 2025 to 2035, By Technologies
    • Introduction / Key Findings
    • Historical Market Size Value (USD Million) Analysis By Technologies, 2020 to 2024
    • Current and Future Market Size Value (USD Million) Analysis and Forecast By Technologies, 2025 to 2035
      • Optical Coherence Tomography
      • Photo Acoustic Spectroscopy
      • Polarimetry
      • Fluorescence
      • MIR Spectroscopy
      • NIR Spectroscopy
      • Impedance Spectroscopy
      • Skin Suction Blister Technique
      • Sonophoresis
      • Reverse Iontophoresis
    • Y-o-Y Growth Trend Analysis By Technologies, 2020 to 2024
    • Absolute $ Opportunity Analysis By Technologies, 2025 to 2035
  8. Global Market Analysis 2020 to 2024 and Forecast 2025 to 2035, By End User
    • Introduction / Key Findings
    • Historical Market Size Value (USD Million) Analysis By End User, 2020 to 2024
    • Current and Future Market Size Value (USD Million) Analysis and Forecast By End User, 2025 to 2035
      • Hospitals
      • Clinics
      • Individual
    • Y-o-Y Growth Trend Analysis By End User, 2020 to 2024
    • Absolute $ Opportunity Analysis By End User, 2025 to 2035
  9. Global Market Analysis 2020 to 2024 and Forecast 2025 to 2035, By Region
    • Introduction
    • Historical Market Size Value (USD Million) Analysis By Region, 2020 to 2024
    • Current Market Size Value (USD Million) Analysis and Forecast By Region, 2025 to 2035
      • North America
      • Latin America
      • Western Europe
      • Eastern Europe
      • East Asia
      • South Asia and Pacific
      • Middle East & Africa
    • Market Attractiveness Analysis By Region
  10. North America Market Analysis 2020 to 2024 and Forecast 2025 to 2035, By Country
    • Historical Market Size Value (USD Million) Trend Analysis By Market Taxonomy, 2020 to 2024
    • Market Size Value (USD Million) Forecast By Market Taxonomy, 2025 to 2035
      • By Country
        • USA
        • Canada
        • Mexico
      • By Product
      • By Technologies
      • By End User
    • Market Attractiveness Analysis
      • By Country
      • By Product
      • By Technologies
      • By End User
    • Key Takeaways
  11. Latin America Market Analysis 2020 to 2024 and Forecast 2025 to 2035, By Country
    • Historical Market Size Value (USD Million) Trend Analysis By Market Taxonomy, 2020 to 2024
    • Market Size Value (USD Million) Forecast By Market Taxonomy, 2025 to 2035
      • By Country
        • Brazil
        • Chile
        • Rest of Latin America
      • By Product
      • By Technologies
      • By End User
    • Market Attractiveness Analysis
      • By Country
      • By Product
      • By Technologies
      • By End User
    • Key Takeaways
  12. Western Europe Market Analysis 2020 to 2024 and Forecast 2025 to 2035, By Country
    • Historical Market Size Value (USD Million) Trend Analysis By Market Taxonomy, 2020 to 2024
    • Market Size Value (USD Million) Forecast By Market Taxonomy, 2025 to 2035
      • By Country
        • Germany
        • UK
        • Italy
        • Spain
        • France
        • Nordic
        • BENELUX
        • Rest of Western Europe
      • By Product
      • By Technologies
      • By End User
    • Market Attractiveness Analysis
      • By Country
      • By Product
      • By Technologies
      • By End User
    • Key Takeaways
  13. Eastern Europe Market Analysis 2020 to 2024 and Forecast 2025 to 2035, By Country
    • Historical Market Size Value (USD Million) Trend Analysis By Market Taxonomy, 2020 to 2024
    • Market Size Value (USD Million) Forecast By Market Taxonomy, 2025 to 2035
      • By Country
        • Russia
        • Poland
        • Hungary
        • Balkan & Baltic
        • Rest of Eastern Europe
      • By Product
      • By Technologies
      • By End User
    • Market Attractiveness Analysis
      • By Country
      • By Product
      • By Technologies
      • By End User
    • Key Takeaways
  14. East Asia Market Analysis 2020 to 2024 and Forecast 2025 to 2035, By Country
    • Historical Market Size Value (USD Million) Trend Analysis By Market Taxonomy, 2020 to 2024
    • Market Size Value (USD Million) Forecast By Market Taxonomy, 2025 to 2035
      • By Country
        • China
        • Japan
        • South Korea
      • By Product
      • By Technologies
      • By End User
    • Market Attractiveness Analysis
      • By Country
      • By Product
      • By Technologies
      • By End User
    • Key Takeaways
  15. South Asia and Pacific Market Analysis 2020 to 2024 and Forecast 2025 to 2035, By Country
    • Historical Market Size Value (USD Million) Trend Analysis By Market Taxonomy, 2020 to 2024
    • Market Size Value (USD Million) Forecast By Market Taxonomy, 2025 to 2035
      • By Country
        • India
        • ASEAN
        • Australia & New Zealand
        • Rest of South Asia and Pacific
      • By Product
      • By Technologies
      • By End User
    • Market Attractiveness Analysis
      • By Country
      • By Product
      • By Technologies
      • By End User
    • Key Takeaways
  16. Middle East & Africa Market Analysis 2020 to 2024 and Forecast 2025 to 2035, By Country
    • Historical Market Size Value (USD Million) Trend Analysis By Market Taxonomy, 2020 to 2024
    • Market Size Value (USD Million) Forecast By Market Taxonomy, 2025 to 2035
      • By Country
        • Kingdom of Saudi Arabia
        • Other GCC Countries
        • Turkiye
        • South Africa
        • Other African Union
        • Rest of Middle East & Africa
      • By Product
      • By Technologies
      • By End User
    • Market Attractiveness Analysis
      • By Country
      • By Product
      • By Technologies
      • By End User
    • Key Takeaways
  17. Key Countries Market Analysis
    • USA
      • Pricing Analysis
      • Market Share Analysis, 2024
        • By Product
        • By Technologies
        • By End User
    • Canada
      • Pricing Analysis
      • Market Share Analysis, 2024
        • By Product
        • By Technologies
        • By End User
    • Mexico
      • Pricing Analysis
      • Market Share Analysis, 2024
        • By Product
        • By Technologies
        • By End User
    • Brazil
      • Pricing Analysis
      • Market Share Analysis, 2024
        • By Product
        • By Technologies
        • By End User
    • Chile
      • Pricing Analysis
      • Market Share Analysis, 2024
        • By Product
        • By Technologies
        • By End User
    • Germany
      • Pricing Analysis
      • Market Share Analysis, 2024
        • By Product
        • By Technologies
        • By End User
    • UK
      • Pricing Analysis
      • Market Share Analysis, 2024
        • By Product
        • By Technologies
        • By End User
    • Italy
      • Pricing Analysis
      • Market Share Analysis, 2024
        • By Product
        • By Technologies
        • By End User
    • Spain
      • Pricing Analysis
      • Market Share Analysis, 2024
        • By Product
        • By Technologies
        • By End User
    • France
      • Pricing Analysis
      • Market Share Analysis, 2024
        • By Product
        • By Technologies
        • By End User
    • India
      • Pricing Analysis
      • Market Share Analysis, 2024
        • By Product
        • By Technologies
        • By End User
    • ASEAN
      • Pricing Analysis
      • Market Share Analysis, 2024
        • By Product
        • By Technologies
        • By End User
    • Australia & New Zealand
      • Pricing Analysis
      • Market Share Analysis, 2024
        • By Product
        • By Technologies
        • By End User
    • China
      • Pricing Analysis
      • Market Share Analysis, 2024
        • By Product
        • By Technologies
        • By End User
    • Japan
      • Pricing Analysis
      • Market Share Analysis, 2024
        • By Product
        • By Technologies
        • By End User
    • South Korea
      • Pricing Analysis
      • Market Share Analysis, 2024
        • By Product
        • By Technologies
        • By End User
    • Russia
      • Pricing Analysis
      • Market Share Analysis, 2024
        • By Product
        • By Technologies
        • By End User
    • Poland
      • Pricing Analysis
      • Market Share Analysis, 2024
        • By Product
        • By Technologies
        • By End User
    • Hungary
      • Pricing Analysis
      • Market Share Analysis, 2024
        • By Product
        • By Technologies
        • By End User
    • Kingdom of Saudi Arabia
      • Pricing Analysis
      • Market Share Analysis, 2024
        • By Product
        • By Technologies
        • By End User
    • Turkiye
      • Pricing Analysis
      • Market Share Analysis, 2024
        • By Product
        • By Technologies
        • By End User
    • South Africa
      • Pricing Analysis
      • Market Share Analysis, 2024
        • By Product
        • By Technologies
        • By End User
  18. Market Structure Analysis
    • Competition Dashboard
    • Competition Benchmarking
    • Market Share Analysis of Top Players
      • By Regional
      • By Product
      • By Technologies
      • By End User
  19. Competition Analysis
    • Competition Deep Dive
      • Abbott Diagnostics
        • Overview
        • Product Portfolio
        • Profitability by Market Segments (Product/Age /Sales Channel/Region)
        • Sales Footprint
        • Strategy Overview
          • Marketing Strategy
          • Product Strategy
          • Channel Strategy
      • Pinnacle Technologies Inc.
      • 77 Elektronika KFT
      • Sanofi
      • LifeScan, Inc.
      • Dexcom Inc.
      • Ypsomed
      • GlySens Inc.
      • Medtronic
      • Novo Nordisk A/S
  20. Assumptions & Acronyms Used
  21. Research Methodology

List of Tables

  • Table 1: Global Market Value (USD Million) Forecast by Region, 2020-2035
  • Table 2: Global Market Value (USD Million) Forecast by Product , 2020-2035
  • Table 3: Global Market Value (USD Million) Forecast by Technologies, 2020-2035
  • Table 4: Global Market Value (USD Million) Forecast by End User, 2020-2035
  • Table 5: North America Market Value (USD Million) Forecast by Country, 2020-2035
  • Table 6: North America Market Value (USD Million) Forecast by Product , 2020-2035
  • Table 7: North America Market Value (USD Million) Forecast by Technologies, 2020-2035
  • Table 8: North America Market Value (USD Million) Forecast by End User, 2020-2035
  • Table 9: Latin America Market Value (USD Million) Forecast by Country, 2020-2035
  • Table 10: Latin America Market Value (USD Million) Forecast by Product , 2020-2035
  • Table 11: Latin America Market Value (USD Million) Forecast by Technologies, 2020-2035
  • Table 12: Latin America Market Value (USD Million) Forecast by End User, 2020-2035
  • Table 13: Western Europe Market Value (USD Million) Forecast by Country, 2020-2035
  • Table 14: Western Europe Market Value (USD Million) Forecast by Product , 2020-2035
  • Table 15: Western Europe Market Value (USD Million) Forecast by Technologies, 2020-2035
  • Table 16: Western Europe Market Value (USD Million) Forecast by End User, 2020-2035
  • Table 17: Eastern Europe Market Value (USD Million) Forecast by Country, 2020-2035
  • Table 18: Eastern Europe Market Value (USD Million) Forecast by Product , 2020-2035
  • Table 19: Eastern Europe Market Value (USD Million) Forecast by Technologies, 2020-2035
  • Table 20: Eastern Europe Market Value (USD Million) Forecast by End User, 2020-2035
  • Table 21: East Asia Market Value (USD Million) Forecast by Country, 2020-2035
  • Table 22: East Asia Market Value (USD Million) Forecast by Product , 2020-2035
  • Table 23: East Asia Market Value (USD Million) Forecast by Technologies, 2020-2035
  • Table 24: East Asia Market Value (USD Million) Forecast by End User, 2020-2035
  • Table 25: South Asia and Pacific Market Value (USD Million) Forecast by Country, 2020-2035
  • Table 26: South Asia and Pacific Market Value (USD Million) Forecast by Product , 2020-2035
  • Table 27: South Asia and Pacific Market Value (USD Million) Forecast by Technologies, 2020-2035
  • Table 28: South Asia and Pacific Market Value (USD Million) Forecast by End User, 2020-2035
  • Table 29: Middle East & Africa Market Value (USD Million) Forecast by Country, 2020-2035
  • Table 30: Middle East & Africa Market Value (USD Million) Forecast by Product , 2020-2035
  • Table 31: Middle East & Africa Market Value (USD Million) Forecast by Technologies, 2020-2035
  • Table 32: Middle East & Africa Market Value (USD Million) Forecast by End User, 2020-2035

List of Figures

  • Figure 1: Global Market Pricing Analysis
  • Figure 2: Global Market Value (USD Million) Forecast 2020-2035
  • Figure 3: Global Market Value Share and BPS Analysis by Product , 2025 and 2035
  • Figure 4: Global Market Y-o-Y Growth Comparison by Product , 2025-2035
  • Figure 5: Global Market Attractiveness Analysis by Product
  • Figure 6: Global Market Value Share and BPS Analysis by Technologies, 2025 and 2035
  • Figure 7: Global Market Y-o-Y Growth Comparison by Technologies, 2025-2035
  • Figure 8: Global Market Attractiveness Analysis by Technologies
  • Figure 9: Global Market Value Share and BPS Analysis by End User, 2025 and 2035
  • Figure 10: Global Market Y-o-Y Growth Comparison by End User, 2025-2035
  • Figure 11: Global Market Attractiveness Analysis by End User
  • Figure 12: Global Market Value (USD Million) Share and BPS Analysis by Region, 2025 and 2035
  • Figure 13: Global Market Y-o-Y Growth Comparison by Region, 2025-2035
  • Figure 14: Global Market Attractiveness Analysis by Region
  • Figure 15: North America Market Incremental Dollar Opportunity, 2025-2035
  • Figure 16: Latin America Market Incremental Dollar Opportunity, 2025-2035
  • Figure 17: Western Europe Market Incremental Dollar Opportunity, 2025-2035
  • Figure 18: Eastern Europe Market Incremental Dollar Opportunity, 2025-2035
  • Figure 19: East Asia Market Incremental Dollar Opportunity, 2025-2035
  • Figure 20: South Asia and Pacific Market Incremental Dollar Opportunity, 2025-2035
  • Figure 21: Middle East & Africa Market Incremental Dollar Opportunity, 2025-2035
  • Figure 22: North America Market Value Share and BPS Analysis by Country, 2025 and 2035
  • Figure 23: North America Market Value Share and BPS Analysis by Product , 2025 and 2035
  • Figure 24: North America Market Y-o-Y Growth Comparison by Product , 2025-2035
  • Figure 25: North America Market Attractiveness Analysis by Product
  • Figure 26: North America Market Value Share and BPS Analysis by Technologies, 2025 and 2035
  • Figure 27: North America Market Y-o-Y Growth Comparison by Technologies, 2025-2035
  • Figure 28: North America Market Attractiveness Analysis by Technologies
  • Figure 29: North America Market Value Share and BPS Analysis by End User, 2025 and 2035
  • Figure 30: North America Market Y-o-Y Growth Comparison by End User, 2025-2035
  • Figure 31: North America Market Attractiveness Analysis by End User
  • Figure 32: Latin America Market Value Share and BPS Analysis by Country, 2025 and 2035
  • Figure 33: Latin America Market Value Share and BPS Analysis by Product , 2025 and 2035
  • Figure 34: Latin America Market Y-o-Y Growth Comparison by Product , 2025-2035
  • Figure 35: Latin America Market Attractiveness Analysis by Product
  • Figure 36: Latin America Market Value Share and BPS Analysis by Technologies, 2025 and 2035
  • Figure 37: Latin America Market Y-o-Y Growth Comparison by Technologies, 2025-2035
  • Figure 38: Latin America Market Attractiveness Analysis by Technologies
  • Figure 39: Latin America Market Value Share and BPS Analysis by End User, 2025 and 2035
  • Figure 40: Latin America Market Y-o-Y Growth Comparison by End User, 2025-2035
  • Figure 41: Latin America Market Attractiveness Analysis by End User
  • Figure 42: Western Europe Market Value Share and BPS Analysis by Country, 2025 and 2035
  • Figure 43: Western Europe Market Value Share and BPS Analysis by Product , 2025 and 2035
  • Figure 44: Western Europe Market Y-o-Y Growth Comparison by Product , 2025-2035
  • Figure 45: Western Europe Market Attractiveness Analysis by Product
  • Figure 46: Western Europe Market Value Share and BPS Analysis by Technologies, 2025 and 2035
  • Figure 47: Western Europe Market Y-o-Y Growth Comparison by Technologies, 2025-2035
  • Figure 48: Western Europe Market Attractiveness Analysis by Technologies
  • Figure 49: Western Europe Market Value Share and BPS Analysis by End User, 2025 and 2035
  • Figure 50: Western Europe Market Y-o-Y Growth Comparison by End User, 2025-2035
  • Figure 51: Western Europe Market Attractiveness Analysis by End User
  • Figure 52: Eastern Europe Market Value Share and BPS Analysis by Country, 2025 and 2035
  • Figure 53: Eastern Europe Market Value Share and BPS Analysis by Product , 2025 and 2035
  • Figure 54: Eastern Europe Market Y-o-Y Growth Comparison by Product , 2025-2035
  • Figure 55: Eastern Europe Market Attractiveness Analysis by Product
  • Figure 56: Eastern Europe Market Value Share and BPS Analysis by Technologies, 2025 and 2035
  • Figure 57: Eastern Europe Market Y-o-Y Growth Comparison by Technologies, 2025-2035
  • Figure 58: Eastern Europe Market Attractiveness Analysis by Technologies
  • Figure 59: Eastern Europe Market Value Share and BPS Analysis by End User, 2025 and 2035
  • Figure 60: Eastern Europe Market Y-o-Y Growth Comparison by End User, 2025-2035
  • Figure 61: Eastern Europe Market Attractiveness Analysis by End User
  • Figure 62: East Asia Market Value Share and BPS Analysis by Country, 2025 and 2035
  • Figure 63: East Asia Market Value Share and BPS Analysis by Product , 2025 and 2035
  • Figure 64: East Asia Market Y-o-Y Growth Comparison by Product , 2025-2035
  • Figure 65: East Asia Market Attractiveness Analysis by Product
  • Figure 66: East Asia Market Value Share and BPS Analysis by Technologies, 2025 and 2035
  • Figure 67: East Asia Market Y-o-Y Growth Comparison by Technologies, 2025-2035
  • Figure 68: East Asia Market Attractiveness Analysis by Technologies
  • Figure 69: East Asia Market Value Share and BPS Analysis by End User, 2025 and 2035
  • Figure 70: East Asia Market Y-o-Y Growth Comparison by End User, 2025-2035
  • Figure 71: East Asia Market Attractiveness Analysis by End User
  • Figure 72: South Asia and Pacific Market Value Share and BPS Analysis by Country, 2025 and 2035
  • Figure 73: South Asia and Pacific Market Value Share and BPS Analysis by Product , 2025 and 2035
  • Figure 74: South Asia and Pacific Market Y-o-Y Growth Comparison by Product , 2025-2035
  • Figure 75: South Asia and Pacific Market Attractiveness Analysis by Product
  • Figure 76: South Asia and Pacific Market Value Share and BPS Analysis by Technologies, 2025 and 2035
  • Figure 77: South Asia and Pacific Market Y-o-Y Growth Comparison by Technologies, 2025-2035
  • Figure 78: South Asia and Pacific Market Attractiveness Analysis by Technologies
  • Figure 79: South Asia and Pacific Market Value Share and BPS Analysis by End User, 2025 and 2035
  • Figure 80: South Asia and Pacific Market Y-o-Y Growth Comparison by End User, 2025-2035
  • Figure 81: South Asia and Pacific Market Attractiveness Analysis by End User
  • Figure 82: Middle East & Africa Market Value Share and BPS Analysis by Country, 2025 and 2035
  • Figure 83: Middle East & Africa Market Value Share and BPS Analysis by Product , 2025 and 2035
  • Figure 84: Middle East & Africa Market Y-o-Y Growth Comparison by Product , 2025-2035
  • Figure 85: Middle East & Africa Market Attractiveness Analysis by Product
  • Figure 86: Middle East & Africa Market Value Share and BPS Analysis by Technologies, 2025 and 2035
  • Figure 87: Middle East & Africa Market Y-o-Y Growth Comparison by Technologies, 2025-2035
  • Figure 88: Middle East & Africa Market Attractiveness Analysis by Technologies
  • Figure 89: Middle East & Africa Market Value Share and BPS Analysis by End User, 2025 and 2035
  • Figure 90: Middle East & Africa Market Y-o-Y Growth Comparison by End User, 2025-2035
  • Figure 91: Middle East & Africa Market Attractiveness Analysis by End User
  • Figure 92: Global Market - Tier Structure Analysis
  • Figure 93: Global Market - Company Share Analysis
Dashboard
Dashboard
Dashboard
Dashboard
Dashboard
Dashboard

Full Research Suite comprises of:

Market outlook & trends analysis

Market outlook & trends analysis

Interviews & case studies

Interviews & case studies

Strategic recommendations

Strategic recommendations

Vendor profiles & capabilities analysis

Vendor profiles & capabilities analysis

5-year forecasts

5-year forecasts

8 regions and 60+ country-level data splits

8 regions and 60+ country-level data splits

Market segment data splits

Market segment data splits

12 months of continuous data updates

12 months of continuous data updates

DELIVERED AS:

PDF EXCEL ONLINE

Full Research Suite


$5000

$7500

$10000

Buy Report Now
Similar Industry Reports

Similar Industry Reports

Long-wear Glucose Sensors Market

Long-wear Glucose Sensors Market Size and Share Forecast and Outlook 2025 to 2035

Sensor Based Glucose Measuring Systems Market

Sensor Based Glucose Measuring Systems Market Size and Share Forecast Outlook 2025 to 2035

Glucose Oxidase Market

Glucose Oxidase Market Analysis – Trends & Forecast 2025-2035

Glucose-fructose Syrup Market

Glucose-Fructose Syrup Market – Growth, Demand & Food Industry Trends

Glucose Monitoring Device Market

Glucose Monitoring Device Market Overview – Growth, Trends & Forecast 2024-2034

Glucose Syrup Market

Glucose Syrup Market

OTC Glucose Monitors Market

OTC Glucose Monitors Market Size and Share Forecast Outlook 2025 to 2035

Blood Glucose Monitoring Devices Market

Blood Glucose Monitoring Devices Market Size and Share Forecast Outlook 2025 to 2035

Starch Glucose Syrup Market

Starch Glucose Syrup Market

Starches/Glucose Market

Starches/Glucose Market

Diacetone Glucose Market

Diacetone Glucose Market Size and Share Forecast Outlook 2025 to 2035

Demand for Glucose Monitoring Devices in EU

Demand for Glucose Monitoring Devices in EU Size and Share Forecast Outlook 2025 to 2035

Continuous Glucose Monitoring Device Market

Continuous Glucose Monitoring Device Market - Demand & Future Trends 2025 to 2035

Continuous Glucose Monitoring Systems Market

Continuous Glucose Monitoring Systems Market is segmented by transmitters and monitors, sensors and insulin pump from 2025 to 2035

Non-Invasive Blood Glucose Monitoring Devices Market

Non-Invasive Blood Glucose Monitoring Devices Market Size and Share Forecast Outlook 2025 to 2035

Network Point-of-Care Glucose Testing Market

Network Point-of-Care Glucose Testing Market Size and Share Forecast Outlook 2025 to 2035

Sensor Data Analytics Market

Sensor Data Analytics Market Size and Share Forecast Outlook 2025 to 2035

Sensor Testing Market

Sensor Testing Market Forecast Outlook 2025 to 2035

Sensor Fusion Market

Sensor Fusion Market Size and Share Forecast Outlook 2025 to 2035

Sensor Development Kit Market

Sensor Development Kit Market Size and Share Forecast Outlook 2025 to 2035

Future Market Insights

Glucose Sensor Market

Chat With MaRIA

Chat With

MaRIA

Hi There, I am MaRIA, Your Market Research Intelligence Assistant. How may I help you?