Reports

- Global Locations -

Headquarters

Future Market Insights, Inc.

Christiana Corporate, 200
Continental Drive, Suite 401,
Newark, Delaware - 19713,
United States

T: +1-845-579-5705

Americas

Future Market Insights, Inc.

616 Corporate Way, Suite 2-9018,
Valley Cottage, NY 10989, United States

T: +1-347-918-3531

MEA

Future Market Insights

1602-6 Jumeirah Bay X2 Tower, Plot No: JLT-PH2-X2A,
Jumeirah Lakes Towers, Dubai,
United Arab Emirates

Europe

Future Market Insights

3rd Floor, 207 Regent Street,
W1B 3HH London
United Kingdom

T: + 44 (0) 20 8123 9659
D: +44 (0) 20 3287 4268

Asia Pacific

Future Market Insights

IndiaLand Global Tech Park, Unit UG-1, Behind Grand HighStreet, Phase 1, Hinjawadi, MH, Pune – 411057, India

Continuous Glucose Monitoring Device Market Outlook (2023 to 2033)

Newly-released Continuous Glucose Monitoring Device Market industry analysis report by Future Market Insights reveals that global sales of Continuous Glucose Monitoring Device Market in 2022 was held at US$ 4.9 Billion. With a CAGR of 11.9% from 2023 to 2033, the market is projected to reach a US$ 16.8 billion valuation by 2033. The Sensor component is expected to be the highest revenue-generating segment, accounting for a CAGR of nearly 11.6% from 2023 to 2033.

Attribute Details
Global Continuous Glucose Monitoring Device Market (2023) US$ 5.5 Billion
Global Continuous Glucose Monitoring Device Market (2033) US$ 16.8 Billion
Global Continuous Glucose Monitoring Device Market CAGR (2023 to 2033) 11.9%
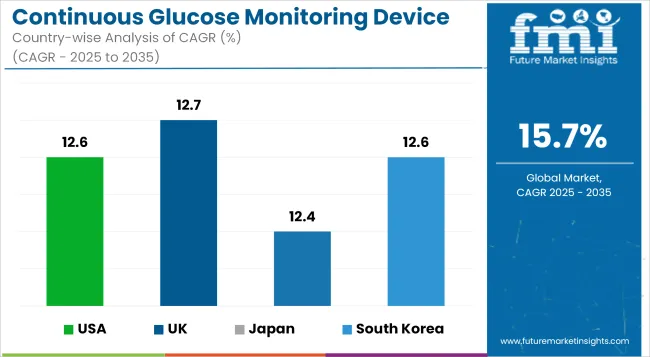
USA Continuous Glucose Monitoring Device Market CAGR (2023 to 2033) 12.5%
Key Companies Profiled
  • A. Menarini Diagnostics
  • Echo Therapeutics, Inc.
  • Abbott Laboratories
  • Bayer AG
  • Dexcom, Inc.
  • F. Hoffmann-La Roche Ltd.
  • GE Healthcare
  • GlySens Incorporated
  • Insulet Corporation
  • Johnson & Johnson
  • LifeScan
  • Medtronic plc
  • Medtrum Technologies, Inc.
  • Microchip Technology Inc.
  • Micron Technology Inc.
  • Nemaura Medical, Inc.
  • Novo Nordisk
  • NXP Semiconductors
  • Qualcomm
  • Roche Diagnostics
  • Senseonics Holdings, Inc.
  • STMicroelectronics
  • Tandem Diabetes Care?

Don't pay for what you don't need

Customize your report by selecting specific countries or regions and save 30%!

Revenue of Continuous Glucose Monitoring Device Market from 2018 to 2022 Compared to Demand Outlook for 2023 to 2033

As per the Continuous Glucose Monitoring Device Market industry research by Future Market Insights - a market research and competitive intelligence provider, historically, from 2018 to 2022, the market value increased at around 11.1% CAGR, wherein, countries such as the USA, UK, China, Japan and South Korea held a significant share in the global market.

The growth of the continuous blood glucose monitoring device market is being fuelled by rising diabetes awareness and the rising prevalence of diabetes among the population. By 2045, the International Diabetes Federation estimates that 700 million individuals worldwide would have diabetes.

Since obesity and the overweight population are the leading causes of diabetes, the worrisome growth in the number of overweight and obese people around the world is predicted to boost demand for continuous glucose monitoring devices.

According to the World Health Organization, over 1.9 billion people worldwide were overweight in 2016, with 650 million adults being obese. The expanding diabetic population is largely due to bad eating habits, a lack of sufficient nutrition, people's busy and demanding schedules, and a lack of physical activity. Furthermore, the growing senior population is a crucial factor driving the continuous glucose monitoring device market forward. High blood glucose levels and diabetes are common in the elderly population.

Which factors are accelerating the growth of the Continuous Glucose Monitoring Market?

A spike in the senior population, as well as a high prevalence of diabetes, are likely to drive market expansion. By 2040, the global diabetic population is predicted to reach 642 Million, according to the International Diabetes Federation.

As a result, by 2040, one out of every 10 persons is anticipated to have diabetes, demonstrating the seriousness of the pandemic. As a result, diabetes treatment and management are projected to be a top priority for healthcare administrations and stakeholders around the world.

Increased diabetes cases are predicted to drive market growth and opportunities for continuous glucose monitoring systems, which will attract and compel several market participants to produce innovative products or product line extensions.

Sabyasachi Ghosh
Sabyasachi Ghosh

Principal Consultant

Talk to Analyst

Find your sweet spots for generating winning opportunities in this market.

Why are continuous glucose monitoring devices are outperforming self-monitoring blood glucose devices?

According to the National Centre for Biotechnology Information, continuous glucose monitoring devices outperform self-monitoring blood glucose (SMBG) devices in clinical investigations including gestational diabetes mellitus. Furthermore, the advent of technologically improved gadgets for the control of diabetes mellitus will boost product acceptance even further.

Region-wise Analysis

Which Region is projected to offer the most promising opportunity for Continuous Glucose Monitoring Device Market?

During the forecast period, Asia Pacific is expected to be the most lucrative market. Asia Pacific has a large population characterized by increased diabetic awareness, increasing awareness of the availability of continuous glucose monitoring devices, and expanding consumer healthcare spending. Moreover, throughout the projection period, increased diagnostic lab penetration in the region is likely to boost demand for continuous glucose monitoring devices.

Due to favorable government policies, countries such as China, India, South Korea, and Indonesia are drawing FDIs in the healthcare sector, which is projected to drive the growth of the continuous glucose monitoring device market in the region.

The market for continuous glucose monitoring devices in Asia Pacific is likely to develop at a significant rate over the forecast period, owing to the rising prevalence of diabetes in the region, which is expected to drive the demand for these devices. Furthermore, the tendency is projected to be aided by expanding economies, rising healthcare expenditures, and the entry of major corporations.

Get the data you need at a Fraction of the cost

Personalize your report by choosing insights you need
and save 40%!

Country-wise Analysis

USA Continuous Glucose Monitoring Devices Market Analysis

Due to the rising number of diabetic patients in the region, North America is likely to dominate the global market throughout the forecast period. According to the Centres for Disease Control and Prevention, 34.2 million individuals in the United States, or 10.5% of the population, had diabetes in 2020. Furthermore, over the projection period, poor diet, rising obesity rates, and government measures are projected to have a beneficial impact on these continuous monitoring products.

USA Continuous Glucose Monitoring Devices Market Analysis

The market in the United kingdom is expected to reach a valuation of US$ 16.7 Billion by 2033. Growing with a CAGR of 11.9% in the forecast period, the market in the country is projected to garner an absolute dollar opportunity of US$ 11.2 Billion.

Japan Companion Animal Ear Infection Treatment Market Analysis

In Japan, the market is expected to grow at a CAGR of 10.6% from 2023 to 2033, reaching US$ 549 Million by 2033. The market in the country is expected to gross an absolute dollar opportunity of US$ 351 Million during the forecast period.

Category-wise Insights

Which product type is expected to grow the fastest?

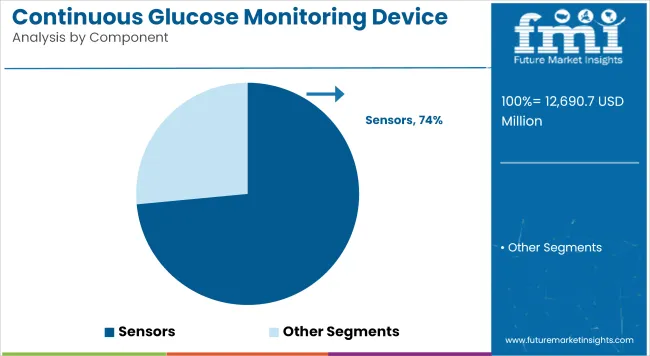
Continuous glucose monitoring devices are divided into three groups based on their components: sensors, transmitters, and receivers. In 2020, the sensors sector dominated the market, accounting for nearly 39% of total sales. From 2023 to 2033, the segment is predicted to grow at the fastest rate of 11.6%.

Sensors are the most advanced component of continuous glucose monitoring devices, consisting of a metallic filament that is injected into the fatty layer immediately beneath the skin and is thinner than a needle. The technology utilized in sensors differs slightly from that in transmitters and receivers. Glucose oxidase is used to monitor blood sugar levels in these components.

What are the insights about the End-Use of the Continuous Glucose Monitoring Device Market?

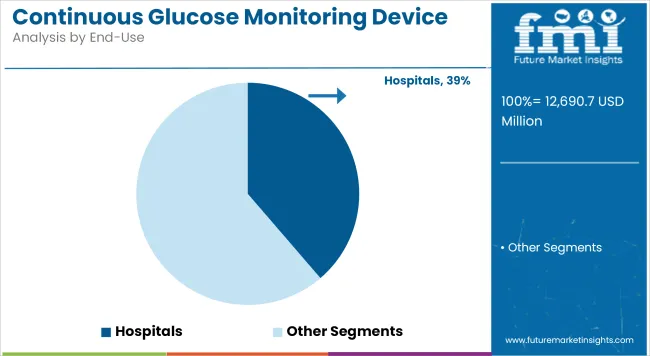
Due to increased knowledge, convenience, and ease of use, as well as rising disposable income, homecare diagnostics continues to be a market with significant opportunities. Furthermore, due to the risk of virus transmission in hospitals, COVID-19 has spurred demand for these devices in homecare diagnostics. The hospital category is predicted to grow at a high rate throughout the forecast period, owing to increased government investments in improving healthcare facilities in both developing and developed countries.

What was the Impact of Covid-19 on the Continuous Glucose Monitoring Device Market?

The surge in demand for Continuous glucose monitoring devices is due in part to companies' fast responses to the Covid-19 outbreak, but also to a greater awareness of the devices. The US Food and Drug Administration (FDA) has given Dexcom and Abbott permission to make their Continuous glucose monitoring devices available for use in hospitals and other healthcare facilities. The Dexcom G6 Continuous glucose monitoring devices have been provisionally approved for extended use in Canadian hospitals, according to Health Canada.

Competitive Analysis

The Continuous Glucose Monitoring Device Market is highly competitive, with a handful of companies holding a significant share. The key players in the market include A. Menarini Diagnostics, Echo Therapeutics, Inc., Abbott Laboratories, Bayer AG, Dexcom, Inc., F. Hoffmann-La Roche Ltd., GE Healthcare, GlySens Incorporated, Insulet Corporation, Johnson & Johnson, LifeScan, Medtronic plc, Medtrum Technologies, Inc., Microchip Technology Inc., Micron Technology Inc., Nemaura Medical, Inc., Novo Nordisk, NXP Semiconductors, Qualcomm, Roche Diagnostics, Senseonics Holdings, Inc., STMicroelectronics, and Tandem Diabetes Care.

Some of the recent developments of key players in the Continuous Glucose Monitoring Device Market are as follows:

  • In June 2020, Menarini Diagnostics released GlucoMen Day CGM, a unique digital patch that monitors blood glucose and displays findings immediately on a smartphone. It may be worn for fourteen days continuously.
  • In February 2020, for seamless diabetes management, Abbott and Insulet collaborated to integrate next-generation glucose sensors and automated insulin delivery technology. The continuous glucose monitoring (CGM) technology of Abbott will be combined with Insulet's OMillionipod Horizon Automated Insulin Delivery System to create an accurate, user-friendly, and integrated digital health platform. ?
  • In January 2020, Tandem Diabetes Care announced the launch of the t:slim X2 Insulin Pump with Control-IQ Technology. Dexcom G6 continuous glucose monitoring is built into the system.

Similarly, recent developments related to companies offering Continuous Glucose Monitoring Device Market have been tracked by the team at Future Market Insights, which are available in the full report.

Market Segments Covered in Continuous Glucose Monitoring Device Industry Analysis

By Component:

  • Transmitters
  • Sensors
  • Receivers

By End-Use:

  • Hospitals
  • Home Care
  • Other End-uses

By Region:

  • North America
    • USA
    • Canada
    • Mexico
    • Rest of North America
  • Europe
    • Germany
    • Spain
    • United kingdom
    • Italy
    • France
    • Netherlands
    • Belgium
    • Austria
    • Russia
    • Rest of Europe
  • Asia Pacific
    • Japan
    • China
    • India
    • South Korea
    • Singapore
    • Malaysia
    • Indonesia
    • Thailand
    • Philippines
    • Rest of Asia Pacific
  • Latin America
    • Brazil
    • Argentina
    • Rest of Latin America
  • MEA
    • South Africa
    • Saudi Arabia
    • Israel
    • Rest of MEA

Frequently Asked Questions

What is the Continuous Glucose Monitoring Device Market value in 2023?

The market is valued at US$ 5.5 billion in 2023.

What is the CAGR from 2023 to 2033?

The market growth rate from 2023 to 2033 is expected to be 11.9%.

Who are the Key Market Players?

Abbott Laboratories, Bayer AG, and Dexcom, Inc. are key market players.

What Opportunities Await the Market Players?

Increasing prevalence of diabetes to boost the market prospects.

How was the Historical Performance of the Market?

From 2018 to 2022, the market registered a CAGR of 11.1%.

Table of Content

1. Executive Summary | Continuous Glucose Monitoring Device Market 

        1.1. Global Market Outlook

        1.2. Summary of Statistics

        1.3. Key Market Characteristics & Attributes

        1.4. Analysis and Recommendations

2. Market Overview

        2.1. Market Coverage / Taxonomy

        2.2. Market Definition / Scope / Limitations

3. Market Risks and Trends Assessment

        3.1. Risk Assessment

            3.1.1. COVID-19 Crisis and Impact on Demand

            3.1.2. COVID-19 Impact Benchmark with Previous Crisis

            3.1.3. Impact on Market Value (US$ Billion)

            3.1.4. Assessment by Key Countries

            3.1.5. Assessment by Key Market Segments

            3.1.6. Action Points and Recommendation for Suppliers

        3.2. Key Trends Impacting the Market

        3.3. Formulation and Product Development Trends

4. Market Background and Foundation Data Points

        4.1. Global Market (US$ Billion)

        4.2. Market Opportunity Assessment (US$ Billion)

            4.2.1. Total Available Market

            4.2.2. Serviceable Addressable Market

            4.2.3. Serviceable Obtainable Market

        4.3. Market Scenario Forecast

            4.3.1. Demand in optimistic Scenario

            4.3.2. Demand in Likely Scenario

            4.3.3. Demand in Conservative Scenario

        4.4. Investment Feasibility Analysis

            4.4.1. Investment in Established Markets

                4.4.1.1. In Short Term

                4.4.1.2. In Long Term

            4.4.2. Investment in Emerging Markets

                4.4.2.1. In Short Term

                4.4.2.2. In Long Term

        4.5. Forecast Factors - Relevance & Impact

            4.5.1. Top Companies Historical Growth

            4.5.2. Global Market Growth

            4.5.3. Adoption Rate, By Country

        4.6. Market Dynamics

            4.6.1. Market Driving Factors and Impact Assessment

            4.6.2. Prominent Market Challenges and Impact Assessment

            4.6.3. Market Opportunities

            4.6.4. Prominent Trends in the Global Market & Their Impact Assessment

5. Key Success Factors

        5.1. Manufacturers’ Focus on Low Penetration High Growth Markets

        5.2. Banking on with Segments High Incremental Opportunity

        5.3. Peer Benchmarking

6. Global Market Demand Analysis 2018 to 2022 and Forecast, 2023 to 2033

        6.1. Historical Market Analysis, 2018 to 2022

        6.2. Current and Future Market Projections, 2023 to 2033

        6.3. Y-o-Y Growth Trend Analysis

7. Global Market Value Analysis 2018 to 2022 and Forecast, 2023 to 2033

        7.1. Historical Market Value (US$ Billion) Analysis, 2018 to 2022

        7.2. Current and Future Market Value (US$ Billion) Projections, 2023 to 2033

            7.2.1. Y-o-Y Growth Trend Analysis

            7.2.2. Absolute $ Opportunity Analysis

8. Global Market Analysis 2018 to 2022 and Forecast 2023 to 2033, By Component

        8.1. Introduction / Key Findings

        8.2. Historical Market Size (US$ Billion) Analysis By Component, 2018 to 2022

        8.3. Current and Future Market Size (US$ Billion) Analysis and Forecast By Component, 2023 to 2033

            8.3.1. Transmitters

            8.3.2. Sensors

            8.3.3. Recievers

        8.4. Market Attractiveness Analysis By Component

9. Global Market Analysis 2018 to 2022 and Forecast 2023 to 2033, By End-use

        9.1. Introduction / Key Findings

        9.2. Historical Market Size (US$ Billion) Analysis By End-use, 2018 to 2022

        9.3. Current and Future Market Size (US$ Billion) Analysis and Forecast By End-use, 2023 to 2033

            9.3.1. Hospitals

            9.3.2. Home care

            9.3.3. Other end-uses

        9.4. Market Attractiveness Analysis By End-use

10. Global Market Analysis 2018 to 2022 and Forecast 2023 to 2033, By Region

        10.1. Introduction

        10.2. Historical Market Size (US$ Billion) Analysis By Region, 2018 to 2022

        10.3. Current Market Size (US$ Billion) & Analysis and Forecast By Region, 2023 to 2033

            10.3.1. North America

            10.3.2. Latin America

            10.3.3. Europe

            10.3.4. Asia Pacific

            10.3.5. Middle East and Africa (MEA)

        10.4. Market Attractiveness Analysis By Region

11. North America Market Analysis 2018 to 2022 and Forecast 2023 to 2033

        11.1. Introduction

        11.2. Pricing Analysis

        11.3. Historical Market Value (US$ Billion) Trend Analysis By Market Taxonomy, 2018 to 2022

        11.4. Market Value (US$ Billion) & Forecast By Market Taxonomy, 2023 to 2033

            11.4.1. By Country

                11.4.1.1. USA

                11.4.1.2. Canada

                11.4.1.3. Rest of North America

            11.4.2. By Component

            11.4.3. By End-use

        11.5. Market Attractiveness Analysis

            11.5.1. By Country

            11.5.2. By Component

            11.5.3. By End-use

12. Latin America Market Analysis 2018 to 2022 and Forecast 2023 to 2033

        12.1. Introduction

        12.2. Pricing Analysis

        12.3. Historical Market Value (US$ Billion) Trend Analysis By Market Taxonomy, 2018 to 2022

        12.4. Market Value (US$ Billion) & Forecast By Market Taxonomy, 2023 to 2033

            12.4.1. By Country

                12.4.1.1. Brazil

                12.4.1.2. Argentina

                12.4.1.3. Rest of Latin America

            12.4.2. By Component

            12.4.3. By End-use

        12.5. Market Attractiveness Analysis

            12.5.1. By Country

            12.5.2. By Component

            12.5.3. By End-use

13. Europe Market Analysis 2018 to 2022 and Forecast 2023 to 2033

        13.1. Introduction

        13.2. Pricing Analysis

        13.3. Historical Market Value (US$ Billion) Trend Analysis By Market Taxonomy, 2018 to 2022

        13.4. Market Value (US$ Billion) & Forecast By Market Taxonomy, 2023 to 2033

            13.4.1. By Country

                13.4.1.1. Germany

                13.4.1.2. France

                13.4.1.3. United kingdom

                13.4.1.4. Italy

                13.4.1.5. Spain

                13.4.1.6. Netherlands

                13.4.1.7. Rest of Europe

            13.4.2. By Component

            13.4.3. By End-use

        13.5. Market Attractiveness Analysis

            13.5.1. By Country

            13.5.2. By Component

            13.5.3. By End-use

14. Asia Pacific Market Analysis 2018 to 2022 and Forecast 2023 to 2033

        14.1. Introduction

        14.2. Pricing Analysis

        14.3. Historical Market Value (US$ Billion) Trend Analysis By Market Taxonomy, 2018 to 2022

        14.4. Market Value (US$ Billion) & Forecast By Market Taxonomy, 2023 to 2033

            14.4.1. By Country

                14.4.1.1. China

                14.4.1.2. Japan

                14.4.1.3. South Korea

                14.4.1.4. Rest of Asia Pacific

            14.4.2. By Component

            14.4.3. By End-use

        14.5. Market Attractiveness Analysis

            14.5.1. By Country

            14.5.2. By Component

            14.5.3. By End-use

15. Middle East and Africa Market Analysis 2018 to 2022 and Forecast 2023 to 2033

        15.1. Introduction

        15.2. Pricing Analysis

        15.3. Historical Market Value (US$ Billion) Trend Analysis By Market Taxonomy, 2018 to 2022

        15.4. Market Value (US$ Billion) & Forecast By Market Taxonomy, 2023 to 2033

            15.4.1. By Country

                15.4.1.1. Saudi Arabia

                15.4.1.2. South Africa

                15.4.1.3. UAE

                15.4.1.4. Rest of Middle East and Africa

            15.4.2. By Component

            15.4.3. By End-use

        15.5. Market Attractiveness Analysis

            15.5.1. By Country

            15.5.2. By Component

            15.5.3. By End-use

16. Key Countries Market Analysis 2018 to 2022 and Forecast 2023 to 2033

        16.1. Introduction

            16.1.1. Market Value Proportion Analysis, By Key Countries

            16.1.2. Global Vs. Country Growth Comparison

        16.2. US Market Analysis

            16.2.1. Value Proportion Analysis by Market Taxonomy

            16.2.2. Value & Analysis and Forecast by Market Taxonomy, 2018-2033

                16.2.2.1. By Component

                16.2.2.2. By End-use

        16.3. Canada Market Analysis

            16.3.1. Value Proportion Analysis by Market Taxonomy

            16.3.2. Value & Analysis and Forecast by Market Taxonomy, 2018-2033

                16.3.2.1. By Component

                16.3.2.2. By End-use

        16.4. Argentina Market Analysis

            16.4.1. Value Proportion Analysis by Market Taxonomy

            16.4.2. Value & Analysis and Forecast by Market Taxonomy, 2018-2033

                16.4.2.1. By Component

                16.4.2.2. By End-use

        16.5. Brazil Market Analysis

            16.5.1. Value Proportion Analysis by Market Taxonomy

            16.5.2. Value & Analysis and Forecast by Market Taxonomy, 2018-2033

                16.5.2.1. By Component

                16.5.2.2. By End-use

        16.6. Germany Market Analysis

            16.6.1. Value Proportion Analysis by Market Taxonomy

            16.6.2. Value & Analysis and Forecast by Market Taxonomy, 2018-2033

                16.6.2.1. By Component

                16.6.2.2. By End-use

        16.7. France Market Analysis

            16.7.1. Value Proportion Analysis by Market Taxonomy

            16.7.2. Value & Analysis and Forecast by Market Taxonomy, 2018-2033

                16.7.2.1. By Component

                16.7.2.2. By End-use

        16.8. Italy Market Analysis

            16.8.1. Value Proportion Analysis by Market Taxonomy

            16.8.2. Value & Analysis and Forecast by Market Taxonomy, 2018-2033

                16.8.2.1. By Component

                16.8.2.2. By End-use

        16.9. Spain Market Analysis

            16.9.1. Value Proportion Analysis by Market Taxonomy

            16.9.2. Value & Analysis and Forecast by Market Taxonomy, 2018-2033

                16.9.2.1. By Component

                16.9.2.2. By End-use

        16.10. UK Market Analysis

            16.10.1. Value Proportion Analysis by Market Taxonomy

            16.10.2. Value & Analysis and Forecast by Market Taxonomy, 2018-2033

                16.10.2.1. By Component

                16.10.2.2. By End-use

        16.11. Netherlands Market Analysis

            16.11.1. Value Proportion Analysis by Market Taxonomy

            16.11.2. Value & Analysis and Forecast by Market Taxonomy, 2018-2033

                16.11.2.1. By Component

                16.11.2.2. By End-use

        16.12. China Market Analysis

            16.12.1. Value Proportion Analysis by Market Taxonomy

            16.12.2. Value & Analysis and Forecast by Market Taxonomy, 2018-2033

                16.12.2.1. By Component

                16.12.2.2. By End-use

        16.13. Japan Market Analysis

            16.13.1. Value Proportion Analysis by Market Taxonomy

            16.13.2. Value & Analysis and Forecast by Market Taxonomy, 2018-2033

                16.13.2.1. By Component

                16.13.2.2. By End-use

        16.14. South Korea Market Analysis

            16.14.1. Value Proportion Analysis by Market Taxonomy

            16.14.2. Value & Analysis and Forecast by Market Taxonomy, 2018-2033

                16.14.2.1. By Component

                16.14.2.2. By End-use

        16.15. Saudi Arabia Market Analysis

            16.15.1. Value Proportion Analysis by Market Taxonomy

            16.15.2. Value & Analysis and Forecast by Market Taxonomy, 2018-2033

                16.15.2.1. By Component

                16.15.2.2. By End-use

        16.16. South Africa Market Analysis

            16.16.1. Value Proportion Analysis by Market Taxonomy

            16.16.2. Value & Analysis and Forecast by Market Taxonomy, 2018-2033

                16.16.2.1. By Component

                16.16.2.2. By End-use

        16.17. UAE Market Analysis

            16.17.1. Value Proportion Analysis by Market Taxonomy

            16.17.2. Value & Analysis and Forecast by Market Taxonomy, 2018-2033

                16.17.2.1. By Component

                16.17.2.2. By End-use

            16.17.3. Competition Landscape and Player Concentration in the Country

17. Market Structure Analysis

        17.1. Market Analysis by Tier of Companies

        17.2. Market Concentration

        17.3. Market Share Analysis of Top Players

        17.4. Market Presence Analysis

            17.4.1. By Regional footprint of Players

            17.4.2. Product footprint by Players

18. Competition Analysis

        18.1. Competition Dashboard

        18.2. Competition Benchmarking

        18.3. Competition Deep Dive

            18.3.1. A. Menarini Diagnostics

                18.3.1.1. Overview

                18.3.1.2. Product Portfolio

                18.3.1.3. Sales Footprint

                18.3.1.4. Strategy Overview

            18.3.2. Echo Therapeutics, Inc.

                18.3.2.1. Overview

                18.3.2.2. Product Portfolio

                18.3.2.3. Sales Footprint

                18.3.2.4. Strategy Overview

            18.3.3. Abbott Laboratories

                18.3.3.1. Overview

                18.3.3.2. Product Portfolio

                18.3.3.3. Sales Footprint

                18.3.3.4. Strategy Overview

            18.3.4. Bayer AG

                18.3.4.1. Overview

                18.3.4.2. Product Portfolio

                18.3.4.3. Sales Footprint

                18.3.4.4. Strategy Overview

            18.3.5. Dexcom, Inc.

                18.3.5.1. Overview

                18.3.5.2. Product Portfolio

                18.3.5.3. Sales Footprint

                18.3.5.4. Strategy Overview

            18.3.6. F. Hoffmann-La Roche Ltd.

                18.3.6.1. Overview

                18.3.6.2. Product Portfolio

                18.3.6.3. Sales Footprint

                18.3.6.4. Strategy Overview

            18.3.7. GE Healthcare

                18.3.7.1. Overview

                18.3.7.2. Product Portfolio

                18.3.7.3. Sales Footprint

                18.3.7.4. Strategy Overview

            18.3.8. Glycens

                18.3.8.1. Overview

                18.3.8.2. Product Portfolio

                18.3.8.3. Sales Footprint

                18.3.8.4. Strategy Overview

            18.3.9. Insulet Corporation

                18.3.9.1. Overview

                18.3.9.2. Product Portfolio

                18.3.9.3. Sales Footprint

                18.3.9.4. Strategy Overview

            18.3.10. Johnson & Johnson

                18.3.10.1. Overview

                18.3.10.2. Product Portfolio

                18.3.10.3. Sales Footprint

                18.3.10.4. Strategy Overview

            18.3.11. LifeScan

                18.3.11.1. Overview

                18.3.11.2. Product Portfolio

                18.3.11.3. Sales Footprint

                18.3.11.4. Strategy Overview

            18.3.12. Medtronic plc

                18.3.12.1. Overview

                18.3.12.2. Product Portfolio

                18.3.12.3. Sales Footprint

                18.3.12.4. Strategy Overview

            18.3.13. Medtrum Technologies, Inc.

                18.3.13.1. Overview

                18.3.13.2. Product Portfolio

                18.3.13.3. Sales Footprint

                18.3.13.4. Strategy Overview

            18.3.14. Microchip Technology Inc.

                18.3.14.1. Overview

                18.3.14.2. Product Portfolio

                18.3.14.3. Sales Footprint

                18.3.14.4. Strategy Overview

            18.3.15. Micron Technology Inc.

                18.3.15.1. Overview

                18.3.15.2. Product Portfolio

                18.3.15.3. Sales Footprint

                18.3.15.4. Strategy Overview

            18.3.16. Nemaura Medical, Inc.

                18.3.16.1. Overview

                18.3.16.2. Product Portfolio

                18.3.16.3. Sales Footprint

                18.3.16.4. Strategy Overview

            18.3.17. Novo Nordisk

                18.3.17.1. Overview

                18.3.17.2. Product Portfolio

                18.3.17.3. Sales Footprint

                18.3.17.4. Strategy Overview

            18.3.18. NXP Semiconductors

                18.3.18.1. Overview

                18.3.18.2. Product Portfolio

                18.3.18.3. Sales Footprint

                18.3.18.4. Strategy Overview

            18.3.19. Qualcomm

                18.3.19.1. Overview

                18.3.19.2. Product Portfolio

                18.3.19.3. Sales Footprint

                18.3.19.4. Strategy Overview

            18.3.20. Roche Diagnostics

                18.3.20.1. Overview

                18.3.20.2. Product Portfolio

                18.3.20.3. Sales Footprint

                18.3.20.4. Strategy Overview

            18.3.21. Senseonics Holdings, Inc.

                18.3.21.1. Overview

                18.3.21.2. Product Portfolio

                18.3.21.3. Sales Footprint

                18.3.21.4. Strategy Overview

            18.3.22. STMicroelectronics

                18.3.22.1. Overview

                18.3.22.2. Product Portfolio

                18.3.22.3. Sales Footprint

                18.3.22.4. Strategy Overview

            18.3.23. Tandem Diabetes Care

                18.3.23.1. Overview

                18.3.23.2. Product Portfolio

                18.3.23.3. Sales Footprint

                18.3.23.4. Strategy Overview

19. Assumptions and Acronyms Used

20. Research Methodology

List of Tables

Table 1: Global Market Value (US$ Billion), By Component, 2018 to 2022

Table 2: Global Market Value (US$ Billion), By Component, 2023 to 2033

Table 3: Global Market Value (US$ Billion), By End-use, 2018 to 2022

Table 4: Global Market Value (US$ Billion), By End-use, 2023 to 2033

Table 5: Global Market, By Region, 2018 to 2022

Table 6: Global Market, By Region, 2023 to 2033

Table 7: North America Market Value (US$ Billion), By Component, 2018 to 2022

Table 8: North America Market Value (US$ Billion), By Component, 2023 to 2033

Table 9: North America Market Value (US$ Billion), By End-use, 2018 to 2022

Table 10: North America Market Value (US$ Billion), By End-use, 2023 to 2033

Table 11: North America Market, By Country, 2018 to 2022

Table 12: North America Market, By Country, 2023 to 2033

Table 13: Latin America Market Value (US$ Billion), By Component, 2018 to 2022

Table 14: Latin America Market Value (US$ Billion), By Component, 2023 to 2033

Table 15: Latin America Market Value (US$ Billion), By End-use, 2018 to 2022

Table 16: Latin America Market Value (US$ Billion), By End-use, 2023 to 2033

Table 17: Latin America Market, By Country, 2018 to 2022

Table 18: Latin America Market, By Country, 2023 to 2033

Table 19: Europe Market Value (US$ Billion), By Component, 2018 to 2022

Table 20: Europe Market Value (US$ Billion), By Component, 2023 to 2033

Table 21: Europe Market Value (US$ Billion), By End-use, 2018 to 2022

Table 22: Europe Market Value (US$ Billion), By End-use, 2023 to 2033

Table 23: Europe Market, By Country, 2018 to 2022

Table 24: Europe Market, By Country, 2023 to 2033

Table 25: Asia Pacific Market Value (US$ Billion), By Component, 2018 to 2022

Table 26: Asia Pacific Market Value (US$ Billion), By Component, 2023 to 2033

Table 27: Asia Pacific Market Value (US$ Billion), By End-use, 2018 to 2022

Table 28: Asia Pacific Market Value (US$ Billion), By End-use, 2023 to 2033

Table 29: Asia Pacific Market, By Country, 2018 to 2022

Table 30: Asia Pacific Market, By Country, 2023 to 2033

Table 31: MEA Market Value (US$ Billion), By Component, 2018 to 2022

Table 32: MEA Market Value (US$ Billion), By Component, 2023 to 2033

Table 33: MEA Market Value (US$ Billion), By End-use, 2018 to 2022

Table 34: MEA Market Value (US$ Billion), By End-use, 2023 to 2033

Table 35: MEA Market, By Country, 2018 to 2022

Table 36: MEA Market, By Country, 2023 to 2033

Table 37: Global Market Incremental $ Opportunity, By Component, 2018 to 2022

Table 38: Global Market Incremental $ Opportunity, By End-use, 2023 to 2033

Table 39: Global Market Incremental $ Opportunity, By Region, 2023 to 2033

Table 40: North America Market Incremental $ Opportunity, By Component, 2018 to 2022

Table 41: North America Market Incremental $ Opportunity, By End-use, 2023 to 2033

Table 42: North America Market Incremental $ Opportunity, By Country, 2023 to 2033

Table 43: Latin America Market Incremental $ Opportunity, By Component, 2018 to 2022

Table 44: Latin America Market Incremental $ Opportunity, By End-use, 2023 to 2033

Table 45: Latin America Market Incremental $ Opportunity, By Country, 2023 to 2033

Table 46: Europe Market Incremental $ Opportunity, By Component, 2018 to 2022

Table 47: Europe Market Incremental $ Opportunity, By End-use, 2023 to 2033

Table 48: Europe Market Incremental $ Opportunity, By Country, 2023 to 2033

Table 49: Asia Pacific Market Incremental $ Opportunity, By Component, 2018 to 2022

Table 50: Asia Pacific Market Incremental $ Opportunity, By End-use, 2023 to 2033

Table 51: Asia Pacific Market Incremental $ Opportunity, By Country, 2023 to 2033

Table 52: MEA Market Incremental $ Opportunity, By Component, 2018 to 2022

Table 53: MEA Market Incremental $ Opportunity, By End-use, 2023 to 2033

Table 54: MEA Market Incremental $ Opportunity, By Country, 2023 to 2033

List of Charts

Figure 1: Global Market Value (US$ Billion) and Year-on-Year Growth, 2018 to 2033

Figure 2: Global Market Absolute $ Historical Gain (2018 to 2022) and Opportunity (2023 to 2033), US$ Billion

Figure 3: Global Market Share, By Component, 2023 & 2033

Figure 4: Global Market Y-o-Y Growth Projections, By Component – 2023 to 2033

Figure 5: Global Market Attractiveness Index, By Component – 2023 to 2033

Figure 6: Global Market Share, By End-use, 2023 & 2033

Figure 7: Global Market Y-o-Y Growth Projections, By End-use – 2023 to 2033

Figure 8: Global Market Attractiveness Index, By End-use – 2023 to 2033

Figure 9: Global Market Share, By Region, 2023 & 2033

Figure 10: Global Market Y-o-Y Growth Projections, By Region – 2023 to 2033

Figure 11: Global Market Attractiveness Index, By Region – 2023 to 2033

Figure 12: North America Market Value (US$ Billion) and Year-on-Year Growth, 2018 to 2033

Figure 13: North America Market Absolute $ Opportunity Historical (2018 to 2022) and Forecast Period (2023 to 2033), US$ Billion

Figure 14: North America Market Share, By Component, 2023 & 2033

Figure 15: North America Market Y-o-Y Growth Projections, By Component – 2023 to 2033

Figure 16: North America Market Attractiveness Index, By Component – 2023 to 2033

Figure 17: North America Market Share, By End-use, 2023 & 2033

Figure 18: North America Market Y-o-Y Growth Projections, By End-use – 2023 to 2033

Figure 19: North America Market Attractiveness Index, By End-use – 2023 to 2033

Figure 20: North America Market Share, By Country, 2023 & 2033

Figure 21: North America Market Y-o-Y Growth Projections, By Country – 2023 to 2033

Figure 22: North America Market Attractiveness Index, By Country – 2023 to 2033

Figure 23: Latin America Market Value (US$ Billion) and Year-on-Year Growth, 2018 to 2033

Figure 24: Latin America Market Absolute $ Opportunity Historical (2018 to 2022) and Forecast Period (2023 to 2033), US$ Billion

Figure 25: Latin America Market Share, By Component, 2023 & 2033

Figure 26: Latin America Market Y-o-Y Growth Projections, By Component – 2023 to 2033

Figure 27: Latin America Market Attractiveness Index, By Component – 2023 to 2033

Figure 28: Latin America Market Share, By End-use, 2023 & 2033

Figure 29: Latin America Market Y-o-Y Growth Projections, By End-use – 2023 to 2033

Figure 30: Latin America Market Attractiveness Index, By End-use – 2023 to 2033

Figure 31: Latin America Market Share, By Country, 2023 & 2033

Figure 32: Latin America Market Y-o-Y Growth Projections, By Country – 2023 to 2033

Figure 33: Latin America Market Attractiveness Index, By Country – 2023 to 2033

Figure 34: Europe Market Value (US$ Billion) and Year-on-Year Growth, 2018 to 2033

Figure 35: Europe Market Absolute $ Opportunity Historical (2018 to 2022) and Forecast Period (2023 to 2033), US$ Billion

Figure 36: Europe Market Share, By Component, 2023 & 2033

Figure 37: Europe Market Y-o-Y Growth Projections, By Component – 2023 to 2033

Figure 38: Europe Market Attractiveness Index, By Component – 2023 to 2033

Figure 39: Europe Market Share, By End-use, 2023 & 2033

Figure 40: Europe Market Y-o-Y Growth Projections, By End-use – 2023 to 2033

Figure 41: Europe Market Attractiveness Index, By End-use – 2023 to 2033

Figure 42: Europe Market Share, By Country, 2023 & 2033

Figure 43: Europe Market Y-o-Y Growth Projections, By Country – 2023 to 2033

Figure 44: Europe Market Attractiveness Index, By Country – 2023 to 2033

Figure 45: MEA Market Value (US$ Billion) and Year-on-Year Growth, 2018 to 2033

Figure 46: MEA Market Absolute $ Opportunity Historical (2018 to 2022) and Forecast Period (2023 to 2033), US$ Billion

Figure 47: MEA Market Share, By Component, 2023 & 2033

Figure 48: MEA Market Y-o-Y Growth Projections, By Component – 2023 to 2033

Figure 49: MEA Market Attractiveness Index, By Component – 2023 to 2033

Figure 50: MEA Market Share, By End-use, 2023 & 2033

Figure 51: MEA Market Y-o-Y Growth Projections, By End-use – 2023 to 2033

Figure 52: MEA Market Attractiveness Index, By End-use – 2023 to 2033

Figure 53: MEA Market Share, By Country, 2023 & 2033

Figure 54: MEA Market Y-o-Y Growth Projections, By Country – 2023 to 2033

Figure 55: MEA Market Attractiveness Index, By Country – 2023 to 2033

Figure 56: Asia Pacific Market Value (US$ Billion) and Year-on-Year Growth, 2018 to 2033

Figure 57: Asia Pacific Market Absolute $ Opportunity Historical (2018 to 2022) and Forecast Period (2023 to 2033), US$ Billion

Figure 58: Asia Pacific Market Share, By Component, 2023 & 2033

Figure 59: Asia Pacific Market Y-o-Y Growth Projections, By Component – 2023 to 2033

Figure 60: Asia Pacific Market Attractiveness Index, By Component – 2023 to 2033

Figure 61: Asia Pacific Market Share, By End-use, 2023 & 2033

Figure 62: Asia Pacific Market Y-o-Y Growth Projections, By End-use – 2023 to 2033

Figure 63: Asia Pacific Market Attractiveness Index, By End-use – 2023 to 2033

Figure 64: Asia Pacific Market Share, By Country, 2023 & 2033

Figure 65: Asia Pacific Market Y-o-Y Growth Projections, By Country – 2023 to 2033

Figure 66: Asia Pacific Market Attractiveness Index, By Country – 2023 to 2033

Figure 67: US Market Value (US$ Billion) and Forecast, 2023 to 2033

Figure 68: US Market Share, By Component, 2022

Figure 69: US Market Share, By End-use, 2022

Figure 70: Canada Market Value (US$ Billion) and Forecast, 2023 to 2033

Figure 71: Canada Market Share, By Component, 2022

Figure 72: Canada Market Share, By End-use, 2022

Figure 73: Brazil Market Value (US$ Billion) and Forecast, 2023 to 2033

Figure 74: Brazil Market Share, By Component, 2022

Figure 75: Brazil Market Share, By End-use, 2022

Figure 76: Argentina Market Value (US$ Billion) and Forecast, 2023 to 2033

Figure 77: Argentina Market Share, By Component, 2022

Figure 78: Argentina Market Share, By End-use, 2022

Figure 79: Germany Market Value (US$ Billion) and Forecast, 2023 to 2033

Figure 80: Germany Market Share, By Component, 2022

Figure 81: Germany Market Share, By End-use, 2022

Figure 82: United kingdom Market Value (US$ Billion) and Forecast, 2023 to 2033

Figure 83: United kingdom Market Share, By Component, 2022

Figure 84: United kingdom Market Share, By End-use, 2022

Figure 85: France Market Value (US$ Billion) and Forecast, 2023 to 2033

Figure 86: France Market Share, By Component, 2022

Figure 87: France Market Share, By End-use, 2022

Figure 88: Italy Market Value (US$ Billion) and Forecast, 2023 to 2033

Figure 89: Italy Market Share, By Component, 2022

Figure 90: Italy Market Share, By End-use, 2022

Figure 91: Spain Market Value (US$ Billion) and Forecast, 2023 to 2033

Figure 92: Spain Market Share, By Component, 2022

Figure 93: Spain Market Share, By End-use, 2022

Figure 94: Netherlands Market Value (US$ Billion) and Forecast, 2023 to 2033

Figure 95: Netherlands Market Share, By Component, 2022

Figure 96: Netherlands Market Share, By End-use, 2022

Figure 97: China Market Value (US$ Billion) and Forecast, 2023 to 2033

Figure 98: China Market Share, By Component, 2022

Figure 99: China Market Share, By End-use, 2022

Figure 100: Japan Market Value (US$ Billion) and Forecast, 2023 to 2033

Figure 101: Japan Market Share, By Component, 2022

Figure 102: Japan Market Share, By End-use, 2022

Figure 103: South Korea Market Value (US$ Billion) and Forecast, 2023 to 2033

Figure 104: South Korea Market Share, By Component, 2022

Figure 105: South Korea Market Share, By End-use, 2022

Figure 106: Saudi Arabia Market Value (US$ Billion) and Forecast, 2023 to 2033

Figure 107: Saudi Arabia Market Share, By Component, 2022

Figure 108: Saudi Arabia Market Share, By End-use, 2022

Figure 109: South Africa Market Value (US$ Billion) and Forecast, 2023 to 2033

Figure 110: South Africa Market Share, By Component, 2022

Figure 111: South Africa Market Share, By End-use, 2022

Figure 112: UAE Market Value (US$ Billion) and Forecast, 2023 to 2033

Figure 113: UAE Market Share, By Component, 2022

Figure 114: UAE Market Share, By End-use, 2022

Explore Healthcare Insights

View Reports

Continuous Glucose Monitoring Device Market