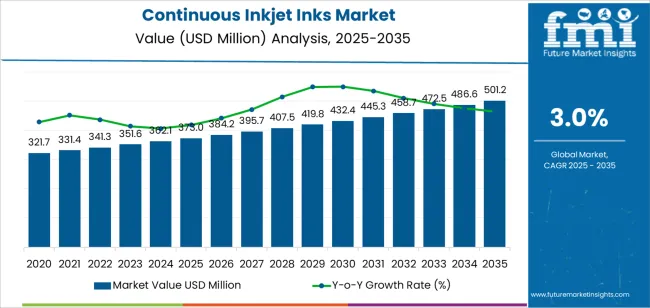
The Continuous Inkjet Inks Market is estimated to be valued at USD 373.0 million in 2025 and is projected to reach USD 501.2 million by 2035, registering a compound annual growth rate (CAGR) of 3.0% over the forecast period.
The Continuous Inkjet Inks market is witnessing significant growth driven by the rapid expansion of packaging, labeling, and coding applications across industries such as food and beverage, pharmaceuticals, and consumer goods. Increasing emphasis on high-speed, high-quality printing solutions has fueled the adoption of continuous inkjet systems due to their reliability and versatility in industrial environments.
Technological advancements in ink formulation, enabling superior adhesion, faster drying times, and improved resistance to smudging or fading, are contributing to the market’s steady expansion. The demand for environmentally sustainable and low-VOC inks is also gaining momentum, aligning with global sustainability goals and regulatory requirements.
Furthermore, manufacturers are increasingly investing in automation and digitalization, which has amplified the need for efficient, software-controlled inkjet systems As industries shift toward smart packaging and product traceability solutions, continuous inkjet inks are expected to play an essential role in maintaining efficiency, compliance, and quality, positioning the market for continued growth in the coming years.
| Metric | Value |
|---|---|
| Continuous Inkjet Inks Market Estimated Value in (2025 E) | USD 373.0 million |
| Continuous Inkjet Inks Market Forecast Value in (2035 F) | USD 501.2 million |
| Forecast CAGR (2025 to 2035) | 3.0% |
The market is segmented by Ink, Substrate, and End Use and region. By Ink, the market is divided into Water-Based Inks, Solvent Based Inks, UV Curable Inks, and Phase Change Ink. In terms of Substrate, the market is classified into Paper, Plastic Sheets, Glass, Metal, and Others. Based on End Use, the market is segmented into Food, Beverage, Pharmaceuticals, Electrical And Electronics, and Others. Regionally, the market is classified into North America, Latin America, Western Europe, Eastern Europe, Balkan & Baltic Countries, Russia & Belarus, Central Asia, East Asia, South Asia & Pacific, and the Middle East & Africa.
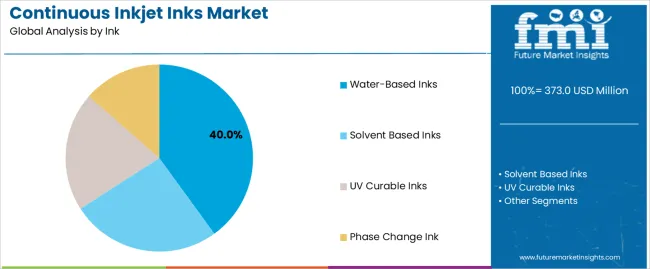
The water-based inks segment is projected to hold 40.00% of the Continuous Inkjet Inks market revenue share in 2025, making it the leading ink type. This segment’s growth has been primarily driven by rising environmental concerns and increasing restrictions on solvent-based formulations. Water-based inks offer reduced volatile organic compound emissions and improved workplace safety, which has encouraged their adoption in regulatory-conscious markets.
Their compatibility with a wide range of substrates and ability to produce sharp, high-quality prints further enhance their appeal for continuous inkjet applications. Additionally, advancements in water-based pigment and dye technologies have improved performance attributes such as color vibrancy, drying time, and water resistance, narrowing the gap with solvent-based alternatives.
Growing demand from food packaging and labeling sectors, where non-toxic and odorless inks are preferred, has reinforced the dominance of this segment As industries continue to focus on sustainability and eco-efficient production methods, water-based inks are expected to maintain a strong position in the market.
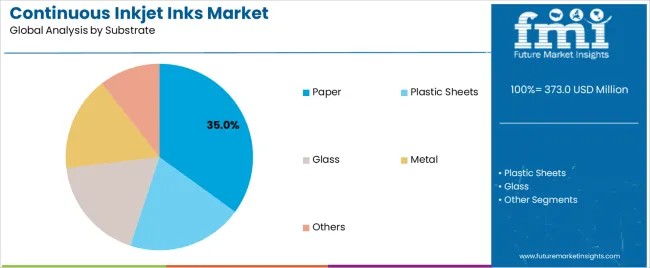
The paper substrate segment is anticipated to account for 35.00% of the Continuous Inkjet Inks market revenue share in 2025, positioning it as the leading substrate category. This dominance is supported by the extensive use of paper in packaging, labeling, and publishing industries where continuous inkjet printing provides cost-effective and high-speed marking solutions. The segment’s growth is being influenced by the rising demand for recyclable and biodegradable packaging materials as brands move toward sustainable packaging practices.
The compatibility of paper substrates with various ink formulations, including water-based and UV-curable inks, enhances their versatility across multiple end-use sectors. In addition, technological improvements in coated and treated papers have significantly improved print resolution and ink absorption, resulting in superior image quality and durability.
The expansion of the e-commerce sector and the increasing need for printed barcodes and logistics labels further contribute to the segment’s growth Paper remains a preferred substrate due to its recyclability, affordability, and wide availability, ensuring sustained demand in the forecast period.
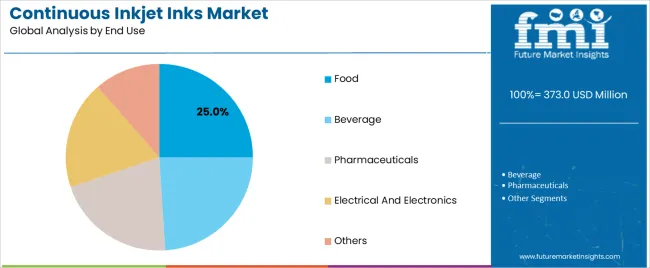
The food segment is expected to capture 25.00% of the Continuous Inkjet Inks market revenue share in 2025, establishing it as the leading end-use industry. Growth in this segment has been driven by stringent regulations on labeling and traceability, which require clear and durable printing for expiry dates, batch numbers, and ingredient information. The food industry’s increasing reliance on continuous inkjet printing for high-speed, non-contact coding on varied packaging materials has supported its dominance.
The shift toward sustainable and food-safe inks has also played a pivotal role, as manufacturers prioritize compliance with food safety standards while maintaining print clarity. Water-based and low-migration inks are being increasingly adopted to ensure no contamination of packaged food products.
Additionally, the rising trend of branded and customizable packaging has boosted the need for high-resolution printing solutions With growing consumer demand for transparency and regulatory emphasis on accurate labeling, the food segment is projected to sustain its leadership in the continuous inkjet inks market.
The below table presents the expected CAGR for the global continuous inkjet inks market over several semi-annual periods spanning from 2025 to 2035. In the first half (H1) of the year from 2025 to 2035, the business is predicted to surge at a CAGR of 2.8%, followed by a slightly higher growth rate of 3.2% in the second half (H2) of the same year.
| Particular | Value CAGR |
|---|---|
| H1 | 2.8% (2025 to 2035) |
| H2 | 3.2% (2025 to 2035) |
| H1 | 2.7% (2025 to 2035) |
| H2 | 3.3% (2025 to 2035) |
Moving into the subsequent period, from H1 2025 to H2 2035, the CAGR is projected to decrease slightly to 2.7% in the first half and remain relatively moderate at 3.3% in the second half. In the first half (H1) the market witnessed a decrease of 10 BPS while in the second half (H2), the market witnessed an increase of 10 BPS.
High Performance and Ability to Adhere on Non-Porous Surfaces
These continuous inkjet inks find most of their applications such as printing across various end-use industries. One of the major uses of these inks is in the building and construction industry for printing necessary information such as product specifications providing the compositions of the product, its suitability towards different chemicals or substrates and many others on tiles, plastic pipes and glass panels.
These inkjet inks are known for their consistent performance ensuring smooth and uninterrupted printing and strong adhesion properties. Printing over non-porous surfaces is a great challenge due to its smooth nature. But continuous inkjet inks are designed to interact with various non-porous surfaces such as glass, plastic and ceramics without causing any damage or adverse reactions.
This is due to the presence of specific additives or surface-active agents that prevent wetting and ink from spreading over these surfaces.
As per the survey of Invest India, the construction sector is showing lucrative growth in India and is expected to generate 70% of the country’s GDP by 2035. As the construction industry is growing and continuous inkjet inks have several applications, the continuous inkjet inks market is expected to have great demand over the forecast period
Reasonable Continuous Inkjet Inks Prices Leading to its High Demand
The affordability of continuous inkjet inks is one of the major reasons for their high demand in case of high-volume printing requirements and industries focusing on cost-cutting in their production processes. In the past few years, there has been a rise in the number of startups, and small and medium-sized businesses across various sectors.
According to the Ministry of Commerce and Industry of India, the country is exhibiting a rise in the number of startups recording around 117,254 startups till 2025. As these businesses are in their starting phase, they don’t hold high revenues for investments and also focus on bringing cost-effectiveness to their operations. Whether the business is small-scale or large-scale, it requires printing during its storage and delivery stage.
These continuous inkjet inks have a low upfront cost and lesser consumption of ink and at the same time produce larger print sizes as compared to laser printers or thermal inkjet printers. Continuous inkjet inks are versatile, suitable for a variety of ink formulations, and adaptable to different printing applications and several surfaces, including non-porous surfaces.
Due to this, continuous inkjet inks are preferred by small-scale and medium-sized businesses to lower their operational expense and offer high-quality prints. Thus, a less expensive nature and high performance will pose a catalyst in boosting the demand for continuous inkjet inks in the upcoming years.
Utilizing Eco-friendly Continuous Inkjet Inks in Printers
The traditional inks that are used in inkjet printers such as dye-based inks may contain the four heavy metals mercury, lead, cadmium, and hexavalent chromium which are banned under EU regulations. These heavy metals can cause water and soil pollution. The ink contains various other petroleum and chemical additives to dry onto the substrate rapidly. These additives cause a volatile impact on the environment.
The CIJ inks manufacturers are now using eco-friendly inks also called as agri-based inks which are made from vegetable oil and can provide an alternative to petroleum-based inks. Besides, the vegetable-oil-based inks are renewable unlike the petroleum-based inks and are now being widely preferred by the key players in the CIJ ink market.
This has huge benefits because of its environment friendliness and minimal impact on the environment, thus many manufacturers are adopting the use of eco-friendly continuous inkjet inks in the upcoming years.
Makeup Fluids Constitute For Substantial Portion of Expenses
The makeup fluids are the most crucial part of the continuous inkjet ink printing process to ensure optimal printing quality and high print head performance. These makeup fluids account for high investment right from its procurement, storage and disposal as compared to other printing technologies that use toner cartridges and fixed print heads.
Thus, continuous inkjet inks hold a considerably high cost compared to standard inks used in other printing methods. Due to this reason, the continuous inkjet ink market may hamper in the assessment period.
The global market recorded a CAGR of 1.6% during the historical period between 2020 and 2025. Market growth of continuous inkjet ink was positive as it reached a value of USD 373 million in 2025 from USD 321.7 million in 2020.
Due to the rising demand for printing applications in the food and beverage industry, the continuous inkjet ink market is indicating high growth. Various packaging materials are required for food and beverages to maintain quality and integrity.
Continuous inkjet inks are used for printing these necessary information such as manufacturing date, expiry date, and specification related to consumption and storage in terms of desired temperature, etc. on bottles, cans, cartons, meat packaging and ready meals.
The use of solvent-based continuous inkjet inks is projected to rise amid its versatility for various substrates and resistance to chemicals, water and anti-fading properties over long periods. They are used majorly for coding and marking in automotive, electrical, pharmaceutical and electronics industries.
Solvent-based continuous inkjet inks show compatibility with multiple printing equipment. These inks produce prints with sharp edges and attractive colors thus offering the desired aesthetic as per the consumer demand. As these inks possess distinct characteristics and benefits, manufacturers all over the globe are putting efforts into innovation to meet the demands of end users.
Tier 1 companies comprise market leaders with a market revenue of above USD 14 million capturing significant market share of 25% to 35% in global market. These market leaders are characterized by high production capacity and a wide product portfolio. These market leaders are distinguished by their extensive expertise in manufacturing across multiple packaging formats and a broad geographical reach, underpinned by a robust consumer base.
They provide a wide range of series including recycling and manufacturing utilizing the latest technology and meeting the regulatory standards providing the highest quality. Prominent companies within tier 1 include Linx Printing Technologies, Eastman Kodak Company, Sun Chemical and Videojet Technologies, Inc.
Tier 2 companies include mid-size players with revenue of USD 3 to 14 million having presence in specific regions and highly influencing the local market. These are characterized by a strong presence overseas and strong market knowledge. These market players have good technology and ensure regulatory compliance but may not have advanced technology and wide global reach.
Prominent companies in tier 2 include Kao Collins Inc., ARMOR-IIMAK, Tritron GmbH, Needham Inks Ltd. and some other players.
Tier 3 includes the majority of small-scale companies operating at the local presence and serving niche markets having revenue below USD 150 million. These companies are notably oriented towards fulfilling local market demands and are consequently classified within the tier 3 share segment. They are small-scale players and have limited geographical reach.
Tier 3, within this context, is recognized as an unorganized market, denoting a sector characterized by a lack of extensive structure and formalization when compared to organized competitors.
The section below covers the future forecast for duct tapes market in terms of countries. Information on key countries in several parts of the globe, including North America, Latin America, East Asia, South Asia, Europe, Oceania and MEA is provided. India is anticipated to remain at the forefront in South Asia, with a CAGR of 5.1% through 2035. In East Asia, China is projected to witness a CAGR of 4.5% by 2035.
| Countries | Value CAGR (2025 to 2035) |
|---|---|
| USA | 2.1% |
| UK | 1.5% |
| Germany | 1.2% |
| Brazil | 2.1% |
| China | 4.5% |
| India | 5.1% |
| GCC Countries | 2.6% |
According to the International Trade Administration, USA Department of Commerce, the Brazilian information technology market accounts for 36.5% of the Latin American market generating a valuation of USD 373 billion in 2025, showing a growth of 3% from 2024.
With consistent innovations in the electronics industry, there has been a huge demand for various electronic products in Brazil.
Apart from basic applications such as product packaging, labelling, coding and printed circuit board marking for identifying different products throughout the supply chain continuous inkjet inks play one more key role in this industry of seamlessly integrating continuous inkjet ink printing solutions in its manufacturing methods.
With this, the manufacturers can customize their printing solutions by printing product specifications and brand logos efficiently, thus differentiating their products from the other competitors.
As per the survey of India Brand Equity Foundation (IBEF), the Indian pharmaceutical industry is one of the leading producer of generic drugs and growing at a CAGR 9.43% and expected to reach USD 501.2 billion till 2035.
Among several types of continuous inkjet inks such as water-based, solvent-based, phase change inks, etc. UV curable inks are used more often in the pharmaceutical industry due to their fast drying ability and high durability for different medicine packaging solutions which include prints on blister packaging of medicines and vaccine ampoules and vials.
These UV curable inks consist of photo-initiators that are responsible for offering their quick drying feature. These inks show resistance towards chemicals and scratching, thus ensuring the print is sustained for a longer period. Due to the great importance of information printing on pharmaceutical products, continuous inkjet inks are expected to propel in the upcoming years.
USA is projected to showcase a CAGR OF 2.1% in the forecast period. The increasing need for secured packaging in beverage industry is anticipated to play a significant role in pushing the demand for continuous inkjet inks market.
There has been a rise in the consumption of beverages across all age groups in USA. But consumption of spoiled and contaminated beverages may lead to severe illness such as food-borne diseases. As reported by the Center for Disease Control and Prevention (CDC), more than 1, 00,000 people are hospitalized and around 3,000 people die every year because of consuming contaminated drinks.
Thus, there is a necessity for effective packaging solutions with the objective that packaged beverages reach the customers pure in quality and safe.
Continuous water-based inkjet inks are used because of superior adhesion, color vibrancy and resistance to abrasion. Water-based inkjet inks play a major role in this by offering prints conveying necessary information about instruction related to the storage of beverage to avoid its spoilage due to exposure to unwanted conditions and mentioning the expiry dates so that the expired beverages are disposed and not consumed by anyone.
With aim of curb the diseases spread due to consumption of expired drinks, the need for continuous water-based inkjet inks is expected to increase.
The section contains information about the leading segments in the industry. In terms of ink, water-based inks is estimated to account for a share of 47.7% by 2035. By substrate, paper segment is projected to dominate by holding a share of 501.2% by the end 2035.
| Ink | Water-based Inks |
|---|---|
| Value CAGR (2035) | 3.4% |
Water-based inks among other inks is expected to lead the continuous inkjet inks market during the forecast period. Water-baes inks is anticipated to rise at a CAGR of 3.4%, generating an incremental growth opportunity worth USD 501.2 million by 2035.
The water-based inks consist of dye-based inks and pigment-based inks, both of them exceptional benefits across various industries. The dye-based possesses the absorbing ability of the molecular structures of dyes across broad spectrum wavelengths and offers bright colors with better optical density.
The pigment-based inks the solid particles of the pigments offer strong color saturation, providing prints with attractive colors and high contrast. Due to its high color quality, these inks are used most often for branding purposes by highlighting its product with the competitors..
| Substrate | Paper |
|---|---|
| Value CAGR (2035) | 2.9% |
The paper as a substrate is estimated to lead the continuous inkjet inks industry. It is anticipated to hold around 2.9% CAGR value share in 2035.
Various types of substrates are utilized for continuous inkjet printing consisting of paper, plastic sheets, glass, metal and other fabrics. Amongst all these, paper is the most widely used substrate because of the high usage of paperboard across end-use industries such as packaged food packaging, and cardboards for secondary packaging of medicines, electrical and electronics.
Those businesses focusing on cost-sensitive product processes utilize paper for packaging instead of glass and metal, due to its less expensive nature. Also paper is an eco-friendly material as it is sourced from renewable sources like trees, thus fulfilling the environmental and sustainability considerations. Due to its cost-effective and eco-friendly nature, paper is used on a large scale as a substrate for continuous inkjet inks.
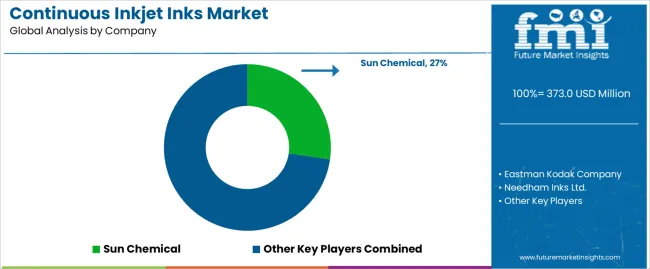
Key players of continuous inkjet inks industry are developing and launching new products in the market. They are integrating with different firms and extending their geographical presence. Few of them are also collaborating and partnering with local brands and start-up companies for new product development.
Key Developments in Continuous Inkjet Inks Market:
In terms of ink, the industry is divided into water-based inks, solvent based inks, UV curable inks and phase change ink. The water-based inks segment is further categorized into dye based and pigment based.
Few of the important substrate include paper, plastic sheets, glass, metal, others (fabrics, etc.). The paper substrates are further divided into paperboard and card board.
Some of end users related to continuous inkjet inks market include food, beverage, pharmaceuticals, electrical and electronics and others
Key countries of North America, Latin America, East Asia, South Asia, Europe, Oceania, Middle East and Africa are covered.
The global continuous inkjet inks market is estimated to be valued at USD 373.0 million in 2025.
The market size for the continuous inkjet inks market is projected to reach USD 501.2 million by 2035.
The continuous inkjet inks market is expected to grow at a 3.0% CAGR between 2025 and 2035.
The key product types in continuous inkjet inks market are water-based inks, _dye-based, _pigment based, solvent based inks, uv curable inks and phase change ink.
In terms of substrate, paper segment to command 35.0% share in the continuous inkjet inks market in 2025.


Our Research Products

The "Full Research Suite" delivers actionable market intel, deep dives on markets or technologies, so clients act faster, cut risk, and unlock growth.

The Leaderboard benchmarks and ranks top vendors, classifying them as Established Leaders, Leading Challengers, or Disruptors & Challengers.

Locates where complements amplify value and substitutes erode it, forecasting net impact by horizon

We deliver granular, decision-grade intel: market sizing, 5-year forecasts, pricing, adoption, usage, revenue, and operational KPIs—plus competitor tracking, regulation, and value chains—across 60 countries broadly.

Spot the shifts before they hit your P&L. We track inflection points, adoption curves, pricing moves, and ecosystem plays to show where demand is heading, why it is changing, and what to do next across high-growth markets and disruptive tech

Real-time reads of user behavior. We track shifting priorities, perceptions of today’s and next-gen services, and provider experience, then pace how fast tech moves from trial to adoption, blending buyer, consumer, and channel inputs with social signals (#WhySwitch, #UX).

Partner with our analyst team to build a custom report designed around your business priorities. From analysing market trends to assessing competitors or crafting bespoke datasets, we tailor insights to your needs.
Supplier Intelligence
Discovery & Profiling
Capacity & Footprint
Performance & Risk
Compliance & Governance
Commercial Readiness
Who Supplies Whom
Scorecards & Shortlists
Playbooks & Docs
Category Intelligence
Definition & Scope
Demand & Use Cases
Cost Drivers
Market Structure
Supply Chain Map
Trade & Policy
Operating Norms
Deliverables
Buyer Intelligence
Account Basics
Spend & Scope
Procurement Model
Vendor Requirements
Terms & Policies
Entry Strategy
Pain Points & Triggers
Outputs
Pricing Analysis
Benchmarks
Trends
Should-Cost
Indexation
Landed Cost
Commercial Terms
Deliverables
Brand Analysis
Positioning & Value Prop
Share & Presence
Customer Evidence
Go-to-Market
Digital & Reputation
Compliance & Trust
KPIs & Gaps
Outputs
Full Research Suite comprises of:
Market outlook & trends analysis
Interviews & case studies
Strategic recommendations
Vendor profiles & capabilities analysis
5-year forecasts
8 regions and 60+ country-level data splits
Market segment data splits
12 months of continuous data updates
DELIVERED AS:
PDF EXCEL ONLINE
Continuously Variable Transmission (CVT) Market Size and Share Forecast Outlook 2025 to 2035
Continuous Ambulatory Peritoneal Dialysis Bags Market Size and Share Forecast Outlook 2025 to 2035
Continuous Motion Cartoner Market Size and Share Forecast Outlook 2025 to 2035
Continuous Cardiac Monitoring Devices Market Size and Share Forecast Outlook 2025 to 2035
Continuous Ketone Monitoring Market Size and Share Forecast Outlook 2025 to 2035
Continuous Flow Bioreactors Market Analysis - Size, Share, and Forecast Outlook 2025 to 2035
Continuous Friction Tester Market Size and Share Forecast Outlook 2025 to 2035
Continuous Fryer Machine Market Size and Share Forecast Outlook 2025 to 2035
Continuous Glucose Monitoring Device Market - Demand & Future Trends 2025 to 2035
Continuous Hormone Monitoring Market Analysis - Size, Share, and Forecast Outlook 2025 to 2035
Continuous Emission Monitoring System Market Growth - Trends & Forecast 2025 to 2035
Continuous Positive Airway Pressure (CPAP) Market Analysis – Size, Share & Forecast Outlook 2025 to 2035
Continuous Glucose Monitoring Systems Market is segmented by transmitters and monitors, sensors and insulin pump from 2025 to 2035
Continuous Miners Market Growth - Trends & Forecast 2025 to 2035
Continuous Peripheral Nerve Block Catheter Market Growth – Trends & Forecast 2025-2035
Continuous Renal Replacement Therapy Market Growth – Trends & Forecast 2025-2035
Continuous Thread Metal Cap Market
Continuous Integration Tools Market
Continuous Flow Analyzer Market
Continuous Track Wheels Market

Thank you!
You will receive an email from our Business Development Manager. Please be sure to check your SPAM/JUNK folder too.
Chat With
MaRIA