Continuous Hormone Monitoring Market Size & Share Forecast Outlook 2025 to 2035

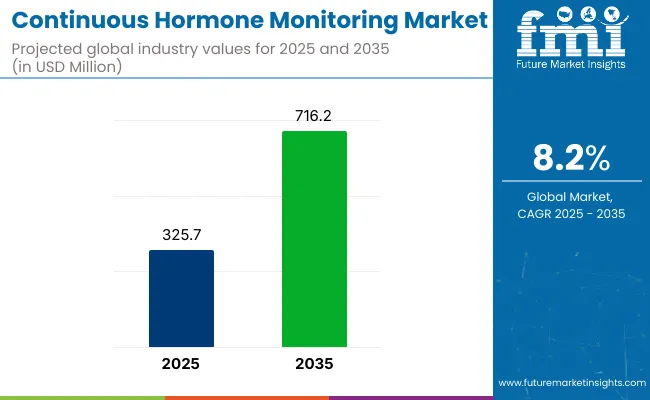
The continuous hormone monitoring market is projected to grow from USD 325.7 million in 2025 to USD 716.2 million by 2035, registering a CAGR of 8.2% during the forecast period. The market growth is being driven by the increasing demand for advanced hormone monitoring systems, which provide real-time insights into hormonal imbalances.
Quick Stats for the Continuous Hormone Monitoring Market

  • Market Value (2025): USD 325.7 million
  • Forecast Value (2035): USD 716.2 million
  • Forecast CAGR: 8.2%
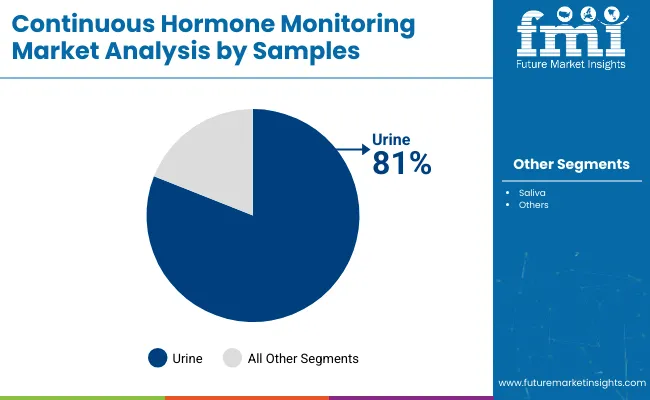
  • Leading Segment in 2025: Urine (81% share)
  • Key Growth Region: Asia (China)
  • Top Key Players: OOVA Inc., Hormona, Eli Health, Inito Health Tech Private Limited, Mira

Continuous Hormone Monitoring Market

Attribute Value
Market Size in 2025 USD 325.7 million
Market Size in 2035 USD 716.2 million
CAGR (2025 to 2035) 8.2%

These systems are becoming critical for the management of diabetes, thyroid disorders, reproductive health, and other hormone-related conditions. The adoption of remote monitoring technologies is expected to increase significantly, as healthcare providers aim to offer personalized treatments and improve patient outcomes through continuous and accurate hormone tracking.

As emphasized by Ula Rustamova, CEO of Level Zero Health, in an interview with TechFundingNews (February 18, 2025), “Our innovative remote monitoring technology marks an enormous leap forward in hormone testing, and this funding will enable us to bring this revolutionary solution to market. It captures critical data inaccessible before.” This highlights the growing importance of remote hormone monitoring technologies in revolutionizing the management of hormonal disorders and providing better access to healthcare solutions.

The market is being influenced by continuous advancements in sensor technologies and the integration of AI-powered solutions for real-time hormone tracking. These technologies are enabling devices to become more accurate, efficient, and smarter. As the demand for non-invasive hormone testing rises, the market is expected to continue its growth, particularly in Asia, where China is recognized as a key growth region.

Increased awareness of hormone-related health issues is expected to drive the adoption of these innovative monitoring systems. Strategic investments in research and development and technology partnerships are expected to shape the future of the market, fostering further innovations in continuous hormone monitoring.

Continuous Hormone Monitoring Market Analyzed by Top Investment Segments

The continuous hormone monitoring market is experiencing substantial growth, driven by rising demand for fertility-related applications, urine samples for testing, and the increasing shift to direct-to-consumer sales channels.

Urine Is Expected to dominatethe Sample Type with an 81% Market Share in 2025

Urine samples are projected to dominate the continuous hormone monitoring market in 2025, accounting for 81% of the market share.
  • The preference for urine is driven by its non-invasive collection method, which makes it ideal for hormone testing. At-home collection methods have led to widespread use, particularly for fertility, pregnancy, and hormone level monitoring.
  • With advancements in testing technology, urine samples are increasingly being utilized in home healthcare devices.
  • Reliable and accurate urine-based tests are being developed by companies like Abbott Laboratories and Roche, enhancing their availability for consumers. This trend is expected to continue, fueling growth in urine-based hormone testing solutions.

Continuous Hormone Monitoring Market Analysis By Samples

Fertility Is Projected to Lead Applications With a 65% Market Share in 2025

Fertility is projected to account for 65% of the continuous hormone monitoring market share in 2025. This growth is driven by the increasing demand for fertility tracking solutions, especially among women looking to manage reproductive health.

  • Hormone monitoring devices that track ovulation and other fertility-related hormones are being used extensively for conception planning. Wearable devices and smartphone apps are being integrated with hormone monitoring systems to provide personalized fertility management.
  • Companies such as Mira and Fertility Friend are focusing on innovation in fertility hormone tracking devices to meet the rising consumer demand. This trend is expected to continue, further strengthening the segment.

Direct to Customers Is Expected to Lead Sales Channels With 62.7% Share in 2025

The direct-to-customer sales channel is expected to hold a 62.7% share of the continuous hormone monitoring market in 2025. This preference is driven by consumers increasingly seeking convenience and privacy in hormone testing through at-home kits.

  • E-commerce platforms have made these solutions easily accessible, allowing users to purchase directly without visiting a doctor.
  • Companies like Everlywell and Modern Fertility are utilizing this model by offering hormone tests directly to consumers, empowering individuals to monitor their health independently. This shift towards direct sales is anticipated to fuel continued growth in consumer-driven health monitoring solutions.

Continuous Hormone Monitoring Market By Sales Channel

Top Continuous Hormone Monitoring Market Dynamics

The continuous hormone monitoring market is being driven by advancements in wearable technology and consumer interest in personalized health. Innovations in non-invasive sensors and real-time data are enhancing engagement, while regulatory challenges limit adoption.

Advancements in wearable technology and growing consumer interest in personalized health are driving market growth

The continuous hormone monitoring market is being significantly boosted by advancements in wearable technology and a growing consumer interest in personalized health. Innovations in non-invasive sensors, such as DNA-based biosensors, are enabling real-time tracking of hormones like cortisol, estrogen, and testosterone.

These devices, often integrated with smartphone applications, provide users with continuous insights into their hormonal health, facilitating proactive management of conditions like stress, menopause, and testosterone replacement therapy. The increasing demand for personalized health solutions is further propelling market growth, as individuals seek more tailored and accessible methods to monitor and manage their well-being.

Regulatory hurdles and data privacy concerns are limiting widespread adoption

Despite the promising growth prospects, the continuous hormone monitoring market faces challenges related to regulatory hurdles and data privacy concerns. The development and approval of wearable hormone monitoring devices require compliance with stringent medical device regulations, which can delay market entry and increase costs.

Additionally, the collection and transmission of sensitive health data raise privacy and security issues, necessitating robust data protection measures to gain consumer trust. These factors may hinder the widespread adoption of continuous hormone monitoring technologies, particularly in regions with strict regulatory environments and heightened concerns over data privacy.

Analyzing Top Countries Manufacturing, Distributing, and Supplying Continuous Hormone Monitoring Solutions

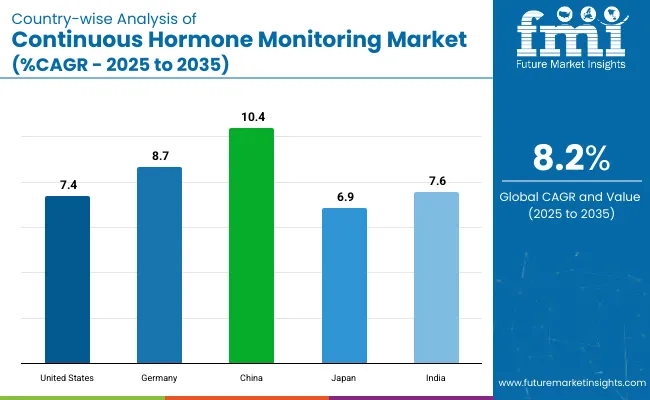
The continuous hormone monitoring market is expected to be driven by increasing demand for wearable technologies and rising health awareness. Rapid growth in China and India is anticipated, while the USA and Germany focus on innovations.
Country Wise Analysis Of Continuous Hormone Monitoring Market

Countries CAGR (%)
United States 7.4%
Germany 8.7%
China 10.4%
Japan 6.9%
India 7.6%

In-depth Analysis of the United States Continuous Hormone Monitoring Market

The United States continuous hormone monitoring market is expected to grow at a CAGR of 7.4% through 2035. Growth is being driven by increasing demand for wearable devices and AI-powered hormone monitoring solutions. Leading companies like Abbott, Medtronic, and Dexcom are advancing the development of continuous hormone monitoring technologies.

  • Government regulations promoting innovation in medical devices and wearable health technologies are being implemented.
  • The adoption of continuous hormone monitoring solutions is being fueled by the rising focus on personalized healthcare, patient convenience, and disease prevention.
  • Advancements in real-time monitoring systems and data integration are being incorporated into wearable devices to improve accuracy and patient management.

Analysis of Sales of Continuous Hormone Monitoring Systems in Germany

The continuous hormone monitoring market is projected to grow at a CAGR of 8.7% through 2035. Growth is being supported by advancements in hormone monitoring technologies and a growing demand for personalized healthcare solutions.

  • Companies such as Siemens Healthineers and Roche are focusing on innovation to improve the efficiency of hormone monitoring systems.
  • Government policies that promote digital health and support healthcare innovations are contributing to market growth. Germany’s robust healthcare infrastructure and regulatory framework are facilitating the integration of continuous hormone monitoring solutions.
  • Technological developments, particularly in AI, IoT, and real-time data processing, are enhancing the market adoption of hormone monitoring devices.

Detailed Outlook on the Future of Continuous Hormone Monitoring Market in China

The continuous hormone monitoring market is expected to grow at a CAGR of 10.4% through 2035. Expansion is being driven by rapid industrialization, increasing healthcare awareness, and government initiatives to improve healthcare infrastructure.

  • Leading companies such as Sinocare and Medtronic are heavily investing in developing advanced hormone monitoring technologies. Government policies aimed at improving healthcare access and promoting digital health solutions are contributing to market growth.
  • The rising prevalence of hormonal imbalances and chronic diseases is increasing the demand for continuous hormone monitoring devices.
  • Technological advancements in wearable devices and the growing middle class in China are accelerating the adoption of hormone monitoring solutions.

Growth Analysis and Forecast for Japan Continuous Hormone Monitoring Market

The continuous hormone monitoring market is projected to grow at a CAGR of 6.9% through 2035. Growth is being supported by an aging population, increased demand for healthcare solutions, and advancements in hormone monitoring technologies.

  • Companies like Panasonic, Omron, and Roche are leading the development of wearable hormone monitoring devices.
  • Government initiatives supporting sustainable healthcare solutions and digital health are fostering the growth of continuous hormone monitoring technologies.
  • The adoption of remote patient monitoring and telemedicine solutions is also supporting market expansion. Technological advancements in sensor systems, AI, and data analytics are improving the accuracy and effectiveness of hormone monitoring devices in Japan.

Demand Forecast Analysis for Continuous Hormone Monitoring Market in India

The continuous hormone monitoring market is expected to grow at a CAGR of 7.6% through 2035. Growth is driven by increasing health awareness, rising prevalence of hormone imbalances, and government initiatives aimed at improving healthcare infrastructure.

  • Domestic and international companies such as Abbott, Medtronic, and BPL Medical Technologies are investing in developing affordable continuous hormone monitoring devices.
  • Government policies promoting digital health solutions and telemedicine are contributing to market growth. The growing middle class, expanding urbanization, and improving healthcare access are accelerating the adoption of wearable health technologies.
  • The demand for personalized treatments and efficient disease management solutions is further fueling market expansion.

Leading Suppliers in the Continuous Hormone Monitoring Market

Key players like Level Zero Health and Eli Health dominate the market due to their advanced technologies. Level Zero Health developed a wearable patch using DNA-based sensors for continuous hormone monitoring, with €6.6 million in pre-seed funding secured to advance its technology. Eli Health offers the Hormometer, transforming smartphones into real-time hormone analyzers using saliva-based testing to monitor hormones such as cortisol and progesterone.

Other significant players, including POM Health and imi, focus on real-time hormonal data collection and thyroid hormone monitoring, supporting personalized healthcare. Emerging players like HormoneSync and OvaGraph target regional markets with niche wearable devices for fertility tracking and wellness, offering specialized hormone monitoring tools for specific consumer needs.

Recent Continuous Hormone Monitoring Industry News

  • In February 2025, a €6.6 million pre-seed funding round was announced by Level Zero Health, led by European VC firm Redalpine, with participation from HAX (SOSV), Entrepreneur First, and industry experts. The funding is aimed at enabling remote and continuous hormone monitoring through the use of unique DNA-based sensors.
  • In January 2025, Eli Health debuted its Hormometer at CES, a device that transforms smartphones into real-time hormone analyzers using saliva-based testing, providing insights into hormones like cortisol and progesterone.
  • In May 2024, a medical-grade monitor for continuous hormonal health data collection was introduced by POM Health, enabling precise, real-time hormonal data and supporting personalized healthcare interventions. These developments highlight the growing interest and investment in continuous hormone monitoring technologies, signaling a shift toward more personalized and accessible healthcare solutions.

Leading Suppliers in the Continuous Hormone Monitoring Market

  • OOVA Inc.
  • Hormona
  • Eli Health
  • Inito Health Tech Private Limited
  • Mira
  • Proov

Research Coverage and Scope Summary

Report Attributes Details
Current Total Market Size (2025) USD 325.7 million
Projected Market Size (2035) USD 716.2 million
CAGR (2025 to 2035) 8.2%
Base Year for Estimation 2024
Historical Period 2020 to 2024
Projections Period 2025 to 2035
Quantitative Units USD million for value and the Number of Tests
Sample Types Analyzed (Segment 1) Saliva; Urine
Applications Covered (Segment 2) Stress; Sleep; Fertility; Menopause
Sales Channels Covered (Segment 3) Direct to customers; Specialty clinics; Online sales/e-commerce; Retail pharmacy chains; Subscription models
Regions Covered North America; Western Europe; East Asia; South Asia
Countries Covered United States; Canada; United Kingdom; Germany; France; Italy; Spain; Netherlands; China; Japan; South Korea; India; Pakistan; Bangladesh
Key Players Influencing the Market OOVA Inc.; Hormona; Eli Health; Inito Health Tech Private Limited; Mira; Proov
Additional Attributes Dollar sales by sample type (saliva vs urine); Market demand for hormone monitoring in fertility, sleep, and menopause; Trends in subscription models vs one-time purchases; Growth in online sales and e-commerce for health tech products

Key Segments

By Samples:

The market is segmented into saliva and urine.

By Application:

The market covers stress, sleep, fertility, and menopause applications.

By Sales Channel:

The market is categorized into direct to customers, specialty clinics, online sales/e-commerce, retail pharmacy chains, and subscription models.

By Region:

The market spans North America, Western Europe, East Asia, and South Asia.

Table of Content

  1. Executive Summary
  2. Market Overview
  3. Market Background
  4. Global Market Analysis 2020 to 2024 and Forecast, 2025 to 2035
  5. Global Market Pricing Analysis 2020 to 2024 and Forecast 2025 to 2035
  6. Global Market Analysis 2020 to 2024 and Forecast 2025 to 2035, By Samples
    • Saliva
    • Urine
  7. Global Market Analysis 2020 to 2024 and Forecast 2025 to 2035, By Application
    • Stress
    • Sleep
    • Fertility
    • Menopause
  8. Global Market Analysis 2020 to 2024 and Forecast 2025 to 2035, By Sales Channel
    • Direct to Customers
    • Speciality Clinics
    • Online Sales/E-Commerce
    • Retail Pharmacy Chains
    • Subscription Models
  9. Global Market Analysis 2020 to 2024 and Forecast 2025 to 2035, By Region
    • North America
    • Latin America
    • Western Europe
    • Eastern Europe
    • East Asia
    • South Asia & Pacific
    • Middle East and Africa
  10. North America Market Analysis 2020 to 2024 and Forecast 2025 to 2035, By Country
  11. Latin America Market Analysis 2020 to 2024 and Forecast 2025 to 2035, By Country
  12. Western Europe Market Analysis 2020 to 2024 and Forecast 2025 to 2035, By Country
  13. Eastern Europe Market Analysis 2020 to 2024 and Forecast 2025 to 2035, By Country
  14. East Asia Market Analysis 2020 to 2024 and Forecast 2025 to 2035, By Country
  15. South Asia & Pacific Market Analysis 2020 to 2024 and Forecast 2025 to 2035, By Country
  16. Middle East and Africa Market Analysis 2020 to 2024 and Forecast 2025 to 2035, By Country
  17. Key Countries Market Analysis
  18. Market Structure Analysis
  19. Competition Analysis
    • OOVA Inc.
    • Hormona
    • Eli Health
    • Inito Health Tech Private Limited
    • ALPCO
    • Mira
    • Proov
  20. Assumptions & Acronyms Used
  21. Research Methodology

List of Tables

  • Table 1: Global Market Value (USD Million) Forecast by Region, 2020 to 2035
  • Table 2: Global Market Volume (Number of Tests) Forecast by Region, 2020 to 2035
  • Table 3: Global Market Value (USD Million) Forecast by Samples, 2020 to 2035
  • Table 4: Global Market Volume (Number of Tests) Forecast by Samples, 2020 to 2035
  • Table 5: Global Market Value (USD Million) Forecast by Application, 2020 to 2035
  • Table 6: Global Market Volume (Number of Tests) Forecast by Application, 2020 to 2035
  • Table 7: Global Market Value (USD Million) Forecast by Sales Channel, 2020 to 2035
  • Table 8: Global Market Volume (Number of Tests) Forecast by Sales Channel, 2020 to 2035
  • Table 9: North America Market Value (USD Million) Forecast by Country, 2020 to 2035
  • Table 10: North America Market Volume (Number of Tests) Forecast by Country, 2020 to 2035
  • Table 11: North America Market Value (USD Million) Forecast by Samples, 2020 to 2035
  • Table 12: North America Market Volume (Number of Tests) Forecast by Samples, 2020 to 2035
  • Table 13: North America Market Value (USD Million) Forecast by Application, 2020 to 2035
  • Table 14: North America Market Volume (Number of Tests) Forecast by Application, 2020 to 2035
  • Table 15: North America Market Value (USD Million) Forecast by Sales Channel, 2020 to 2035
  • Table 16: North America Market Volume (Number of Tests) Forecast by Sales Channel, 2020 to 2035
  • Table 17: Latin America Market Value (USD Million) Forecast by Country, 2020 to 2035
  • Table 18: Latin America Market Volume (Number of Tests) Forecast by Country, 2020 to 2035
  • Table 19: Latin America Market Value (USD Million) Forecast by Samples, 2020 to 2035
  • Table 20: Latin America Market Volume (Number of Tests) Forecast by Samples, 2020 to 2035
  • Table 21: Latin America Market Value (USD Million) Forecast by Application, 2020 to 2035
  • Table 22: Latin America Market Volume (Number of Tests) Forecast by Application, 2020 to 2035
  • Table 23: Latin America Market Value (USD Million) Forecast by Sales Channel, 2020 to 2035
  • Table 24: Latin America Market Volume (Number of Tests) Forecast by Sales Channel, 2020 to 2035
  • Table 25: Western Europe Market Value (USD Million) Forecast by Country, 2020 to 2035
  • Table 26: Western Europe Market Volume (Number of Tests) Forecast by Country, 2020 to 2035
  • Table 27: Western Europe Market Value (USD Million) Forecast by Samples, 2020 to 2035
  • Table 28: Western Europe Market Volume (Number of Tests) Forecast by Samples, 2020 to 2035
  • Table 29: Western Europe Market Value (USD Million) Forecast by Application, 2020 to 2035
  • Table 30: Western Europe Market Volume (Number of Tests) Forecast by Application, 2020 to 2035
  • Table 31: Western Europe Market Value (USD Million) Forecast by Sales Channel, 2020 to 2035
  • Table 32: Western Europe Market Volume (Number of Tests) Forecast by Sales Channel, 2020 to 2035
  • Table 33: Eastern Europe Market Value (USD Million) Forecast by Country, 2020 to 2035
  • Table 34: Eastern Europe Market Volume (Number of Tests) Forecast by Country, 2020 to 2035
  • Table 35: Eastern Europe Market Value (USD Million) Forecast by Samples, 2020 to 2035
  • Table 36: Eastern Europe Market Volume (Number of Tests) Forecast by Samples, 2020 to 2035
  • Table 37: Eastern Europe Market Value (USD Million) Forecast by Application, 2020 to 2035
  • Table 38: Eastern Europe Market Volume (Number of Tests) Forecast by Application, 2020 to 2035
  • Table 39: Eastern Europe Market Value (USD Million) Forecast by Sales Channel, 2020 to 2035
  • Table 40: Eastern Europe Market Volume (Number of Tests) Forecast by Sales Channel, 2020 to 2035
  • Table 41: East Asia Market Value (USD Million) Forecast by Country, 2020 to 2035
  • Table 42: East Asia Market Volume (Number of Tests) Forecast by Country, 2020 to 2035
  • Table 43: East Asia Market Value (USD Million) Forecast by Samples, 2020 to 2035
  • Table 44: East Asia Market Volume (Number of Tests) Forecast by Samples, 2020 to 2035
  • Table 45: East Asia Market Value (USD Million) Forecast by Application, 2020 to 2035
  • Table 46: East Asia Market Volume (Number of Tests) Forecast by Application, 2020 to 2035
  • Table 47: East Asia Market Value (USD Million) Forecast by Sales Channel, 2020 to 2035
  • Table 48: East Asia Market Volume (Number of Tests) Forecast by Sales Channel, 2020 to 2035
  • Table 49: South Asia & Pacific Market Value (USD Million) Forecast by Country, 2020 to 2035
  • Table 50: South Asia & Pacific Market Volume (Number of Tests) Forecast by Country, 2020 to 2035
  • Table 51: South Asia & Pacific Market Value (USD Million) Forecast by Samples, 2020 to 2035
  • Table 52: South Asia & Pacific Market Volume (Number of Tests) Forecast by Samples, 2020 to 2035
  • Table 53: South Asia & Pacific Market Value (USD Million) Forecast by Application, 2020 to 2035
  • Table 54: South Asia & Pacific Market Volume (Number of Tests) Forecast by Application, 2020 to 2035
  • Table 55: South Asia & Pacific Market Value (USD Million) Forecast by Sales Channel, 2020 to 2035
  • Table 56: South Asia & Pacific Market Volume (Number of Tests) Forecast by Sales Channel, 2020 to 2035
  • Table 57: Middle East and Africa Market Value (USD Million) Forecast by Country, 2020 to 2035
  • Table 58: Middle East and Africa Market Volume (Number of Tests) Forecast by Country, 2020 to 2035
  • Table 59: Middle East and Africa Market Value (USD Million) Forecast by Samples, 2020 to 2035
  • Table 60: Middle East and Africa Market Volume (Number of Tests) Forecast by Samples, 2020 to 2035
  • Table 61: Middle East and Africa Market Value (USD Million) Forecast by Application, 2020 to 2035
  • Table 62: Middle East and Africa Market Volume (Number of Tests) Forecast by Application, 2020 to 2035
  • Table 63: Middle East and Africa Market Value (USD Million) Forecast by Sales Channel, 2020 to 2035
  • Table 64: Middle East and Africa Market Volume (Number of Tests) Forecast by Sales Channel, 2020 to 2035

List of Figures

  • Figure 1: Global Market Volume (Number of Tests) Forecast 2020 to 2035
  • Figure 2: Global Market Pricing Analysis
  • Figure 3: Global Market Value (USD Million) Forecast 2020 to 2035
  • Figure 4: Global Market Value Share and BPS Analysis by Samples, 2025 and 2035
  • Figure 5: Global Market Y-o-Y Growth Comparison by Samples, 2025 to 2035
  • Figure 6: Global Market Attractiveness Analysis by Samples
  • Figure 7: Global Market Value Share and BPS Analysis by Application, 2025 and 2035
  • Figure 8: Global Market Y-o-Y Growth Comparison by Application, 2025 to 2035
  • Figure 9: Global Market Attractiveness Analysis by Application
  • Figure 10: Global Market Value Share and BPS Analysis by Sales Channel, 2025 and 2035
  • Figure 11: Global Market Y-o-Y Growth Comparison by Sales Channel, 2025 to 2035
  • Figure 12: Global Market Attractiveness Analysis by Sales Channel
  • Figure 13: Global Market Value (USD Million) Share and BPS Analysis by Region, 2025 and 2035
  • Figure 14: Global Market Y-o-Y Growth Comparison by Region, 2025 to 2035
  • Figure 15: Global Market Attractiveness Analysis by Region
  • Figure 16: North America Market Incremental USD Opportunity, 2025 to 2035
  • Figure 17: Latin America Market Incremental USD Opportunity, 2025 to 2035
  • Figure 18: Western Europe Market Incremental USD Opportunity, 2025 to 2035
  • Figure 19: Eastern Europe Market Incremental USD Opportunity, 2025 to 2035
  • Figure 20: East Asia Market Incremental USD Opportunity, 2025 to 2035
  • Figure 21: South Asia & Pacific Market Incremental USD Opportunity, 2025 to 2035
  • Figure 22: Middle East and Africa Market Incremental USD Opportunity, 2025 to 2035
  • Figure 23: North America Market Value Share and BPS Analysis by Country, 2025 and 2035
  • Figure 24: North America Market Value Share and BPS Analysis by Samples, 2025 and 2035
  • Figure 25: North America Market Y-o-Y Growth Comparison by Samples, 2025 to 2035
  • Figure 26: North America Market Attractiveness Analysis by Samples
  • Figure 27: North America Market Value Share and BPS Analysis by Application, 2025 and 2035
  • Figure 28: North America Market Y-o-Y Growth Comparison by Application, 2025 to 2035
  • Figure 29: North America Market Attractiveness Analysis by Application
  • Figure 30: North America Market Value Share and BPS Analysis by Sales Channel, 2025 and 2035
  • Figure 31: North America Market Y-o-Y Growth Comparison by Sales Channel, 2025 to 2035
  • Figure 32: North America Market Attractiveness Analysis by Sales Channel
  • Figure 33: Latin America Market Value Share and BPS Analysis by Country, 2025 and 2035
  • Figure 34: Latin America Market Value Share and BPS Analysis by Samples, 2025 and 2035
  • Figure 35: Latin America Market Y-o-Y Growth Comparison by Samples, 2025 to 2035
  • Figure 36: Latin America Market Attractiveness Analysis by Samples
  • Figure 37: Latin America Market Value Share and BPS Analysis by Application, 2025 and 2035
  • Figure 38: Latin America Market Y-o-Y Growth Comparison by Application, 2025 to 2035
  • Figure 39: Latin America Market Attractiveness Analysis by Application
  • Figure 40: Latin America Market Value Share and BPS Analysis by Sales Channel, 2025 and 2035
  • Figure 41: Latin America Market Y-o-Y Growth Comparison by Sales Channel, 2025 to 2035
  • Figure 42: Latin America Market Attractiveness Analysis by Sales Channel
  • Figure 43: Western Europe Market Value Share and BPS Analysis by Country, 2025 and 2035
  • Figure 44: Western Europe Market Value Share and BPS Analysis by Samples, 2025 and 2035
  • Figure 45: Western Europe Market Y-o-Y Growth Comparison by Samples, 2025 to 2035
  • Figure 46: Western Europe Market Attractiveness Analysis by Samples
  • Figure 47: Western Europe Market Value Share and BPS Analysis by Application, 2025 and 2035
  • Figure 48: Western Europe Market Y-o-Y Growth Comparison by Application, 2025 to 2035
  • Figure 49: Western Europe Market Attractiveness Analysis by Application
  • Figure 50: Western Europe Market Value Share and BPS Analysis by Sales Channel, 2025 and 2035
  • Figure 51: Western Europe Market Y-o-Y Growth Comparison by Sales Channel, 2025 to 2035
  • Figure 52: Western Europe Market Attractiveness Analysis by Sales Channel
  • Figure 53: Eastern Europe Market Value Share and BPS Analysis by Country, 2025 and 2035
  • Figure 54: Eastern Europe Market Value Share and BPS Analysis by Samples, 2025 and 2035
  • Figure 55: Eastern Europe Market Y-o-Y Growth Comparison by Samples, 2025 to 2035
  • Figure 56: Eastern Europe Market Attractiveness Analysis by Samples
  • Figure 57: Eastern Europe Market Value Share and BPS Analysis by Application, 2025 and 2035
  • Figure 58: Eastern Europe Market Y-o-Y Growth Comparison by Application, 2025 to 2035
  • Figure 59: Eastern Europe Market Attractiveness Analysis by Application
  • Figure 60: Eastern Europe Market Value Share and BPS Analysis by Sales Channel, 2025 and 2035
  • Figure 61: Eastern Europe Market Y-o-Y Growth Comparison by Sales Channel, 2025 to 2035
  • Figure 62: Eastern Europe Market Attractiveness Analysis by Sales Channel
  • Figure 63: East Asia Market Value Share and BPS Analysis by Country, 2025 and 2035
  • Figure 64: East Asia Market Value Share and BPS Analysis by Samples, 2025 and 2035
  • Figure 65: East Asia Market Y-o-Y Growth Comparison by Samples, 2025 to 2035
  • Figure 66: East Asia Market Attractiveness Analysis by Samples
  • Figure 67: East Asia Market Value Share and BPS Analysis by Application, 2025 and 2035
  • Figure 68: East Asia Market Y-o-Y Growth Comparison by Application, 2025 to 2035
  • Figure 69: East Asia Market Attractiveness Analysis by Application
  • Figure 70: East Asia Market Value Share and BPS Analysis by Sales Channel, 2025 and 2035
  • Figure 71: East Asia Market Y-o-Y Growth Comparison by Sales Channel, 2025 to 2035
  • Figure 72: East Asia Market Attractiveness Analysis by Sales Channel
  • Figure 73: South Asia & Pacific Market Value Share and BPS Analysis by Country, 2025 and 2035
  • Figure 74: South Asia & Pacific Market Value Share and BPS Analysis by Samples, 2025 and 2035
  • Figure 75: South Asia & Pacific Market Y-o-Y Growth Comparison by Samples, 2025 to 2035
  • Figure 76: South Asia & Pacific Market Attractiveness Analysis by Samples
  • Figure 77: South Asia & Pacific Market Value Share and BPS Analysis by Application, 2025 and 2035
  • Figure 78: South Asia & Pacific Market Y-o-Y Growth Comparison by Application, 2025 to 2035
  • Figure 79: South Asia & Pacific Market Attractiveness Analysis by Application
  • Figure 80: South Asia & Pacific Market Value Share and BPS Analysis by Sales Channel, 2025 and 2035
  • Figure 81: South Asia & Pacific Market Y-o-Y Growth Comparison by Sales Channel, 2025 to 2035
  • Figure 82: South Asia & Pacific Market Attractiveness Analysis by Sales Channel
  • Figure 83: Middle East and Africa Market Value Share and BPS Analysis by Country, 2025 and 2035
  • Figure 84: Middle East and Africa Market Value Share and BPS Analysis by Samples, 2025 and 2035
  • Figure 85: Middle East and Africa Market Y-o-Y Growth Comparison by Samples, 2025 to 2035
  • Figure 86: Middle East and Africa Market Attractiveness Analysis by Samples
  • Figure 87: Middle East and Africa Market Value Share and BPS Analysis by Application, 2025 and 2035
  • Figure 88: Middle East and Africa Market Y-o-Y Growth Comparison by Application, 2025 to 2035
  • Figure 89: Middle East and Africa Market Attractiveness Analysis by Application
  • Figure 90: Middle East and Africa Market Value Share and BPS Analysis by Sales Channel, 2025 and 2035
  • Figure 91: Middle East and Africa Market Y-o-Y Growth Comparison by Sales Channel, 2025 to 2035
  • Figure 92: Middle East and Africa Market Attractiveness Analysis by Sales Channel
  • Figure 93: Global Market - Tier Structure Analysis
  • Figure 94: Global Market - Company Share Analysis

Frequently Asked Questions

What is the projected size of the Continuous Hormone Monitoring Market by 2035?

The market is expected to reach USD 716.2 million by 2035.

What is the estimated market size of the Continuous Hormone Monitoring Market in 2025?

The market size is projected to be USD 325.7 million in 2025.

What is the CAGR of the Continuous Hormone Monitoring Market from 2025 to 2035?

The market is expected to grow at a CAGR of 8.2% from 2025 to 2035.

Which country is the fastest growing in the Continuous Hormone Monitoring Market?

China is expected to be the fastest growing with a CAGR of 10.4%.

Which country holds the highest market share in the Continuous Hormone Monitoring Market?

Germany holds the highest market share with a CAGR of 8.7%.

Explore Diagnostic Devices Insights

Future Market Insights

Continuous Hormone Monitoring Market