Reports

- Global Locations -

Headquarters

Future Market Insights, Inc.

Christiana Corporate, 200
Continental Drive, Suite 401,
Newark, Delaware - 19713,
United States

T: +1-845-579-5705

Americas

Future Market Insights, Inc.

616 Corporate Way, Suite 2-9018,
Valley Cottage, NY 10989, United States

T: +1-347-918-3531

MEA

Future Market Insights

1602-6 Jumeirah Bay X2 Tower, Plot No: JLT-PH2-X2A,
Jumeirah Lakes Towers, Dubai,
United Arab Emirates

Europe

Future Market Insights

3rd Floor, 207 Regent Street,
W1B 3HH London
United Kingdom

T: + 44 (0) 20 8123 9659
D: +44 (0) 20 3287 4268

Asia Pacific

Future Market Insights

IndiaLand Global Tech Park, Unit UG-1, Behind Grand HighStreet, Phase 1, Hinjawadi, MH, Pune – 411057, India

Continuous Fryer Machine Market Outlook (2023 to 2033)

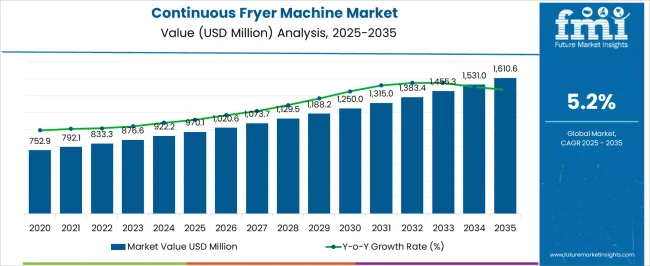
During the estimated time frame from 2023 to 2033, the global continuous fryer machine market is likely to surge at a CAGR of 5.2%. The market is anticipated to be stimulated at US$ 1,455.3 million by 2033 from US$ 876.6 million in 2023.

A continuous fryer is a type of frying machine used in the food industry to fry various types of food products. This type of fryer is mainly equipped with a conveyor belt that moves the food product through the fryer. It can be used to fry various types of food, including chicken, fish, potatoes, and others.

A continuous fryer can be an ideal choice for businesses that need to fry large quantities of food at once. These types of fryers can typically accommodate a range of different size batches. They can also be equipped with numerous features that would help to improve efficiency and safety.

A continuous fryer machine is considered to be a perfect choice for those who want to fry smaller items. It is also a good choice for those who do not want to deal with the mess of frying in a large fryer. The small size of the fryer makes it easy to use and clean. These fryer machines also help to save time in restaurants by providing a constant frying process without pausing.

Rising concerns about fat intake and surging awareness of healthfulness are expected to drive the need for continuous fryer machines across the globe. The growing replacement of traditional deep fryers with air fryers is another crucial factor that would aid growth in the global market.

Moreover, key companies are nowadays coming up with innovative designs of products with novel features to increase sales. They are launching new continuous fryer machines that would require a little amount of oil for frying various food items.

In September 2022, for instance, INALSA unveiled its new Dual Baskets air fryer for the first time in India. It comes with nearly 2100 watts of power and is suitable for preparing full chicken, side dishes, delicious meals, and appetizers. It also includes the dual-zone technology that would help an individual select between the Sync Finish feature.

Attributes Key Insights
Global Continuous Fryer Machine Market Estimated Size (2023E) US$ 876.6 Million
Projected Market Valuation (2033F) US$ 1,455.3 Million
Value-based CAGR (2023 to 2033) 5.2%
Market Share of the US 33.3%

Don't pay for what you don't need

Customize your report by selecting specific countries or regions and save 30%!

2018 to 2022 Continuous Fryer Machine Market Outlook Compared to 2023 to 2033 Demand Forecast

As per FMI, over the past five years, the global market for continuous fryer machines boosted at a fast pace owing to their rising application in various areas. They also have numerous benefits such as ease of processing and consumption of low energy.

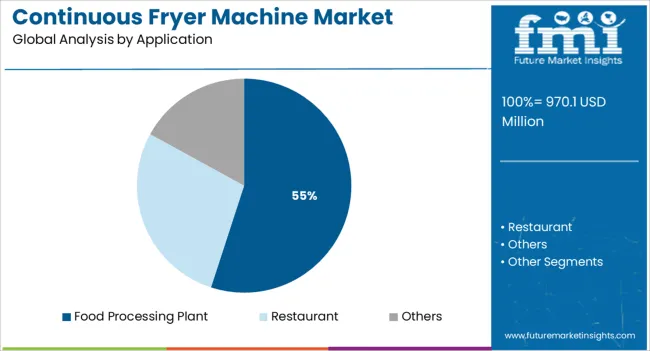
The market for continuous fryer machines is projected to rise at a rapid pace in the forecast period due to the expansion of the global food processing industry. Automatic and semi-automatic continuous fryer machines are extensively used by this particular end user.

However, one of the most common problems that can occur with a continuous fryer is that the heating element can become damaged or broken. If this happens, it can cause the food to cook unevenly or even burn.

In some cases, it may also be necessary to replace the entire fryer. Another problem that can occur is that the oil may not be able to reach the correct temperature, which can also cause uneven cooking or burning.

Market-o-nomics - Highlighting the Key Trends

A large number of crucial factors have been detected to accelerate the continuous fryer machine market. Lead analysts at FMI have evaluated the hindering factors, new opportunities, and threats that can affect growth in the global continuous fryer machine market.

The drivers, restraints, opportunities, and threats (DROTs) identified are as follows:

DRIVERS

  • Increasing demand for advanced deep fryers with timers and alarms from restaurants and cafes is estimated to drive sales.
  • The emergence of automatic deep fryers that can automatically lower or raise the basket in and out from hot oil once the frying process is complete, would aid sales.

RESTRAINTS

  • Battered baby spinach, toast, muffins, popcorn, hamburgers, cheese, and eggs are some of the food items that cannot be prepared in fryer machines.
  • Not every component of continuous air fryers is dishwasher friendly, which may hinder sales.

OPPORTUNITIES

  • Key companies are set to develop unique fryers with ventilation systems meant to exhaust frying odors from the kitchen.
  • The launch of temperature-controlled fryer machines to prevent fires and save energy by constantly adjusting, monitoring, and sensing the temperature would push sales.

THREATS

  • Continuous fryer machines can take up a lot of counter space as they tend to be tall and may not always fit under cabinets.
  • Since continuous fryer machines utilize forced air, they can often be loud and can reach up to nearly 65 decibels.
Nandini Roy Choudhury

Principal Consultant

Talk to Analyst

Find your sweet spots for generating winning opportunities in this market.

Country-wise Insights

How are Continuous Fryer Machine Manufacturers Faring in the US?

“US-based Companies to Launch Innovative Continuous Vacuum Fryers to Attract a Large Consumer Base”

According to FMI, the demand for continuous fryer machines in the US is expected to rise at a CAGR of 38% throughout the forecast period. Since the last few years, the high demand for continuous fryer machines has been compelling US-based manufacturers to come up with new products.

A continuous fryer machine is a type of fryer that can be used to cook large quantities of food at a consistent temperature. This type of fryer is typically used in commercial kitchens, but they are also becoming more popular across the US for home use.

There are different brands and models of continuous fryer machines available in the US market. Thus, key companies are set to face tough competition from local firms across the country during the projected time frame.

Why Are Sales of Continuous Fryer Machines Growing Exponentially in India?

“Sales of Small Kitchen Appliances through Medium-size Companies to Grow Astonishingly across India by 2033”

Due to the rapidly rising population and busy schedules of people, demand for continuous fryer machines has been increasing at regular intervals across India. Small continuous fryers are likely to showcase double-digit growth throughout the evaluation period.

This is further encouraging various medium and small-sized Indian companies to partake in the continuous fryer machine industry. International players are looking to establish their presence in the Indian continuous fryer machine market with the expansion of their distribution channels to improve access to the local market.

How is Germany Controlling the Field of Continuous Fryer Machines across Europe?

“German Companies to Sell Their In-house Kitchen Appliances in Competitive Prices”

Germany is considered to be one of the leading manufacturers of continuous fryer machines in Europe. Numerous German companies have been able to maintain their dominance in the market by investing heavily in research & development activities.

They have also been able to produce high-quality products at competitive prices. Some of the leading German companies have been successful in marketing their products to both retail and food service customers.

These companies have a strong distribution network throughout Europe. They also have a good reputation for customer service and after-sales service. Thus, their aggressive marketing efforts are expected to help Germany to continue to dominate the Europe continuous fryer machine market in the next ten years.

Why is the Demand for Continuous Fryer Machines Surging in the UK?

“Demand for Air Fryer Machines to Grow Astonishingly across UK-based Fast Food Restaurants”

Throughout the assessment period, the UK is expected to generate the lion’s share in the Europe market for continuous fryer machines. The country’s continuous fryer machine industry is set to be pushed by increasing demand for fryers in full-service restaurants, quick-service restaurants, hotels, and cafeterias. The rising establishment of renowned fast food chains like McDonald's, Pizza Express, Greggs, Harvester, and KFC across the country would also contribute to growth.

Category-wise Insights

Which is the Most Preferred Type of Continuous Fryer Machines Worldwide?

“Sales of Electric Fryer Machines to Surge Rapidly with their Ability to Prevent the Risk of Fumes”

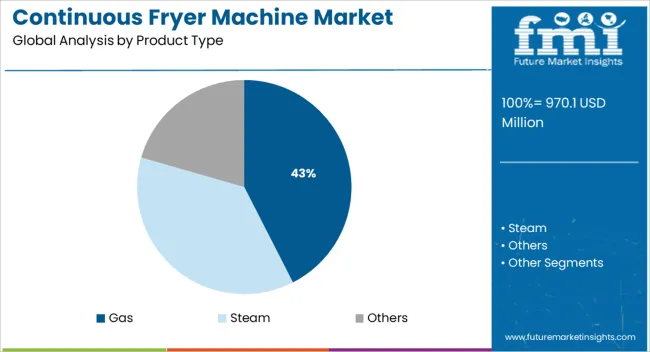
There are many types of continuous fryer machines used in industries across the globe, including gas, steam, and others. Amongst these, the most common type of machine is the gas fryer. These fryers use natural gas or propane to heat the oil. The oil is first heated to a high temperature and then the food is placed in the basket. The food is cooked in hot oil and then drained before it is served.

Another type of continuous fryer machine that is gaining immense popularity nowadays is the electric fryer. These fryers use electricity to heat oil. One of the major advantages of these fryers is that they can be used indoors without the risk of any fumes or odors. Electric fryers are also more efficient than gas fryers, so they use less energy and are relatively low-cost in terms of operation.
Get the data you need at a Fraction of the cost

Personalize your report by choosing insights you need
and save 40%!

Competitive Landscape

New entrants with innovative designs are expected to drive the use of continuous fryer machines in the food service industry across the globe. Renowned companies in the global market are coming up with electric fryers with unique features by conducting extensive research & development activities. Some other companies around the world are striving to fulfill the unmet needs of their clients by providing customized solutions as per their requirements.

For instance,

  • In August 2022, Xiaomi, a renowned China-based manufacturer of consumer electronics, announced the launch of its new Smart Air Fryer 3.5L. It is integrated into the internet of things (IoT) and includes Google Assistant, WIFI connectivity, as well as a wide temperature range.

Scope of the Report

Attribute Details
Estimated Market Size (2023) US$ 876.6 Million
Projected Market Valuation (2033) US$ 1,455.3 Million
Value-based CAGR (2023 to 2033) 5.2%
Forecast Period 2023 to 2033
Historical Data Available for 2018 to 2022
Market Analysis Value (US$ Million)
Key Regions Covered
  • North America
  • Latin America
  • Europe
  • Asia Pacific
  • Oceania
  • Middle East & Africa (MEA)
Key Countries Covered
  • The USA
  • Canada
  • Mexico
  • Germany
  • The UK
  • France
  • Italy
  • Spain
  • China
  • Japan
  • India
  • South Korea
  • Australia
  • Brazil
  • Argentina
  • South Africa
  • UAE
Key Segments Covered
  • Product
  • Type
  • Application
  • Region
Key Companies Profiled
  • Jinan Kelid Machinery
  • TSHS
  • Tianjin hitless machinery
  • QINGDOO tune Machinery
  • Jinan tindo International Co. Ltd.
  • PSG Dallas
  • Nilma
  • Schomaker Convenience Technik
  • Kalyan Machines
  • Ding Han Machinery
  • Zhengzhou Longer Machinery
  • Huaxing Machinery
Report Coverage Market Forecast, Company Share Analysis, Competitive Landscape, DROT Analysis, Market Dynamics and Challenges, and Strategic Growth Initiatives

Continuous Fryer Machine Market Outlook by Category

By Product:

  • Gas
  • Steam
  • Others

By Application:

  • Food Processing Plant
  • Restaurant
  • Others

By Region:

  • North America
  • Latin America
  • Europe
  • East Asia
  • South Asia
  • Oceania
  • Middle East & Africa (MEA)

Frequently Asked Questions

How big is the continuous fryer machine industry?

The continuous fryer machine industry is assessed to be valued at US$ 876.6 Million by the end of 2023.

At what rate is the continuous fryer machine industry expected to rise?

The continuous fryer machine industry is expected to rise at a CAGR of 5.2% in the forecast period.

What is the North America continuous fryer machine industry outlook?

The North American continuous fryer machine industry is expected to register a 38% CAGR between 2023 and 2033.

Which are the major countries driving the demand for continuous fryer machines?

The US, China, Canada, Germany, and Mexico are the major countries driving demand for continuous fryer machines.

At what rate will the China continuous fryer machine industry grow?

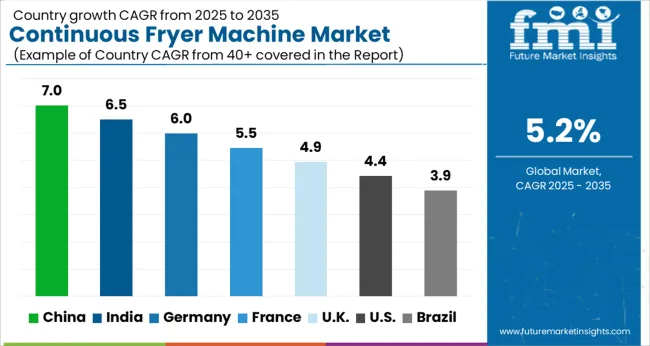
The China continuous fryer machine industry is projected to grow at a CAGR of 6.0% from 2023 to 2033.

At what rate will the UK continuous fryer machine market grow?

The UK continuous fryer machine industry is projected to grow at a CAGR of 5.7% during the assessment period.

At what rate will the India continuous fryer machine industry grow?

The India continuous fryer machine industry is projected to grow at a CAGR of 6.5% in the next ten years

At what rate will the demand for continuous fryer machines grow in the US?

The demand for continuous fryer machines in the US is expected to grow at a rate of 33.3% by 2023.

At what rate will the demand for continuous fryer machines grow in Australia?

The demand for continuous fryer machines in Australia is expected to grow at a rate of 3.0% in 2023.

What is the demand outlook forecast for the continuous fryer machine industry?

The global continuous fryer machine industry is estimated to surpass US$ 1,455.3 Million by the end of 2033.

Table of Content

1. Executive Summary | Continuous Fryer Machine Market

    1.1. Global Market Outlook

    1.2. Demand-side Trends

    1.3. Supply-side Trends

    1.4. Technology Roadmap Analysis

    1.5. Analysis and Recommendations

2. Market Overview

    2.1. Market Coverage / Taxonomy

    2.2. Market Definition / Scope / Limitations

3. Market Background

    3.1. Market Dynamics

        3.1.1. Drivers

        3.1.2. Restraints

        3.1.3. Opportunity

        3.1.4. Trends

    3.2. Scenario Forecast

        3.2.1. Demand in Optimistic Scenario

        3.2.2. Demand in Likely Scenario

        3.2.3. Demand in Conservative Scenario

    3.3. Product launches & Recent Developments

    3.4. Product Life Cycle Analysis

    3.5. Value Chain Analysis

        3.5.1. Supply Side Participants and their Roles

            3.5.1.1. Producers

            3.5.1.2. Mid-Level Participants (Traders / Agents / Brokers)

            3.5.1.3. Wholesalers and Distributors

        3.5.2. % of Operating Margin Analysis

        3.5.3. List of Raw Material Suppliers

        3.5.4. List of Existing and Potential Buyers

    3.6. Global Small continuous fryer Market - Pricing Analysis

        3.6.1. Price Point Assessment by Region

        3.6.2. Price Point Assessment by Product Type

        3.6.3. Price Forecast till 2033

        3.6.4. Factors affecting pricing

    3.7. Forecast Factors - Relevance & Impact

    3.8. PESTLE and Porter’s Analysis

    3.9. Regulatory Landscape

        3.9.1. Packaging & Labelling Regulations

        3.9.2. Certifications and Certifying Agency Overview

        3.9.3. Import/Export Policies

    3.10. Regional Parent Market Outlook

    3.11. Production and Consumption Statistics

    3.12. Import and Export Statistics

    3.13. Consumers Survey Analysis

    3.14. Macro-Economic Factors

    3.15. Product Claims & Nutritional Information scanned by Buyers

4. Global Market Analysis 2018 to 2023 and Forecast, 2023 to 2033 

    4.1. Historical Market Size Value (US$ Million) & Volume (MT) Analysis, 2018 to 2023

    4.2. Current and Future Market Size Value (US$ Million) & Volume (MT) Projections, 2023 to 2033

        4.2.1. Y-o-Y Growth Trend Analysis

        4.2.2. Absolute $ Opportunity Analysis

5. Global Market Analysis 2018 to 2023 and Forecast 2023 to 2033, By Product Type

    5.1. Introduction / Key Findings

    5.2. Historical Market Size Value (US$ Million) & Volume (MT) Analysis By Product Type, 2018 to 2023

    5.3. Current and Future Market Size Value (US$ Million) & Volume (MT) Analysis and Forecast By Product Type, 2023 to 2033

        5.3.1. Gas

        5.3.2. Steam

        5.3.3. Others

    5.4. Y-o-Y Growth Trend Analysis By Product Type, 2018 to 2023

    5.5. Absolute $ Opportunity Analysis By Product Type, 2023 to 2033

6. Global Market Analysis 2018 to 2023 and Forecast 2023 to 2033, By Application

    6.1. Introduction / Key Findings

    6.2. Historical Market Size Value (US$ Million) & Volume (MT) Analysis By Application, 2018 to 2023

    6.3. Current and Future Market Size Value (US$ Million) & Volume (MT) Analysis and Forecast By Application, 2023 to 2033

        6.3.1. Food Processing Plant

        6.3.2. Restaurant

        6.3.3. Others

    6.4. Y-o-Y Growth Trend Analysis By Application, 2018 to 2023

    6.5. Absolute $ Opportunity Analysis By Application, 2023 to 2033

7. Global Market Analysis 2018 to 2023 and Forecast 2023 to 2033, By Region

    7.1. Introduction

    7.2. Historical Market Size Value (US$ Million) & Volume (MT) Analysis By Region, 2018 to 2023

    7.3. Current Market Size Value (US$ Million) & Volume (MT) Analysis and Forecast By Region, 2023 to 2033

        7.3.1. North America

        7.3.2. Latin America

        7.3.3. Europe

        7.3.4. East Asia

        7.3.5. South Asia

        7.3.6. Oceania

        7.3.7. Middle East & Africa (MEA)

    7.4. Market Attractiveness Analysis By Region

8. North America Market Analysis 2018 to 2023 and Forecast 2023 to 2033, By Country

    8.1. Historical Market Size Value (US$ Million) & Volume (MT) Trend Analysis By Market Taxonomy, 2018 to 2023

    8.2. Market Size Value (US$ Million) & Volume (MT) Forecast By Market Taxonomy, 2023 to 2033

        8.2.1. By Country

            8.2.1.1. The US

            8.2.1.2. Canada

        8.2.2. By Product Type

        8.2.3. By Application

    8.3. Market Attractiveness Analysis

        8.3.1. By Country

        8.3.2. By Product Type

        8.3.3. By Application

    8.4. Key Takeaways

9. Latin America Market Analysis 2018 to 2023 and Forecast 2023 to 2033, By Country

    9.1. Historical Market Size Value (US$ Million) & Volume (MT) Trend Analysis By Market Taxonomy, 2018 to 2023

    9.2. Market Size Value (US$ Million) & Volume (MT) Forecast By Market Taxonomy, 2023 to 2033

        9.2.1. By Country

            9.2.1.1. Brazil

            9.2.1.2. Mexico

            9.2.1.3. Argentina

            9.2.1.4. Chile

            9.2.1.5. Peru

            9.2.1.6. Rest of Latin America

        9.2.2. By Product Type

        9.2.3. By Application

    9.3. Market Attractiveness Analysis

        9.3.1. By Country

        9.3.2. By Product Type

        9.3.3. By Application

    9.4. Key Takeaways

10. Europe Market Analysis 2018 to 2023 and Forecast 2023 to 2033, By Country

    10.1. Historical Market Size Value (US$ Million) & Volume (MT) Trend Analysis By Market Taxonomy, 2018 to 2023

    10.2. Market Size Value (US$ Million) & Volume (MT) Forecast By Market Taxonomy, 2023 to 2033

        10.2.1. By Country

            10.2.1.1. Germany

            10.2.1.2. Italy

            10.2.1.3. France

            10.2.1.4. The UK

            10.2.1.5. Spain

            10.2.1.6. Russia

            10.2.1.7. BENELUX

            10.2.1.8. Poland

            10.2.1.9. Nordic Countries

            10.2.1.10. Rest of Europe

        10.2.2. By Product Type

        10.2.3. By Application

    10.3. Market Attractiveness Analysis

        10.3.1. By Country

        10.3.2. By Product Type

        10.3.3. By Application

    10.4. Key Takeaways

11. East Asia Market Analysis 2018 to 2023 and Forecast 2023 to 2033, By Country

    11.1. Historical Market Size Value (US$ Million) & Volume (MT) Trend Analysis By Market Taxonomy, 2018 to 2023

    11.2. Market Size Value (US$ Million) & Volume (MT) Forecast By Market Taxonomy, 2023 to 2033

        11.2.1. By Country

            11.2.1.1. China

            11.2.1.2. Japan

            11.2.1.3. South Korea

        11.2.2. By Product Type

        11.2.3. By Application

    11.3. Market Attractiveness Analysis

        11.3.1. By Country

        11.3.2. By Product Type

        11.3.3. By Application

    11.4. Key Takeaways

12. South Asia Market Analysis 2018 to 2023 and Forecast 2023 to 2033, By Country

    12.1. Historical Market Size Value (US$ Million) & Volume (MT) Trend Analysis By Market Taxonomy, 2018 to 2023

    12.2. Market Size Value (US$ Million) & Volume (MT) Forecast By Market Taxonomy, 2023 to 2033

        12.2.1. By Country

            12.2.1.1. India

            12.2.1.2. Thailand

            12.2.1.3. Malaysia

            12.2.1.4. Indonesia

            12.2.1.5. Singapore

            12.2.1.6. Rest of South Asia

        12.2.2. By Product Type

        12.2.3. By Application

    12.3. Market Attractiveness Analysis

        12.3.1. By Country

        12.3.2. By Product Type

        12.3.3. By Application

    12.4. Key Takeaways

13. Oceania Market Analysis 2018 to 2023 and Forecast 2023 to 2033, By Country

    13.1. Historical Market Size Value (US$ Million) & Volume (MT) Trend Analysis By Market Taxonomy, 2018 to 2023

    13.2. Market Size Value (US$ Million) & Volume (MT) Forecast By Market Taxonomy, 2023 to 2033

        13.2.1. By Country

            13.2.1.1. Australia

            13.2.1.2. New Zealand

        13.2.2. By Product Type

        13.2.3. By Application

    13.3. Market Attractiveness Analysis

        13.3.1. By Country

        13.3.2. By Product Type

        13.3.3. By Application

    13.4. Key Takeaways

14. MEA Market Analysis 2018 to 2023 and Forecast 2023 to 2033, By Country

    14.1. Historical Market Size Value (US$ Million) & Volume (MT) Trend Analysis By Market Taxonomy, 2018 to 2023

    14.2. Market Size Value (US$ Million) & Volume (MT) Forecast By Market Taxonomy, 2023 to 2033

        14.2.1. By Country

            14.2.1.1. GCC Countries

            14.2.1.2. South Africa

            14.2.1.3. Central Africa

            14.2.1.4. North Africa

        14.2.2. By Product Type

        14.2.3. By Application

    14.3. Market Attractiveness Analysis

        14.3.1. By Country

        14.3.2. By Product Type

        14.3.3. By Application

    14.4. Key Takeaways

15. Key Countries Market Analysis

    15.1. The US

        15.1.1. Pricing Analysis

        15.1.2. Market Share Analysis, 2022

            15.1.2.1. By Product Type

            15.1.2.2. By Application

    15.2. Canada

        15.2.1. Pricing Analysis

        15.2.2. Market Share Analysis, 2022

            15.2.2.1. By Product Type

            15.2.2.2. By Application

    15.3. Brazil

        15.3.1. Pricing Analysis

        15.3.2. Market Share Analysis, 2022

            15.3.2.1. By Product Type

            15.3.2.2. By Application

    15.4. Mexico

        15.4.1. Pricing Analysis

        15.4.2. Market Share Analysis, 2022

            15.4.2.1. By Product Type

            15.4.2.2. By Application

    15.5. Argentina

        15.5.1. Pricing Analysis

        15.5.2. Market Share Analysis, 2022

            15.5.2.1. By Product Type

            15.5.2.2. By Application

    15.6. Chile

        15.6.1. Pricing Analysis

        15.6.2. Market Share Analysis, 2022

            15.6.2.1. By Product Type

            15.6.2.2. By Application

    15.7. Peru

        15.7.1. Pricing Analysis

        15.7.2. Market Share Analysis, 2022

            15.7.2.1. By Product Type

            15.7.2.2. By Application

    15.8. Germany

        15.8.1. Pricing Analysis

        15.8.2. Market Share Analysis, 2022

            15.8.2.1. By Product Type

            15.8.2.2. By Application

    15.9. Italy

        15.9.1. Pricing Analysis

        15.9.2. Market Share Analysis, 2022

            15.9.2.1. By Product Type

            15.9.2.2. By Application

    15.10. France

        15.10.1. Pricing Analysis

        15.10.2. Market Share Analysis, 2022

            15.10.2.1. By Product Type

            15.10.2.2. By Application

    15.11. Spain

        15.11.1. Pricing Analysis

        15.11.2. Market Share Analysis, 2022

            15.11.2.1. By Product Type

            15.11.2.2. By Application

    15.12. The UK

        15.12.1. Pricing Analysis

        15.12.2. Market Share Analysis, 2022

            15.12.2.1. By Product Type

            15.12.2.2. By Application

    15.13. Russia

        15.13.1. Pricing Analysis

        15.13.2. Market Share Analysis, 2022

            15.13.2.1. By Product Type

            15.13.2.2. By Application

    15.14. Poland

        15.14.1. Pricing Analysis

        15.14.2. Market Share Analysis, 2022

            15.14.2.1. By Product Type

            15.14.2.2. By Application

    15.15. BENELUX

        15.15.1. Pricing Analysis

        15.15.2. Market Share Analysis, 2022

            15.15.2.1. By Product Type

            15.15.2.2. By Application

    15.16. Nordic Countries

        15.16.1. Pricing Analysis

        15.16.2. Market Share Analysis, 2022

            15.16.2.1. By Product Type

            15.16.2.2. By Application

    15.17. China

        15.17.1. Pricing Analysis

        15.17.2. Market Share Analysis, 2022

            15.17.2.1. By Product Type

            15.17.2.2. By Application

    15.18. Japan

        15.18.1. Pricing Analysis

        15.18.2. Market Share Analysis, 2022

            15.18.2.1. By Product Type

            15.18.2.2. By Application

    15.19. South Korea

        15.19.1. Pricing Analysis

        15.19.2. Market Share Analysis, 2022

            15.19.2.1. By Product Type

            15.19.2.2. By Application

    15.20. India

        15.20.1. Pricing Analysis

        15.20.2. Market Share Analysis, 2022

            15.20.2.1. By Product Type

            15.20.2.2. By Application

    15.21. Thailand

        15.21.1. Pricing Analysis

        15.21.2. Market Share Analysis, 2022

            15.21.2.1. By Product Type

            15.21.2.2. By Application

    15.22. Indonesia

        15.22.1. Pricing Analysis

        15.22.2. Market Share Analysis, 2022

            15.22.2.1. By Product Type

            15.22.2.2. By Application

    15.23. Malaysia

        15.23.1. Pricing Analysis

        15.23.2. Market Share Analysis, 2022

            15.23.2.1. By Product Type

            15.23.2.2. By Application

    15.24. Singapore

        15.24.1. Pricing Analysis

        15.24.2. Market Share Analysis, 2022

            15.24.2.1. By Product Type

            15.24.2.2. By Application

    15.25. Australia

        15.25.1. Pricing Analysis

        15.25.2. Market Share Analysis, 2022

            15.25.2.1. By Product Type

            15.25.2.2. By Application

    15.26. New Zealand

        15.26.1. Pricing Analysis

        15.26.2. Market Share Analysis, 2022

            15.26.2.1. By Product Type

            15.26.2.2. By Application

    15.27. GCC Countries

        15.27.1. Pricing Analysis

        15.27.2. Market Share Analysis, 2022

            15.27.2.1. By Product Type

            15.27.2.2. By Application

    15.28. South Africa

        15.28.1. Pricing Analysis

        15.28.2. Market Share Analysis, 2022

            15.28.2.1. By Product Type

            15.28.2.2. By Application

    15.29. North Africa

        15.29.1. Pricing Analysis

        15.29.2. Market Share Analysis, 2022

            15.29.2.1. By Product Type

            15.29.2.2. By Application

    15.30. Central Africa

        15.30.1. Pricing Analysis

        15.30.2. Market Share Analysis, 2022

            15.30.2.1. By Product Type

            15.30.2.2. By Application

16. Market Structure Analysis

    16.1. Competition Dashboard

    16.2. Competition Benchmarking

    16.3. Market Share Analysis of Top Players

        16.3.1. By Regional

        16.3.2. By Product Type

        16.3.3. By Application

17. Competition Analysis

    17.1. Competition Deep Dive

        17.1.1. EMA Europe

            17.1.1.1. Overview

            17.1.1.2. Product Portfolio

            17.1.1.3. Profitability by Market Segments (Product / Age / Sales Channel / Region)

            17.1.1.4. Sales Footprint

            17.1.1.5. Strategy Overview

                17.1.1.5.1. Marketing Strategy

                17.1.1.5.2. Product Strategy

                17.1.1.5.3. Channel Strategy

        17.1.2. Tecnofryer

            17.1.2.1. Overview

            17.1.2.2. Product Portfolio

            17.1.2.3. Profitability by Market Segments (Product / Age / Sales Channel / Region)

            17.1.2.4. Sales Footprint

            17.1.2.5. Strategy Overview

                17.1.2.5.1. Marketing Strategy

                17.1.2.5.2. Product Strategy

                17.1.2.5.3. Channel Strategy

        17.1.3. SunMax

            17.1.3.1. Overview

            17.1.3.2. Product Portfolio

            17.1.3.3. Profitability by Market Segments (Product / Age / Sales Channel / Region)

            17.1.3.4. Sales Footprint

            17.1.3.5. Strategy Overview

                17.1.3.5.1. Marketing Strategy

                17.1.3.5.2. Product Strategy

                17.1.3.5.3. Channel Strategy

        17.1.4. TJF

            17.1.4.1. Overview

            17.1.4.2. Product Portfolio

            17.1.4.3. Profitability by Market Segments (Product / Age / Sales Channel / Region)

            17.1.4.4. Sales Footprint

            17.1.4.5. Strategy Overview

                17.1.4.5.1. Marketing Strategy

                17.1.4.5.2. Product Strategy

                17.1.4.5.3. Channel Strategy

        17.1.5. Pacific

            17.1.5.1. Overview

            17.1.5.2. Product Portfolio

            17.1.5.3. Profitability by Market Segments (Product / Age / Sales Channel / Region)

            17.1.5.4. Sales Footprint

            17.1.5.5. Strategy Overview

                17.1.5.5.1. Marketing Strategy

                17.1.5.5.2. Product Strategy

                17.1.5.5.3. Channel Strategy

        17.1.6. Heat and Control

            17.1.6.1. Overview

            17.1.6.2. Product Portfolio

            17.1.6.3. Profitability by Market Segments (Product / Age / Sales Channel / Region)

            17.1.6.4. Sales Footprint

            17.1.6.5. Strategy Overview

                17.1.6.5.1. Marketing Strategy

                17.1.6.5.2. Product Strategy

                17.1.6.5.3. Channel Strategy

        17.1.7. M.Serra, FMT

            17.1.7.1. Overview

            17.1.7.2. Product Portfolio

            17.1.7.3. Profitability by Market Segments (Product / Age / Sales Channel / Region)

            17.1.7.4. Sales Footprint

            17.1.7.5. Strategy Overview

                17.1.7.5.1. Marketing Strategy

                17.1.7.5.2. Product Strategy

                17.1.7.5.3. Channel Strategy

        17.1.8. PSG Dallas

            17.1.8.1. Overview

            17.1.8.2. Product Portfolio

            17.1.8.3. Profitability by Market Segments (Product / Age / Sales Channel / Region)

            17.1.8.4. Sales Footprint

            17.1.8.5. Strategy Overview

                17.1.8.5.1. Marketing Strategy

                17.1.8.5.2. Product Strategy

                17.1.8.5.3. Channel Strategy

        17.1.9. Nilma

            17.1.9.1. Overview

            17.1.9.2. Product Portfolio

            17.1.9.3. Profitability by Market Segments (Product / Age / Sales Channel / Region)

            17.1.9.4. Sales Footprint

            17.1.9.5. Strategy Overview

                17.1.9.5.1. Marketing Strategy

                17.1.9.5.2. Product Strategy

                17.1.9.5.3. Channel Strategy

        17.1.10. Schomaker Convenience Technik

            17.1.10.1. Overview

            17.1.10.2. Product Portfolio

            17.1.10.3. Profitability by Market Segments (Product / Age / Sales Channel / Region)

            17.1.10.4. Sales Footprint

            17.1.10.5. Strategy Overview

                17.1.10.5.1. Marketing Strategy

                17.1.10.5.2. Product Strategy

                17.1.10.5.3. Channel Strategy

        17.1.11. Tna

            17.1.11.1. Overview

            17.1.11.2. Product Portfolio

            17.1.11.3. Profitability by Market Segments (Product / Age / Sales Channel / Region)

            17.1.11.4. Sales Footprint

            17.1.11.5. Strategy Overview

                17.1.11.5.1. Marketing Strategy

                17.1.11.5.2. Product Strategy

                17.1.11.5.3. Channel Strategy

        17.1.12. Kalyan Machine Markets

            17.1.12.1. Overview

            17.1.12.2. Product Portfolio

            17.1.12.3. Profitability by Market Segments (Product / Age / Sales Channel / Region)

            17.1.12.4. Sales Footprint

            17.1.12.5. Strategy Overview

                17.1.12.5.1. Marketing Strategy

                17.1.12.5.2. Product Strategy

                17.1.12.5.3. Channel Strategy

        17.1.13. Ding Han Machine Markets

            17.1.13.1. Overview

            17.1.13.2. Product Portfolio

            17.1.13.3. Profitability by Market Segments (Product / Age / Sales Channel / Region)

            17.1.13.4. Sales Footprint

            17.1.13.5. Strategy Overview

                17.1.13.5.1. Marketing Strategy

                17.1.13.5.2. Product Strategy

                17.1.13.5.3. Channel Strategy

        17.1.14. Zhengzhou Longer Machine Markets

            17.1.14.1. Overview

            17.1.14.2. Product Portfolio

            17.1.14.3. Profitability by Market Segments (Product / Age / Sales Channel / Region)

            17.1.14.4. Sales Footprint

            17.1.14.5. Strategy Overview

                17.1.14.5.1. Marketing Strategy

                17.1.14.5.2. Product Strategy

                17.1.14.5.3. Channel Strategy

        17.1.15. Huaxing Machine Markets

            17.1.15.1. Overview

            17.1.15.2. Product Portfolio

            17.1.15.3. Profitability by Market Segments (Product / Age / Sales Channel / Region)

            17.1.15.4. Sales Footprint

            17.1.15.5. Strategy Overview

                17.1.15.5.1. Marketing Strategy

                17.1.15.5.2. Product Strategy

                17.1.15.5.3. Channel Strategy

18. Assumptions & Acronyms Used

19. Research Methodology

List of Tables

Table 1: Global Market Value (US$ Million) Forecast by Region, 2018 to 2033

Table 2: Global Market Volume (MT) Forecast by Region, 2018 to 2033

Table 3: Global Market Value (US$ Million) Forecast by Product Type, 2018 to 2033

Table 4: Global Market Volume (MT) Forecast by Product Type, 2018 to 2033

Table 5: Global Market Value (US$ Million) Forecast by Application, 2018 to 2033

Table 6: Global Market Volume (MT) Forecast by Application, 2018 to 2033

Table 7: North America Market Value (US$ Million) Forecast by Country, 2018 to 2033

Table 8: North America Market Volume (MT) Forecast by Country, 2018 to 2033

Table 9: North America Market Value (US$ Million) Forecast by Product Type, 2018 to 2033

Table 10: North America Market Volume (MT) Forecast by Product Type, 2018 to 2033

Table 11: North America Market Value (US$ Million) Forecast by Application, 2018 to 2033

Table 12: North America Market Volume (MT) Forecast by Application, 2018 to 2033

Table 13: Latin America Market Value (US$ Million) Forecast by Country, 2018 to 2033

Table 14: Latin America Market Volume (MT) Forecast by Country, 2018 to 2033

Table 15: Latin America Market Value (US$ Million) Forecast by Product Type, 2018 to 2033

Table 16: Latin America Market Volume (MT) Forecast by Product Type, 2018 to 2033

Table 17: Latin America Market Value (US$ Million) Forecast by Application, 2018 to 2033

Table 18: Latin America Market Volume (MT) Forecast by Application, 2018 to 2033

Table 19: Europe Market Value (US$ Million) Forecast by Country, 2018 to 2033

Table 20: Europe Market Volume (MT) Forecast by Country, 2018 to 2033

Table 21: Europe Market Value (US$ Million) Forecast by Product Type, 2018 to 2033

Table 22: Europe Market Volume (MT) Forecast by Product Type, 2018 to 2033

Table 23: Europe Market Value (US$ Million) Forecast by Application, 2018 to 2033

Table 24: Europe Market Volume (MT) Forecast by Application, 2018 to 2033

Table 25: East Asia Market Value (US$ Million) Forecast by Country, 2018 to 2033

Table 26: East Asia Market Volume (MT) Forecast by Country, 2018 to 2033

Table 27: East Asia Market Value (US$ Million) Forecast by Product Type, 2018 to 2033

Table 28: East Asia Market Volume (MT) Forecast by Product Type, 2018 to 2033

Table 29: East Asia Market Value (US$ Million) Forecast by Application, 2018 to 2033

Table 30: East Asia Market Volume (MT) Forecast by Application, 2018 to 2033

Table 31: South Asia Market Value (US$ Million) Forecast by Country, 2018 to 2033

Table 32: South Asia Market Volume (MT) Forecast by Country, 2018 to 2033

Table 33: South Asia Market Value (US$ Million) Forecast by Product Type, 2018 to 2033

Table 34: South Asia Market Volume (MT) Forecast by Product Type, 2018 to 2033

Table 35: South Asia Market Value (US$ Million) Forecast by Application, 2018 to 2033

Table 36: South Asia Market Volume (MT) Forecast by Application, 2018 to 2033

Table 37: Oceania Market Value (US$ Million) Forecast by Country, 2018 to 2033

Table 38: Oceania Market Volume (MT) Forecast by Country, 2018 to 2033

Table 39: Oceania Market Value (US$ Million) Forecast by Product Type, 2018 to 2033

Table 40: Oceania Market Volume (MT) Forecast by Product Type, 2018 to 2033

Table 41: Oceania Market Value (US$ Million) Forecast by Application, 2018 to 2033

Table 42: Oceania Market Volume (MT) Forecast by Application, 2018 to 2033

Table 43: MEA Market Value (US$ Million) Forecast by Country, 2018 to 2033

Table 44: MEA Market Volume (MT) Forecast by Country, 2018 to 2033

Table 45: MEA Market Value (US$ Million) Forecast by Product Type, 2018 to 2033

Table 46: MEA Market Volume (MT) Forecast by Product Type, 2018 to 2033

Table 47: MEA Market Value (US$ Million) Forecast by Application, 2018 to 2033

Table 48: MEA Market Volume (MT) Forecast by Application, 2018 to 2033

List of Charts

Figure 1: Global Market Value (US$ Million) by Product Type, 2023 to 2033

Figure 2: Global Market Value (US$ Million) by Application, 2023 to 2033

Figure 3: Global Market Value (US$ Million) by Region, 2023 to 2033

Figure 4: Global Market Value (US$ Million) Analysis by Region, 2018 to 2033

Figure 5: Global Market Volume (MT) Analysis by Region, 2018 to 2033

Figure 6: Global Market Value Share (%) and BPS Analysis by Region, 2023 to 2033

Figure 7: Global Market Y-o-Y Growth (%) Projections by Region, 2023 to 2033

Figure 8: Global Market Value (US$ Million) Analysis by Product Type, 2018 to 2033

Figure 9: Global Market Volume (MT) Analysis by Product Type, 2018 to 2033

Figure 10: Global Market Value Share (%) and BPS Analysis by Product Type, 2023 to 2033

Figure 11: Global Market Y-o-Y Growth (%) Projections by Product Type, 2023 to 2033

Figure 12: Global Market Value (US$ Million) Analysis by Application, 2018 to 2033

Figure 13: Global Market Volume (MT) Analysis by Application, 2018 to 2033

Figure 14: Global Market Value Share (%) and BPS Analysis by Application, 2023 to 2033

Figure 15: Global Market Y-o-Y Growth (%) Projections by Application, 2023 to 2033

Figure 16: Global Market Attractiveness by Product Type, 2023 to 2033

Figure 17: Global Market Attractiveness by Application, 2023 to 2033

Figure 18: Global Market Attractiveness by Region, 2023 to 2033

Figure 19: North America Market Value (US$ Million) by Product Type, 2023 to 2033

Figure 20: North America Market Value (US$ Million) by Application, 2023 to 2033

Figure 21: North America Market Value (US$ Million) by Country, 2023 to 2033

Figure 22: North America Market Value (US$ Million) Analysis by Country, 2018 to 2033

Figure 23: North America Market Volume (MT) Analysis by Country, 2018 to 2033

Figure 24: North America Market Value Share (%) and BPS Analysis by Country, 2023 to 2033

Figure 25: North America Market Y-o-Y Growth (%) Projections by Country, 2023 to 2033

Figure 26: North America Market Value (US$ Million) Analysis by Product Type, 2018 to 2033

Figure 27: North America Market Volume (MT) Analysis by Product Type, 2018 to 2033

Figure 28: North America Market Value Share (%) and BPS Analysis by Product Type, 2023 to 2033

Figure 29: North America Market Y-o-Y Growth (%) Projections by Product Type, 2023 to 2033

Figure 30: North America Market Value (US$ Million) Analysis by Application, 2018 to 2033

Figure 31: North America Market Volume (MT) Analysis by Application, 2018 to 2033

Figure 32: North America Market Value Share (%) and BPS Analysis by Application, 2023 to 2033

Figure 33: North America Market Y-o-Y Growth (%) Projections by Application, 2023 to 2033

Figure 34: North America Market Attractiveness by Product Type, 2023 to 2033

Figure 35: North America Market Attractiveness by Application, 2023 to 2033

Figure 36: North America Market Attractiveness by Country, 2023 to 2033

Figure 37: Latin America Market Value (US$ Million) by Product Type, 2023 to 2033

Figure 38: Latin America Market Value (US$ Million) by Application, 2023 to 2033

Figure 39: Latin America Market Value (US$ Million) by Country, 2023 to 2033

Figure 40: Latin America Market Value (US$ Million) Analysis by Country, 2018 to 2033

Figure 41: Latin America Market Volume (MT) Analysis by Country, 2018 to 2033

Figure 42: Latin America Market Value Share (%) and BPS Analysis by Country, 2023 to 2033

Figure 43: Latin America Market Y-o-Y Growth (%) Projections by Country, 2023 to 2033

Figure 44: Latin America Market Value (US$ Million) Analysis by Product Type, 2018 to 2033

Figure 45: Latin America Market Volume (MT) Analysis by Product Type, 2018 to 2033

Figure 46: Latin America Market Value Share (%) and BPS Analysis by Product Type, 2023 to 2033

Figure 47: Latin America Market Y-o-Y Growth (%) Projections by Product Type, 2023 to 2033

Figure 48: Latin America Market Value (US$ Million) Analysis by Application, 2018 to 2033

Figure 49: Latin America Market Volume (MT) Analysis by Application, 2018 to 2033

Figure 50: Latin America Market Value Share (%) and BPS Analysis by Application, 2023 to 2033

Figure 51: Latin America Market Y-o-Y Growth (%) Projections by Application, 2023 to 2033

Figure 52: Latin America Market Attractiveness by Product Type, 2023 to 2033

Figure 53: Latin America Market Attractiveness by Application, 2023 to 2033

Figure 54: Latin America Market Attractiveness by Country, 2023 to 2033

Figure 55: Europe Market Value (US$ Million) by Product Type, 2023 to 2033

Figure 56: Europe Market Value (US$ Million) by Application, 2023 to 2033

Figure 57: Europe Market Value (US$ Million) by Country, 2023 to 2033

Figure 58: Europe Market Value (US$ Million) Analysis by Country, 2018 to 2033

Figure 59: Europe Market Volume (MT) Analysis by Country, 2018 to 2033

Figure 60: Europe Market Value Share (%) and BPS Analysis by Country, 2023 to 2033

Figure 61: Europe Market Y-o-Y Growth (%) Projections by Country, 2023 to 2033

Figure 62: Europe Market Value (US$ Million) Analysis by Product Type, 2018 to 2033

Figure 63: Europe Market Volume (MT) Analysis by Product Type, 2018 to 2033

Figure 64: Europe Market Value Share (%) and BPS Analysis by Product Type, 2023 to 2033

Figure 65: Europe Market Y-o-Y Growth (%) Projections by Product Type, 2023 to 2033

Figure 66: Europe Market Value (US$ Million) Analysis by Application, 2018 to 2033

Figure 67: Europe Market Volume (MT) Analysis by Application, 2018 to 2033

Figure 68: Europe Market Value Share (%) and BPS Analysis by Application, 2023 to 2033

Figure 69: Europe Market Y-o-Y Growth (%) Projections by Application, 2023 to 2033

Figure 70: Europe Market Attractiveness by Product Type, 2023 to 2033

Figure 71: Europe Market Attractiveness by Application, 2023 to 2033

Figure 72: Europe Market Attractiveness by Country, 2023 to 2033

Figure 73: East Asia Market Value (US$ Million) by Product Type, 2023 to 2033

Figure 74: East Asia Market Value (US$ Million) by Application, 2023 to 2033

Figure 75: East Asia Market Value (US$ Million) by Country, 2023 to 2033

Figure 76: East Asia Market Value (US$ Million) Analysis by Country, 2018 to 2033

Figure 77: East Asia Market Volume (MT) Analysis by Country, 2018 to 2033

Figure 78: East Asia Market Value Share (%) and BPS Analysis by Country, 2023 to 2033

Figure 79: East Asia Market Y-o-Y Growth (%) Projections by Country, 2023 to 2033

Figure 80: East Asia Market Value (US$ Million) Analysis by Product Type, 2018 to 2033

Figure 81: East Asia Market Volume (MT) Analysis by Product Type, 2018 to 2033

Figure 82: East Asia Market Value Share (%) and BPS Analysis by Product Type, 2023 to 2033

Figure 83: East Asia Market Y-o-Y Growth (%) Projections by Product Type, 2023 to 2033

Figure 84: East Asia Market Value (US$ Million) Analysis by Application, 2018 to 2033

Figure 85: East Asia Market Volume (MT) Analysis by Application, 2018 to 2033

Figure 86: East Asia Market Value Share (%) and BPS Analysis by Application, 2023 to 2033

Figure 87: East Asia Market Y-o-Y Growth (%) Projections by Application, 2023 to 2033

Figure 88: East Asia Market Attractiveness by Product Type, 2023 to 2033

Figure 89: East Asia Market Attractiveness by Application, 2023 to 2033

Figure 90: East Asia Market Attractiveness by Country, 2023 to 2033

Figure 91: South Asia Market Value (US$ Million) by Product Type, 2023 to 2033

Figure 92: South Asia Market Value (US$ Million) by Application, 2023 to 2033

Figure 93: South Asia Market Value (US$ Million) by Country, 2023 to 2033

Figure 94: South Asia Market Value (US$ Million) Analysis by Country, 2018 to 2033

Figure 95: South Asia Market Volume (MT) Analysis by Country, 2018 to 2033

Figure 96: South Asia Market Value Share (%) and BPS Analysis by Country, 2023 to 2033

Figure 97: South Asia Market Y-o-Y Growth (%) Projections by Country, 2023 to 2033

Figure 98: South Asia Market Value (US$ Million) Analysis by Product Type, 2018 to 2033

Figure 99: South Asia Market Volume (MT) Analysis by Product Type, 2018 to 2033

Figure 100: South Asia Market Value Share (%) and BPS Analysis by Product Type, 2023 to 2033

Figure 101: South Asia Market Y-o-Y Growth (%) Projections by Product Type, 2023 to 2033

Figure 102: South Asia Market Value (US$ Million) Analysis by Application, 2018 to 2033

Figure 103: South Asia Market Volume (MT) Analysis by Application, 2018 to 2033

Figure 104: South Asia Market Value Share (%) and BPS Analysis by Application, 2023 to 2033

Figure 105: South Asia Market Y-o-Y Growth (%) Projections by Application, 2023 to 2033

Figure 106: South Asia Market Attractiveness by Product Type, 2023 to 2033

Figure 107: South Asia Market Attractiveness by Application, 2023 to 2033

Figure 108: South Asia Market Attractiveness by Country, 2023 to 2033

Figure 109: Oceania Market Value (US$ Million) by Product Type, 2023 to 2033

Figure 110: Oceania Market Value (US$ Million) by Application, 2023 to 2033

Figure 111: Oceania Market Value (US$ Million) by Country, 2023 to 2033

Figure 112: Oceania Market Value (US$ Million) Analysis by Country, 2018 to 2033

Figure 113: Oceania Market Volume (MT) Analysis by Country, 2018 to 2033

Figure 114: Oceania Market Value Share (%) and BPS Analysis by Country, 2023 to 2033

Figure 115: Oceania Market Y-o-Y Growth (%) Projections by Country, 2023 to 2033

Figure 116: Oceania Market Value (US$ Million) Analysis by Product Type, 2018 to 2033

Figure 117: Oceania Market Volume (MT) Analysis by Product Type, 2018 to 2033

Figure 118: Oceania Market Value Share (%) and BPS Analysis by Product Type, 2023 to 2033

Figure 119: Oceania Market Y-o-Y Growth (%) Projections by Product Type, 2023 to 2033

Figure 120: Oceania Market Value (US$ Million) Analysis by Application, 2018 to 2033

Figure 121: Oceania Market Volume (MT) Analysis by Application, 2018 to 2033

Figure 122: Oceania Market Value Share (%) and BPS Analysis by Application, 2023 to 2033

Figure 123: Oceania Market Y-o-Y Growth (%) Projections by Application, 2023 to 2033

Figure 124: Oceania Market Attractiveness by Product Type, 2023 to 2033

Figure 125: Oceania Market Attractiveness by Application, 2023 to 2033

Figure 126: Oceania Market Attractiveness by Country, 2023 to 2033

Figure 127: MEA Market Value (US$ Million) by Product Type, 2023 to 2033

Figure 128: MEA Market Value (US$ Million) by Application, 2023 to 2033

Figure 129: MEA Market Value (US$ Million) by Country, 2023 to 2033

Figure 130: MEA Market Value (US$ Million) Analysis by Country, 2018 to 2033

Figure 131: MEA Market Volume (MT) Analysis by Country, 2018 to 2033

Figure 132: MEA Market Value Share (%) and BPS Analysis by Country, 2023 to 2033

Figure 133: MEA Market Y-o-Y Growth (%) Projections by Country, 2023 to 2033

Figure 134: MEA Market Value (US$ Million) Analysis by Product Type, 2018 to 2033

Figure 135: MEA Market Volume (MT) Analysis by Product Type, 2018 to 2033

Figure 136: MEA Market Value Share (%) and BPS Analysis by Product Type, 2023 to 2033

Figure 137: MEA Market Y-o-Y Growth (%) Projections by Product Type, 2023 to 2033

Figure 138: MEA Market Value (US$ Million) Analysis by Application, 2018 to 2033

Figure 139: MEA Market Volume (MT) Analysis by Application, 2018 to 2033

Figure 140: MEA Market Value Share (%) and BPS Analysis by Application, 2023 to 2033

Figure 141: MEA Market Y-o-Y Growth (%) Projections by Application, 2023 to 2033

Figure 142: MEA Market Attractiveness by Product Type, 2023 to 2033

Figure 143: MEA Market Attractiveness by Application, 2023 to 2033

Figure 144: MEA Market Attractiveness by Country, 2023 to 2033

Recommendations

Process Automation

Chicken Plucking Machine Market

Published : January 2023

Process Automation

Commercial Cookers Market

Published : December 2022

Process Automation

Commercial Dishwasher Market

Published : December 2022

Process Automation

Restaurant Equipment Market

Published : December 2022

Explore Food and Beverage Insights

View Reports

Continuous Fryer Machine Market