Continuous Ketone Monitoring Market Size and Share Forecast Outlook (2025 to 2035)

The Continuous Ketone Monitoring Market is estimated to be valued at USD 152.9 million in 2025 and is projected to reach USD 347.3 million by 2035, registering a compound annual growth rate (CAGR) of 8.6% over the forecast period.
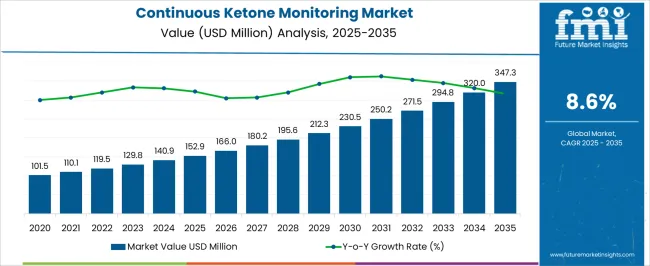
Quick Stats for Continuous Ketone Monitoring Market

  • Continuous Ketone Monitoring Market Industry Value (2025): USD 152.9 million
  • Continuous Ketone Monitoring Market Forecast Value (2035): USD 347.3 million
  • Continuous Ketone Monitoring Market Forecast CAGR: 8.6%
  • Leading Segment in Continuous Ketone Monitoring Market in 2025: Blood Ketone Monitoring (36.8%)
  • Key Growth Region in Continuous Ketone Monitoring Market: North America, Asia-Pacific, Europe
  • Top Key Players in Continuous Ketone Monitoring Market: Abbott Laboratories, ACON Laboratories, Nipro Corporation, Keto-Mojo, PortaCheck Inc., Nova Biomedical, GlucoRx Limited, EKF Diagnostics Holdings, Bruno MD, ForeCare Inc.

Continuous Ketone Monitoring Market Market Value Analysis

Metric Value
Continuous Ketone Monitoring Market Estimated Value in (2025 E) USD 152.9 million
Continuous Ketone Monitoring Market Forecast Value in (2035 F) USD 347.3 million
Forecast CAGR (2025 to 2035) 8.6%

Rationale for Segmental Growth in the Continuous Ketone Monitoring Market

The Continuous Ketone Monitoring market is experiencing strong growth, driven by increasing awareness of ketone levels in the management of diabetes, obesity, and metabolic disorders. The adoption of continuous monitoring systems is being fueled by the need for real-time, accurate measurements that enable timely interventions and improved patient outcomes. Advances in sensor technology, wearable devices, and cloud-based health analytics are enhancing device performance, reliability, and usability.

Integration with digital health platforms and mobile applications allows for seamless tracking, personalized insights, and remote monitoring by healthcare providers. Growing investment in healthcare infrastructure, particularly in hospitals and specialized clinics, is supporting broader market adoption. The focus on patient-centered care, preventive healthcare, and early detection of metabolic irregularities is further accelerating demand.

As the prevalence of lifestyle-related diseases rises globally and the emphasis on proactive disease management increases, continuous ketone monitoring devices are expected to gain wider acceptance Ongoing research and innovation in non-invasive sensing technologies, improved accuracy, and extended device lifespan are likely to drive sustained growth in the market over the coming decade.
Segmental Analysis

Insights into the Blood Ketone Monitoring Product Segment

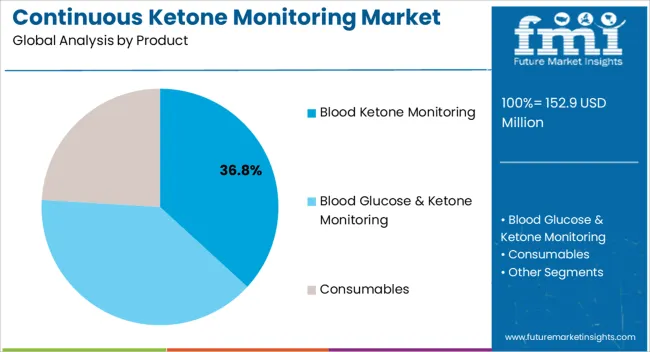
Continuous Ketone Monitoring Market Analysis By Product

The blood ketone monitoring product segment is projected to hold 36.8% of the market revenue in 2025, establishing it as the leading product category. Growth is being driven by the high accuracy and reliability of blood-based measurements, which are essential for effective management of diabetes and metabolic disorders. Continuous monitoring of blood ketone levels allows timely interventions, reducing the risk of complications such as diabetic ketoacidosis.

The integration of advanced biosensors and digital reporting tools has enhanced usability and patient adherence. Real-time data can be shared with healthcare providers, supporting personalized treatment plans and preventive care strategies. The scalability and compatibility of blood ketone monitoring devices with wearable platforms further reinforce adoption.

As the prevalence of diabetes and metabolic disorders continues to rise, demand for precise, real-time monitoring solutions is expected to increase The combination of clinical reliability, user convenience, and integration with digital health ecosystems positions blood ketone monitoring as the leading product segment, supporting long-term market growth.
Insights into the Sensors Component Segment

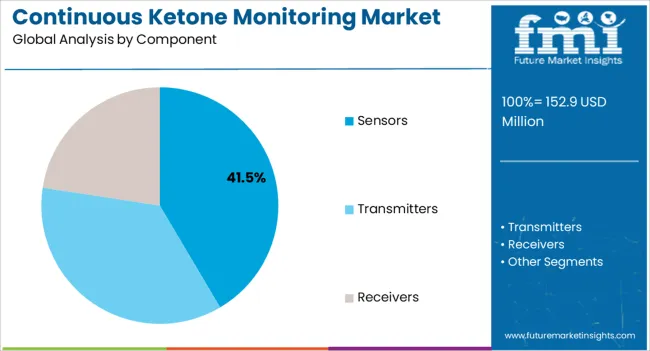
Continuous Ketone Monitoring Market Analysis By Component

The sensors component segment is expected to account for 41.5% of the market revenue in 2025, making it the leading component category. Growth in this segment is being driven by the increasing reliance on high-precision sensing technologies that enable accurate, continuous ketone measurement. Advanced electrochemical and biosensor designs provide reliable data while minimizing discomfort for users, improving compliance and usability.

The integration of sensors with wearable devices and digital health platforms facilitates real-time monitoring, automated alerts, and remote patient management. Investments in research and development have enhanced sensor sensitivity, durability, and response time, which are critical for clinical applications.

As continuous ketone monitoring devices become more widely adopted in hospitals and outpatient care settings, demand for high-performance sensors is expected to remain strong The segment’s leadership is supported by its role in ensuring data accuracy, device reliability, and seamless interoperability with monitoring systems, making sensors the key enabler of market growth.
Insights into the Hospitals End-User Segment

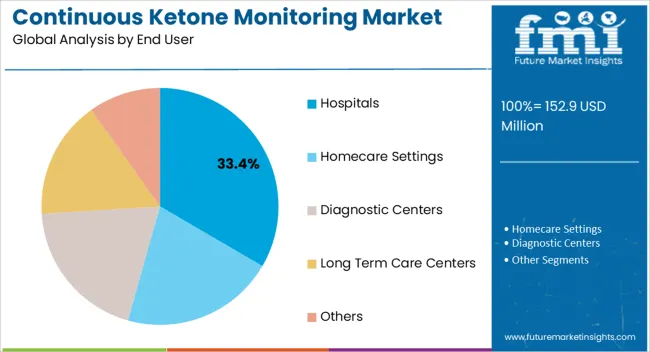
Continuous Ketone Monitoring Market Analysis By End User

The hospitals end-user segment is projected to hold 33.4% of the market revenue in 2025, establishing it as the leading end-use category. Growth is being driven by the rising demand for continuous ketone monitoring in clinical settings to support patient management for diabetes, metabolic syndrome, and critical care applications. Hospitals leverage these devices to provide continuous, real-time monitoring that improves clinical decision-making, reduces complications, and enhances patient safety.

Integration with electronic health records and hospital information systems allows for seamless data management and longitudinal tracking of patient health. Increasing focus on preventive care, early intervention, and personalized treatment strategies has further reinforced adoption.

Investments in modern healthcare infrastructure, training programs, and advanced monitoring protocols are expanding device deployment across hospital networks As healthcare providers prioritize data-driven patient management and outcomes optimization, continuous ketone monitoring devices are expected to remain essential tools in hospitals, supporting sustained market growth and reinforcing the segment’s leading position.

Comparison of Historical vs Future Outlook for Continuous Ketone Monitoring Market (2020 to 2035)

From 2012 to 2025, the global continuous ketone monitoring market experienced a CAGR of 7.0%, reaching a market size of USD 152.9 million in 2025.

From 2012 to 2025, The emergence of the continuous ketone monitoring market in recent years is due to developments in wearable technology, sensor science, and growing consumer awareness of the benefits of ketone monitoring for a range of medical issues. The demand from those on ketogenic diets and athletes looking to improve their performance initially drove the industry.

Early on, the market was characterized by a small number of product options, higher prices, and a concentration on specialized applications. Athletes who needed accurate ketone level monitoring or those with diabetes managing their risk of diabetic ketoacidosis (DKA) were the main users of continuous ketone monitoring devices.

Future Forecast for Continuous Ketone Monitoring Industry:

Looking ahead, the global continuous ketone monitoring industry is expected to rise at a CAGR of 9.0% from 2025 to 2035. During the forecast period, the market size is expected to reach USD 347.3 million by 2035.

The continuous ketone monitoring industry is expected to continue its growth trajectory from 2025 to 2035, The need for continuous ketone monitoring devices is anticipated to increase due to the rising prevalence of diabetes around the world and the need for effective DKA therapy and prevention. By providing real-time ketone level monitoring, these gadgets help people with diabetes take control of their disease and prevent complications.

Analysis of Top Countries Adopting Continuous Ketone Monitoring

Continuous Ketone Monitoring Market to Surge in the United States Due to High Prevalence of Diabetes

Country The United States
Market Size (USD million) by End of Forecast Period (2035) USD 347.3 million
CAGR % 2025 to End of Forecast (2035) 9.4%

The continuous ketone monitoring industry in the United States is expected to reach a market size of USD 347.3 million by 2035, expanding at a CAGR of 9.4%. The USA has a high prevalence of diabetes, with a large population of individuals living with the condition.

As diabetes management becomes a priority, there is a growing demand for continuous ketone monitoring devices to help individuals monitor their ketone levels more effectively, especially those at risk of diabetic ketoacidosis (DKA).

Rising Demand for Continuous Ketone Monitoring Due to Focus on Diabetes Management to Propel the United Kingdom Market Growth

Country The United Kingdom
Market Size (USD million) by End of Forecast Period (2035) USD 15.2 million
CAGR % 2025 to End of Forecast (2035) 7.9%

The continuous ketone monitoring industry in the United Kingdom is expected to reach a market share of USD 15.2 million, expanding at a CAGR of 7.9% during the forecast period. The healthcare system in the UK places a strong emphasis on diabetes management and prevention of complications.

Continuous ketone monitoring devices play a vital role in supporting diabetes management by providing real-time ketone level data, enabling timely interventions and adjustments to diabetes treatment plans.

Notable Growth Expected in China's Continuous Ketone Monitoring Market Due to Increasing Healthcare Expenditure

Country China
Market Size (USD million) by End of Forecast Period (2035) USD 23.6 million
CAGR % 2025 to End of Forecast (2035) 9.5%

The continuous ketone monitoring industry in China is anticipated to reach a market size of USD 23.6 million, moving at a CAGR of 9.5% during the forecast period.

China's healthcare expenditure has been rising steadily, driven by economic growth and government efforts to improve healthcare infrastructure. This increased investment in healthcare facilities and services creates opportunities for the growth of the continuous ketone monitoring market.
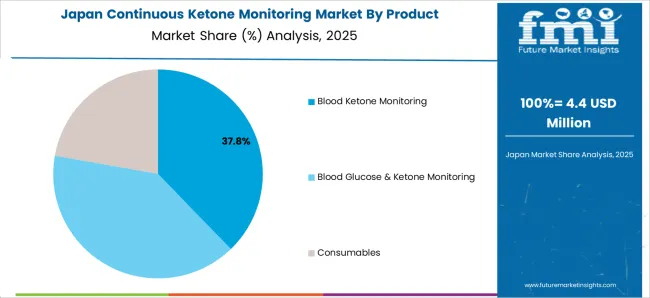
Growing Regulatory Support to Drive Market Growth in Japan

Continuous Ketone Monitoring Market Japan Market Share Analysis By Product

Country Japan
Market Size (USD million) by End of Forecast Period (2035) USD 13.6 million
CAGR % 2025 to End of Forecast (2035) 8.2%

The continuous ketone monitoring industry in Japan is estimated to reach a market size of USD 13.6 million by 2035, thriving at a CAGR of 8.2%. Japan has a robust regulatory framework for medical devices, ensuring the safety and efficacy of products in the market. Supportive regulations and guidelines facilitate the introduction and commercialization of continuous ketone monitoring devices, driving market growth.
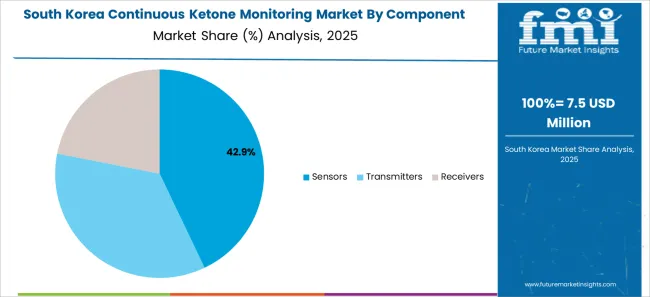
Demand for Continuous Ketone Monitoring is Rising Research and Development to Fuel Market Growth in South Korea

Continuous Ketone Monitoring Market South Korea Market Share Analysis By Component

Country South Korea
Market Size (USD million) by End of Forecast Period (2035) USD 12.0 million
CAGR % 2025 to End of Forecast (2035) 8.8%

The continuous ketone monitoring industry in South Korea is expected to reach a market size of USD 12.0 million, expanding at a CAGR of 8.8% during the forecast period. Ongoing research and development efforts in South Korea's medical device industry contribute to the growth of the continuous ketone monitoring market. Domestic manufacturers focus on developing innovative and advanced continuous ketone monitoring devices to cater to the specific needs and preferences of the South Korean market.

Continuous Ketone Monitoring Industry Analysis by Category

Blood Ketone Monitoring to Dominate Continuous Ketone Monitoring Industry with 9.2% CAGR through 2035

The blood ketone monitoring is expected to dominate the continuous ketone monitoring industry with a CAGR of 9.2% from 2025 to 2035. Blood ketone monitoring provides direct and accurate measurement of ketone levels in the bloodstream.

It allows individuals with diabetes to obtain real-time information about their ketone levels, enabling them to make timely decisions and take appropriate actions to manage their condition effectively. By offering unique insights into ketone levels, blood ketone monitoring offers individualized diabetes management. Individuals can improve their glycemic control and avert problems by modifying their diet, insulin dosage, and overall diabetes management strategy by recognizing their particular ketone response.

How the Sensors Components are Driving the Continuous Ketone Monitoring Market?

The sensors components segments are expected to dominate the continuous ketone monitoring industry with a CAGR of 9.6% from 2025 to 2035. Sensors are responsible for accurately measuring ketone levels in continuous ketone monitoring devices.

They utilize various detection methods, such as enzymatic or electrochemical reactions, to convert the presence of ketones into measurable signals. This accuracy ensures reliable and precise ketone measurements, allowing individuals with diabetes to monitor their ketone levels with confidence.

Which End User is Widely Adopted the Continuous Ketone Monitoring?

The hospital segment is expected to dominate the continuous ketone monitoring industry with a CAGR of 8.6% from 2025 to 2035. Hospitals serve as the primary point of diagnosis and treatment for individuals with diabetes and related conditions. Continuous ketone monitoring devices are utilized in hospital settings to monitor ketone levels in patients, especially those at risk of diabetic ketoacidosis (DKA). Hospitals play a crucial role in the adoption and implementation of continuous ketone monitoring devices for accurate ketone level assessment and timely intervention.

Hospitals often conduct clinical research and studies related to diabetes management and monitoring. Continuous ketone monitoring devices are used in these research projects to gather data and evaluate their effectiveness in improving patient outcomes.
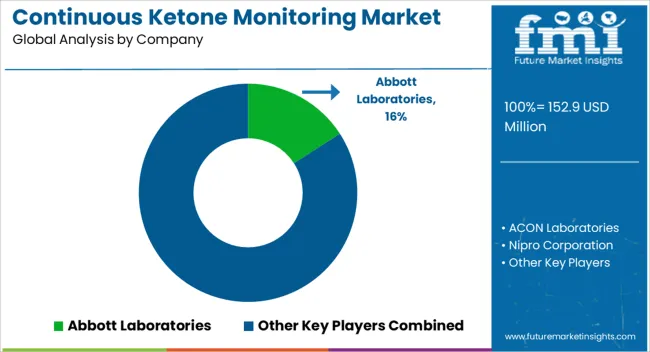
Competitive Landscape of the Continuous Ketone Monitoring Market

Continuous Ketone Monitoring Market Analysis By Company

The continuous ketone monitoring sector is fiercely competitive, with many companies fighting for market dominance. To stay ahead of the competition in such a circumstance, essential players must employ smart techniques.

Key Strategies Used by the Participants

Product Development

Companies invest heavily in R&D to deliver novel products that improve efficiency, dependability, and cost-effectiveness. Product innovation allows businesses to differentiate themselves from their competition while also catering to the changing demands of their clients.

Strategic Alliances & Collaborations

Strategic alliances and partnerships with other businesses are regularly formed by major players in an industry to take advantage of each other's advantages and expand their market reach. Through such arrangements, businesses may also obtain access to new technologies and markets.

Expansion into Emerging Markets

The continuous ketone monitoring sector is expanding rapidly in emerging regions such as China and India. Key firms are enhancing their distribution networks and developing local manufacturing facilities to increase their presence in these areas.

Acquisitions and mergers

Mergers and acquisitions are frequently used by key players in the continuous ketone monitoring business to consolidate their market position, extend their product range, and gain access to new markets.

Key Continuous Ketone Monitoring Market Players and Concentration

  • Abbott Laboratories
  • ACON Laboratories
  • Nipro Corporation
  • Keto-Mojo
  • PortaCheck Inc.
  • Nova Biomedical
  • GlucoRx Limited
  • EKF Diagnostics Holdings
  • Bruno MD
  • ForeCare Inc.

Key Developments in the Continuous Ketone Monitoring Market:

In June 2025, Abbott (NYSE: ABT) revealed it is working on a novel biowearable that combines a sensor for continuous glucose and ketone monitoring. The system has received the USA Food and Drug Administration's breakthrough device designation, which is intended to speed up the examination of novel technologies that can enhance the lives of patients with life-threatening or permanently disabling diseases or disorders.

Top Segments Studied in the Continuous Ketone Monitoring Market Research Report

By Product:

  • Blood Ketone Monitoring
  • Blood Glucose & Ketone Monitoring
  • Consumables

By Component:

  • Transmitters
  • Sensors
  • Receivers

By End User:

  • Hospitals
  • Homecare Settings
  • Diagnostic Centers
  • Long Term Care Centers
  • Others

By Region:

  • North America
  • Latin America
  • Europe
  • East Asia
  • South Asia
  • Oceania
  • The Middle East & Africa

Frequently Asked Questions

How big is the continuous ketone monitoring market in 2025?

The global continuous ketone monitoring market is estimated to be valued at USD 152.9 million in 2025.

What will be the size of continuous ketone monitoring market in 2035?

The market size for the continuous ketone monitoring market is projected to reach USD 347.3 million by 2035.

How much will be the continuous ketone monitoring market growth between 2025 and 2035?

The continuous ketone monitoring market is expected to grow at a 8.6% CAGR between 2025 and 2035.

What are the key product types in the continuous ketone monitoring market?

The key product types in continuous ketone monitoring market are blood ketone monitoring, blood glucose & ketone monitoring and consumables.

Which component segment to contribute significant share in the continuous ketone monitoring market in 2025?

In terms of component, sensors segment to command 41.5% share in the continuous ketone monitoring market in 2025.

Table of Content

  1. Executive Summary
    • Global Market Outlook
    • Demand-side Trends
    • Supply-side Trends
    • Technology Roadmap Analysis
    • Analysis and Recommendations
  2. Market Overview
    • Market Coverage / Taxonomy
    • Market Definition / Scope / Limitations
  3. Market Background
    • Market Dynamics
      • Drivers
      • Restraints
      • Opportunity
      • Trends
    • Scenario Forecast
      • Demand in Optimistic Scenario
      • Demand in Likely Scenario
      • Demand in Conservative Scenario
    • Opportunity Map Analysis
    • Product Life Cycle Analysis
    • Supply Chain Analysis
    • Investment Feasibility Matrix
    • Value Chain Analysis
    • PESTLE and Porter’s Analysis
    • Regulatory Landscape
    • Regional Parent Market Outlook
    • Production and Consumption Statistics
    • Import and Export Statistics
  4. Global Market Analysis 2020 to 2024 and Forecast, 2025 to 2035
    • Historical Market Size Value (USD Million) Analysis, 2020 to 2024
    • Current and Future Market Size Value (USD Million) Projections, 2025 to 2035
      • Y-o-Y Growth Trend Analysis
      • Absolute $ Opportunity Analysis
  5. Global Market Pricing Analysis 2020 to 2024 and Forecast 2025 to 2035
  6. Global Market Analysis 2020 to 2024 and Forecast 2025 to 2035, By Product
    • Introduction / Key Findings
    • Historical Market Size Value (USD Million) Analysis By Product , 2020 to 2024
    • Current and Future Market Size Value (USD Million) Analysis and Forecast By Product , 2025 to 2035
      • Blood Ketone Monitoring
      • Blood Glucose & Ketone Monitoring
      • Consumables
    • Y-o-Y Growth Trend Analysis By Product , 2020 to 2024
    • Absolute $ Opportunity Analysis By Product , 2025 to 2035
  7. Global Market Analysis 2020 to 2024 and Forecast 2025 to 2035, By Component
    • Introduction / Key Findings
    • Historical Market Size Value (USD Million) Analysis By Component, 2020 to 2024
    • Current and Future Market Size Value (USD Million) Analysis and Forecast By Component, 2025 to 2035
      • Sensors
      • Transmitters
      • Receivers
    • Y-o-Y Growth Trend Analysis By Component, 2020 to 2024
    • Absolute $ Opportunity Analysis By Component, 2025 to 2035
  8. Global Market Analysis 2020 to 2024 and Forecast 2025 to 2035, By End User
    • Introduction / Key Findings
    • Historical Market Size Value (USD Million) Analysis By End User, 2020 to 2024
    • Current and Future Market Size Value (USD Million) Analysis and Forecast By End User, 2025 to 2035
      • Hospitals
      • Homecare Settings
      • Diagnostic Centers
      • Long Term Care Centers
      • Others
    • Y-o-Y Growth Trend Analysis By End User, 2020 to 2024
    • Absolute $ Opportunity Analysis By End User, 2025 to 2035
  9. Global Market Analysis 2020 to 2024 and Forecast 2025 to 2035, By Region
    • Introduction
    • Historical Market Size Value (USD Million) Analysis By Region, 2020 to 2024
    • Current Market Size Value (USD Million) Analysis and Forecast By Region, 2025 to 2035
      • North America
      • Latin America
      • Western Europe
      • Eastern Europe
      • East Asia
      • South Asia and Pacific
      • Middle East & Africa
    • Market Attractiveness Analysis By Region
  10. North America Market Analysis 2020 to 2024 and Forecast 2025 to 2035, By Country
    • Historical Market Size Value (USD Million) Trend Analysis By Market Taxonomy, 2020 to 2024
    • Market Size Value (USD Million) Forecast By Market Taxonomy, 2025 to 2035
      • By Country
        • USA
        • Canada
        • Mexico
      • By Product
      • By Component
      • By End User
    • Market Attractiveness Analysis
      • By Country
      • By Product
      • By Component
      • By End User
    • Key Takeaways
  11. Latin America Market Analysis 2020 to 2024 and Forecast 2025 to 2035, By Country
    • Historical Market Size Value (USD Million) Trend Analysis By Market Taxonomy, 2020 to 2024
    • Market Size Value (USD Million) Forecast By Market Taxonomy, 2025 to 2035
      • By Country
        • Brazil
        • Chile
        • Rest of Latin America
      • By Product
      • By Component
      • By End User
    • Market Attractiveness Analysis
      • By Country
      • By Product
      • By Component
      • By End User
    • Key Takeaways
  12. Western Europe Market Analysis 2020 to 2024 and Forecast 2025 to 2035, By Country
    • Historical Market Size Value (USD Million) Trend Analysis By Market Taxonomy, 2020 to 2024
    • Market Size Value (USD Million) Forecast By Market Taxonomy, 2025 to 2035
      • By Country
        • Germany
        • UK
        • Italy
        • Spain
        • France
        • Nordic
        • BENELUX
        • Rest of Western Europe
      • By Product
      • By Component
      • By End User
    • Market Attractiveness Analysis
      • By Country
      • By Product
      • By Component
      • By End User
    • Key Takeaways
  13. Eastern Europe Market Analysis 2020 to 2024 and Forecast 2025 to 2035, By Country
    • Historical Market Size Value (USD Million) Trend Analysis By Market Taxonomy, 2020 to 2024
    • Market Size Value (USD Million) Forecast By Market Taxonomy, 2025 to 2035
      • By Country
        • Russia
        • Poland
        • Hungary
        • Balkan & Baltic
        • Rest of Eastern Europe
      • By Product
      • By Component
      • By End User
    • Market Attractiveness Analysis
      • By Country
      • By Product
      • By Component
      • By End User
    • Key Takeaways
  14. East Asia Market Analysis 2020 to 2024 and Forecast 2025 to 2035, By Country
    • Historical Market Size Value (USD Million) Trend Analysis By Market Taxonomy, 2020 to 2024
    • Market Size Value (USD Million) Forecast By Market Taxonomy, 2025 to 2035
      • By Country
        • China
        • Japan
        • South Korea
      • By Product
      • By Component
      • By End User
    • Market Attractiveness Analysis
      • By Country
      • By Product
      • By Component
      • By End User
    • Key Takeaways
  15. South Asia and Pacific Market Analysis 2020 to 2024 and Forecast 2025 to 2035, By Country
    • Historical Market Size Value (USD Million) Trend Analysis By Market Taxonomy, 2020 to 2024
    • Market Size Value (USD Million) Forecast By Market Taxonomy, 2025 to 2035
      • By Country
        • India
        • ASEAN
        • Australia & New Zealand
        • Rest of South Asia and Pacific
      • By Product
      • By Component
      • By End User
    • Market Attractiveness Analysis
      • By Country
      • By Product
      • By Component
      • By End User
    • Key Takeaways
  16. Middle East & Africa Market Analysis 2020 to 2024 and Forecast 2025 to 2035, By Country
    • Historical Market Size Value (USD Million) Trend Analysis By Market Taxonomy, 2020 to 2024
    • Market Size Value (USD Million) Forecast By Market Taxonomy, 2025 to 2035
      • By Country
        • Kingdom of Saudi Arabia
        • Other GCC Countries
        • Turkiye
        • South Africa
        • Other African Union
        • Rest of Middle East & Africa
      • By Product
      • By Component
      • By End User
    • Market Attractiveness Analysis
      • By Country
      • By Product
      • By Component
      • By End User
    • Key Takeaways
  17. Key Countries Market Analysis
    • USA
      • Pricing Analysis
      • Market Share Analysis, 2024
        • By Product
        • By Component
        • By End User
    • Canada
      • Pricing Analysis
      • Market Share Analysis, 2024
        • By Product
        • By Component
        • By End User
    • Mexico
      • Pricing Analysis
      • Market Share Analysis, 2024
        • By Product
        • By Component
        • By End User
    • Brazil
      • Pricing Analysis
      • Market Share Analysis, 2024
        • By Product
        • By Component
        • By End User
    • Chile
      • Pricing Analysis
      • Market Share Analysis, 2024
        • By Product
        • By Component
        • By End User
    • Germany
      • Pricing Analysis
      • Market Share Analysis, 2024
        • By Product
        • By Component
        • By End User
    • UK
      • Pricing Analysis
      • Market Share Analysis, 2024
        • By Product
        • By Component
        • By End User
    • Italy
      • Pricing Analysis
      • Market Share Analysis, 2024
        • By Product
        • By Component
        • By End User
    • Spain
      • Pricing Analysis
      • Market Share Analysis, 2024
        • By Product
        • By Component
        • By End User
    • France
      • Pricing Analysis
      • Market Share Analysis, 2024
        • By Product
        • By Component
        • By End User
    • India
      • Pricing Analysis
      • Market Share Analysis, 2024
        • By Product
        • By Component
        • By End User
    • ASEAN
      • Pricing Analysis
      • Market Share Analysis, 2024
        • By Product
        • By Component
        • By End User
    • Australia & New Zealand
      • Pricing Analysis
      • Market Share Analysis, 2024
        • By Product
        • By Component
        • By End User
    • China
      • Pricing Analysis
      • Market Share Analysis, 2024
        • By Product
        • By Component
        • By End User
    • Japan
      • Pricing Analysis
      • Market Share Analysis, 2024
        • By Product
        • By Component
        • By End User
    • South Korea
      • Pricing Analysis
      • Market Share Analysis, 2024
        • By Product
        • By Component
        • By End User
    • Russia
      • Pricing Analysis
      • Market Share Analysis, 2024
        • By Product
        • By Component
        • By End User
    • Poland
      • Pricing Analysis
      • Market Share Analysis, 2024
        • By Product
        • By Component
        • By End User
    • Hungary
      • Pricing Analysis
      • Market Share Analysis, 2024
        • By Product
        • By Component
        • By End User
    • Kingdom of Saudi Arabia
      • Pricing Analysis
      • Market Share Analysis, 2024
        • By Product
        • By Component
        • By End User
    • Turkiye
      • Pricing Analysis
      • Market Share Analysis, 2024
        • By Product
        • By Component
        • By End User
    • South Africa
      • Pricing Analysis
      • Market Share Analysis, 2024
        • By Product
        • By Component
        • By End User
  18. Market Structure Analysis
    • Competition Dashboard
    • Competition Benchmarking
    • Market Share Analysis of Top Players
      • By Regional
      • By Product
      • By Component
      • By End User
  19. Competition Analysis
    • Competition Deep Dive
      • Abbott Laboratories
        • Overview
        • Product Portfolio
        • Profitability by Market Segments (Product/Age /Sales Channel/Region)
        • Sales Footprint
        • Strategy Overview
          • Marketing Strategy
          • Product Strategy
          • Channel Strategy
      • ACON Laboratories
      • Nipro Corporation
      • Keto-Mojo
      • PortaCheck Inc.
      • Nova Biomedical
      • GlucoRx Limited
      • EKF Diagnostics Holdings
      • Bruno MD
      • ForeCare Inc.
  20. Assumptions & Acronyms Used
  21. Research Methodology

List of Tables

  • Table 1: Global Market Value (USD Million) Forecast by Region, 2020 to 2035
  • Table 2: Global Market Value (USD Million) Forecast by Product , 2020 to 2035
  • Table 3: Global Market Value (USD Million) Forecast by Component, 2020 to 2035
  • Table 4: Global Market Value (USD Million) Forecast by End User, 2020 to 2035
  • Table 5: North America Market Value (USD Million) Forecast by Country, 2020 to 2035
  • Table 6: North America Market Value (USD Million) Forecast by Product , 2020 to 2035
  • Table 7: North America Market Value (USD Million) Forecast by Component, 2020 to 2035
  • Table 8: North America Market Value (USD Million) Forecast by End User, 2020 to 2035
  • Table 9: Latin America Market Value (USD Million) Forecast by Country, 2020 to 2035
  • Table 10: Latin America Market Value (USD Million) Forecast by Product , 2020 to 2035
  • Table 11: Latin America Market Value (USD Million) Forecast by Component, 2020 to 2035
  • Table 12: Latin America Market Value (USD Million) Forecast by End User, 2020 to 2035
  • Table 13: Western Europe Market Value (USD Million) Forecast by Country, 2020 to 2035
  • Table 14: Western Europe Market Value (USD Million) Forecast by Product , 2020 to 2035
  • Table 15: Western Europe Market Value (USD Million) Forecast by Component, 2020 to 2035
  • Table 16: Western Europe Market Value (USD Million) Forecast by End User, 2020 to 2035
  • Table 17: Eastern Europe Market Value (USD Million) Forecast by Country, 2020 to 2035
  • Table 18: Eastern Europe Market Value (USD Million) Forecast by Product , 2020 to 2035
  • Table 19: Eastern Europe Market Value (USD Million) Forecast by Component, 2020 to 2035
  • Table 20: Eastern Europe Market Value (USD Million) Forecast by End User, 2020 to 2035
  • Table 21: East Asia Market Value (USD Million) Forecast by Country, 2020 to 2035
  • Table 22: East Asia Market Value (USD Million) Forecast by Product , 2020 to 2035
  • Table 23: East Asia Market Value (USD Million) Forecast by Component, 2020 to 2035
  • Table 24: East Asia Market Value (USD Million) Forecast by End User, 2020 to 2035
  • Table 25: South Asia and Pacific Market Value (USD Million) Forecast by Country, 2020 to 2035
  • Table 26: South Asia and Pacific Market Value (USD Million) Forecast by Product , 2020 to 2035
  • Table 27: South Asia and Pacific Market Value (USD Million) Forecast by Component, 2020 to 2035
  • Table 28: South Asia and Pacific Market Value (USD Million) Forecast by End User, 2020 to 2035
  • Table 29: Middle East & Africa Market Value (USD Million) Forecast by Country, 2020 to 2035
  • Table 30: Middle East & Africa Market Value (USD Million) Forecast by Product , 2020 to 2035
  • Table 31: Middle East & Africa Market Value (USD Million) Forecast by Component, 2020 to 2035
  • Table 32: Middle East & Africa Market Value (USD Million) Forecast by End User, 2020 to 2035

List of Figures

  • Table 1: Global Market Value (USD Million) Forecast by Region, 2020 to 2035
  • Table 2: Global Market Value (USD Million) Forecast by Product , 2020 to 2035
  • Table 3: Global Market Value (USD Million) Forecast by Component, 2020 to 2035
  • Table 4: Global Market Value (USD Million) Forecast by End User, 2020 to 2035
  • Table 5: North America Market Value (USD Million) Forecast by Country, 2020 to 2035
  • Table 6: North America Market Value (USD Million) Forecast by Product , 2020 to 2035
  • Table 7: North America Market Value (USD Million) Forecast by Component, 2020 to 2035
  • Table 8: North America Market Value (USD Million) Forecast by End User, 2020 to 2035
  • Table 9: Latin America Market Value (USD Million) Forecast by Country, 2020 to 2035
  • Table 10: Latin America Market Value (USD Million) Forecast by Product , 2020 to 2035
  • Table 11: Latin America Market Value (USD Million) Forecast by Component, 2020 to 2035
  • Table 12: Latin America Market Value (USD Million) Forecast by End User, 2020 to 2035
  • Table 13: Western Europe Market Value (USD Million) Forecast by Country, 2020 to 2035
  • Table 14: Western Europe Market Value (USD Million) Forecast by Product , 2020 to 2035
  • Table 15: Western Europe Market Value (USD Million) Forecast by Component, 2020 to 2035
  • Table 16: Western Europe Market Value (USD Million) Forecast by End User, 2020 to 2035
  • Table 17: Eastern Europe Market Value (USD Million) Forecast by Country, 2020 to 2035
  • Table 18: Eastern Europe Market Value (USD Million) Forecast by Product , 2020 to 2035
  • Table 19: Eastern Europe Market Value (USD Million) Forecast by Component, 2020 to 2035
  • Table 20: Eastern Europe Market Value (USD Million) Forecast by End User, 2020 to 2035
  • Table 21: East Asia Market Value (USD Million) Forecast by Country, 2020 to 2035
  • Table 22: East Asia Market Value (USD Million) Forecast by Product , 2020 to 2035
  • Table 23: East Asia Market Value (USD Million) Forecast by Component, 2020 to 2035
  • Table 24: East Asia Market Value (USD Million) Forecast by End User, 2020 to 2035
  • Table 25: South Asia and Pacific Market Value (USD Million) Forecast by Country, 2020 to 2035
  • Table 26: South Asia and Pacific Market Value (USD Million) Forecast by Product , 2020 to 2035
  • Table 27: South Asia and Pacific Market Value (USD Million) Forecast by Component, 2020 to 2035
  • Table 28: South Asia and Pacific Market Value (USD Million) Forecast by End User, 2020 to 2035
  • Table 29: Middle East & Africa Market Value (USD Million) Forecast by Country, 2020 to 2035
  • Table 30: Middle East & Africa Market Value (USD Million) Forecast by Product , 2020 to 2035
  • Table 31: Middle East & Africa Marke
    • Figure 1: Global Market Pricing Analysis
    • Figure 2: Global Market Value (USD Million) Forecast 2020-2035
    • Figure 3: Global Market Value Share and BPS Analysis by Product , 2025 and 2035
    • Figure 4: Global Market Y-o-Y Growth Comparison by Product , 2025-2035
    • Figure 5: Global Market Attractiveness Analysis by Product
    • Figure 6: Global Market Value Share and BPS Analysis by Component, 2025 and 2035
    • Figure 7: Global Market Y-o-Y Growth Comparison by Component, 2025-2035
    • Figure 8: Global Market Attractiveness Analysis by Component
    • Figure 9: Global Market Value Share and BPS Analysis by End User, 2025 and 2035
    • Figure 10: Global Market Y-o-Y Growth Comparison by End User, 2025-2035
    • Figure 11: Global Market Attractiveness Analysis by End User
    • Figure 12: Global Market Value (USD Million) Share and BPS Analysis by Region, 2025 and 2035
    • Figure 13: Global Market Y-o-Y Growth Comparison by Region, 2025-2035
    • Figure 14: Global Market Attractiveness Analysis by Region
    • Figure 15: North America Market Incremental Dollar Opportunity, 2025-2035
    • Figure 16: Latin America Market Incremental Dollar Opportunity, 2025-2035
    • Figure 17: Western Europe Market Incremental Dollar Opportunity, 2025-2035
    • Figure 18: Eastern Europe Market Incremental Dollar Opportunity, 2025-2035
    • Figure 19: East Asia Market Incremental Dollar Opportunity, 2025-2035
    • Figure 20: South Asia and Pacific Market Incremental Dollar Opportunity, 2025-2035
    • Figure 21: Middle East & Africa Market Incremental Dollar Opportunity, 2025-2035
    • Figure 22: North America Market Value Share and BPS Analysis by Country, 2025 and 2035
    • Figure 23: North America Market Value Share and BPS Analysis by Product , 2025 and 2035
    • Figure 24: North America Market Y-o-Y Growth Comparison by Product , 2025-2035
    • Figure 25: North America Market Attractiveness Analysis by Product
    • Figure 26: North America Market Value Share and BPS Analysis by Component, 2025 and 2035
    • Figure 27: North America Market Y-o-Y Growth Comparison by Component, 2025-2035
    • Figure 28: North America Market Attractiveness Analysis by Component
    • Figure 29: North America Market Value Share and BPS Analysis by End User, 2025 and 2035
    • Figure 30: North America Market Y-o-Y Growth Comparison by End User, 2025-2035
    • Figure 31: North America Market Attractiveness Analysis by End User
    • Figure 32: Latin America Market Value Share and BPS Analysis by Country, 2025 and 2035
    • Figure 33: Latin America Market Value Share and BPS Analysis by Product , 2025 and 2035
    • Figure 34: Latin America Market Y-o-Y Growth Comparison by Product , 2025-2035
    • Figure 35: Latin America Market Attractiveness Analysis by Product
    • Figure 36: Latin America Market Value Share and BPS Analysis by Component, 2025 and 2035
    • Figure 37: Latin America Market Y-o-Y Growth Comparison by Component, 2025-2035
    • Figure 38: Latin America Market Attractiveness Analysis by Component
    • Figure 39: Latin America Market Value Share and BPS Analysis by End User, 2025 and 2035
    • Figure 40: Latin America Market Y-o-Y Growth Comparison by End User, 2025-2035
    • Figure 41: Latin America Market Attractiveness Analysis by End User
    • Figure 42: Western Europe Market Value Share and BPS Analysis by Country, 2025 and 2035
    • Figure 43: Western Europe Market Value Share and BPS Analysis by Product , 2025 and 2035
    • Figure 44: Western Europe Market Y-o-Y Growth Comparison by Product , 2025-2035
    • Figure 45: Western Europe Market Attractiveness Analysis by Product
    • Figure 46: Western Europe Market Value Share and BPS Analysis by Component, 2025 and 2035
    • Figure 47: Western Europe Market Y-o-Y Growth Comparison by Component, 2025-2035
    • Figure 48: Western Europe Market Attractiveness Analysis by Component
    • Figure 49: Western Europe Market Value Share and BPS Analysis by End User, 2025 and 2035
    • Figure 50: Western Europe Market Y-o-Y Growth Comparison by End User, 2025-2035
    • Figure 51: Western Europe Market Attractiveness Analysis by End User
    • Figure 52: Eastern Europe Market Value Share and BPS Analysis by Country, 2025 and 2035
    • Figure 53: Eastern Europe Market Value Share and BPS Analysis by Product , 2025 and 2035
    • Figure 54: Eastern Europe Market Y-o-Y Growth Comparison by Product , 2025-2035
    • Figure 55: Eastern Europe Market Attractiveness Analysis by Product
    • Figure 56: Eastern Europe Market Value Share and BPS Analysis by Component, 2025 and 2035
    • Figure 57: Eastern Europe Market Y-o-Y Growth Comparison by Component, 2025-2035
    • Figure 58: Eastern Europe Market Attractiveness Analysis by Component
    • Figure 59: Eastern Europe Market Value Share and BPS Analysis by End User, 2025 and 2035
    • Figure 60: Eastern Europe Market Y-o-Y Growth Comparison by End User, 2025-2035
    • Figure 61: Eastern Europe Market Attractiveness Analysis by End User
    • Figure 62: East Asia Market Value Share and BPS Analysis by Country, 2025 and 2035
    • Figure 63: East Asia Market Value Share and BPS Analysis by Product , 2025 and 2035
    • Figure 64: East Asia Market Y-o-Y Growth Comparison by Product , 2025-2035
    • Figure 65: East Asia Market Attractiveness Analysis by Product
    • Figure 66: East Asia Market Value Share and BPS Analysis by Component, 2025 and 2035
    • Figure 67: East Asia Market Y-o-Y Growth Comparison by Component, 2025-2035
    • Figure 68: East Asia Market Attractiveness Analysis by Component
    • Figure 69: East Asia Market Value Share and BPS Analysis by End User, 2025 and 2035
    • Figure 70: East Asia Market Y-o-Y Growth Comparison by End User, 2025-2035
    • Figure 71: East Asia Market Attractiveness Analysis by End User
    • Figure 72: South Asia and Pacific Market Value Share and BPS Analysis by Country, 2025 and 2035
    • Figure 73: South Asia and Pacific Market Value Share and BPS Analysis by Product , 2025 and 2035
    • Figure 74: South Asia and Pacific Market Y-o-Y Growth Comparison by Product , 2025-2035
    • Figure 75: South Asia and Pacific Market Attractiveness Analysis by Product
    • Figure 76: South Asia and Pacific Market Value Share and BPS Analysis by Component, 2025 and 2035
    • Figure 77: South Asia and Pacific Market Y-o-Y Growth Comparison by Component, 2025-2035
    • Figure 78: South Asia and Pacific Market Attractiveness Analysis by Component
    • Figure 79: South Asia and Pacific Market Value Share and BPS Analysis by End User, 2025 and 2035
    • Figure 80: South Asia and Pacific Market Y-o-Y Growth Comparison by End User, 2025-2035
    • Figure 81: South Asia and Pacific Market Attractiveness Analysis by End User
    • Figure 82: Middle East & Africa Market Value Share and BPS Analysis by Country, 2025 and 2035
    • Figure 83: Middle East & Africa Market Value Share and BPS Analysis by Product , 2025 and 2035
    • Figure 84: Middle East & Africa Market Y-o-Y Growth Comparison by Product , 2025-2035
    • Figure 85: Middle East & Africa Market Attractiveness Analysis by Product
    • Figure 86: Middle East & Africa Market Value Share and BPS Analysis by Component, 2025 and 2035
    • Figure 87: Middle East & Africa Market Y-o-Y Growth Comparison by Component, 2025-2035
    • Figure 88: Middle East & Africa Market Attractiveness Analysis by Component
    • Figure 89: Middle East & Africa Market Value Share and BPS Analysis by End User, 2025 and 2035
    • Figure 90: Middle East & Africa Market Y-o-Y Growth Comparison by End User, 2025-2035
    • Figure 91: Middle East & Africa Market Attractiveness Analysis by End User
    • Figure 92: Global Market - Tier Structure Analysis
    • Figure 93: Global Market - Company Share Analysis
    t Value (USD Million) Forecast by Component, 2020 to 2035
  • Table 32: Middle East & Africa Market Value (USD Million) Forecast by End User, 2020 to 2035
Dashboard
Dashboard
Dashboard
Dashboard
Dashboard
Dashboard

Full Research Suite comprises of:

Market outlook & trends analysis

Market outlook & trends analysis

Interviews & case studies

Interviews & case studies

Strategic recommendations

Strategic recommendations

Vendor profiles & capabilities analysis

Vendor profiles & capabilities analysis

5-year forecasts

5-year forecasts

8 regions and 60+ country-level data splits

8 regions and 60+ country-level data splits

Market segment data splits

Market segment data splits

12 months of continuous data updates

12 months of continuous data updates

DELIVERED AS:

PDF EXCEL ONLINE

Full Research Suite


$5000

$7500

$10000

Buy Report Now
Similar Industry Reports

Similar Industry Reports

Continuously Variable Transmission (CVT) Market

Continuously Variable Transmission (CVT) Market Size and Share Forecast Outlook 2025 to 2035

Continuous Ambulatory Peritoneal Dialysis Bags Market

Continuous Ambulatory Peritoneal Dialysis Bags Market Size and Share Forecast Outlook 2025 to 2035

Continuous Motion Cartoner Market

Continuous Motion Cartoner Market Size and Share Forecast Outlook 2025 to 2035

Continuous Flow Bioreactors Market

Continuous Flow Bioreactors Market Analysis - Size, Share, and Forecast Outlook 2025 to 2035

Continuous Inkjet Printers Market

Continuous Inkjet Printers Market Size and Share Forecast Outlook 2025 to 2035

Continuous Friction Tester Market

Continuous Friction Tester Market Size and Share Forecast Outlook 2025 to 2035

Continuous Fryer Machine Market

Continuous Fryer Machine Market Size and Share Forecast Outlook 2025 to 2035

Continuous Positive Airway Pressure (CPAP) Market

Continuous Positive Airway Pressure (CPAP) Market Analysis – Size, Share & Forecast Outlook 2025 to 2035

Continuous Miners Market

Continuous Miners Market Growth - Trends & Forecast 2025 to 2035

Continuous Renal Replacement Therapy Market

Continuous Renal Replacement Therapy Market Growth – Trends & Forecast 2025-2035

Continuous Peripheral Nerve Block Catheter Market

Continuous Peripheral Nerve Block Catheter Market Growth – Trends & Forecast 2025-2035

Continuous Inkjet Printers Market Share Analysis

Market Share Breakdown of Continuous Inkjet Printers Providers

Continuous Inkjet Inks Market

Continuous Inkjet Inks Market Insights - Growth & Forecast 2024 to 2034

Continuous Thread Metal Cap Market

Continuous Thread Metal Cap Market

Continuous Integration Tools Market

Continuous Integration Tools Market

Continuous Flow Analyzer Market

Continuous Flow Analyzer Market

Continuous Track Wheels Market

Continuous Track Wheels Market

Continuous Cardiac Monitoring Devices Market

Continuous Cardiac Monitoring Devices Market Size and Share Forecast Outlook 2025 to 2035

Continuous Glucose Monitoring Device Market

Continuous Glucose Monitoring Device Market - Demand & Future Trends 2025 to 2035

Continuous Hormone Monitoring Market

Continuous Hormone Monitoring Market Analysis - Size, Share, and Forecast Outlook 2025 to 2035

Future Market Insights

Continuous Ketone Monitoring Market

Chat With MaRIA

Chat With

MaRIA

Hi There, I am MaRIA, Your Market Research Intelligence Assistant. How may I help you?