Monitoring Tool Market Size and Share Forecast Outlook (2025 to 2035)

The Monitoring Tool Market is estimated to be valued at USD 30.4 billion in 2025 and is projected to reach USD 206.2 billion by 2035, registering a compound annual growth rate (CAGR) of 21.1% over the forecast period.

The Monitoring Tool market is experiencing robust growth, driven by the increasing complexity of IT infrastructure, rising digital transformation initiatives, and the growing need for proactive performance management across organizations. Demand is being fueled by the need to ensure high availability, reliability, and efficiency of enterprise applications and networks while reducing downtime and operational costs.

Cloud computing adoption, hybrid IT environments, and the rise of DevOps practices are shaping market dynamics, as organizations seek real-time monitoring and automated analytics to manage resources effectively. Advanced monitoring solutions now leverage AI and machine learning to predict potential failures, optimize performance, and improve service delivery.

Integration with IT service management and analytics platforms enhances operational visibility and informed decision-making As organizations prioritize scalability, automation, and security, the market is expected to sustain growth, with investments in cloud-based solutions and intelligent monitoring tools supporting enhanced efficiency and operational resilience across diverse industries.
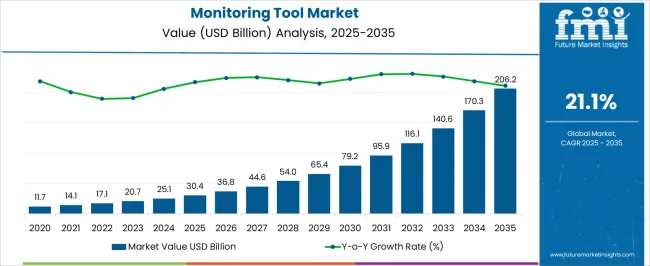
Quick Stats for Monitoring Tool Market

  • Monitoring Tool Market Industry Value (2025): USD 30.4 billion
  • Monitoring Tool Market Forecast Value (2035): USD 206.2 billion
  • Monitoring Tool Market Forecast CAGR: 21.1%
  • Leading Segment in Monitoring Tool Market in 2025: Software (52.6%)
  • Key Growth Region in Monitoring Tool Market: North America, Asia-Pacific, Europe
  • Top Key Players in Monitoring Tool Market: Datadog, Dynatrace, Cisco, AWS (Amazon Web Services), Google, IBM, Atera, Checkmk, Idera, Exoprise, Icinga, ITRS, Better Stack

Monitoring Tool Market Market Value Analysis

Metric Value
Monitoring Tool Market Estimated Value in (2025 E) USD 30.4 billion
Monitoring Tool Market Forecast Value in (2035 F) USD 206.2 billion
Forecast CAGR (2025 to 2035) 21.1%

Segmental Analysis

The market is segmented by Component, Deployment, Type, and Vertical and region. By Component, the market is divided into Software and Services. In terms of Deployment, the market is classified into Cloud and On-Premises. Based on Type, the market is segmented into Infrastructure Monitoring Tools, Application Performance Monitoring Tools, Security Monitoring Tools, and End User Experience Monitoring Tools. By Vertical, the market is divided into BFSI, Retail & E-Commerce, Healthcare, IT & Telecom, Media & Entertainment, Manufacturing, and Others. Regionally, the market is classified into North America, Latin America, Western Europe, Eastern Europe, Balkan & Baltic Countries, Russia & Belarus, Central Asia, East Asia, South Asia & Pacific, and the Middle East & Africa.
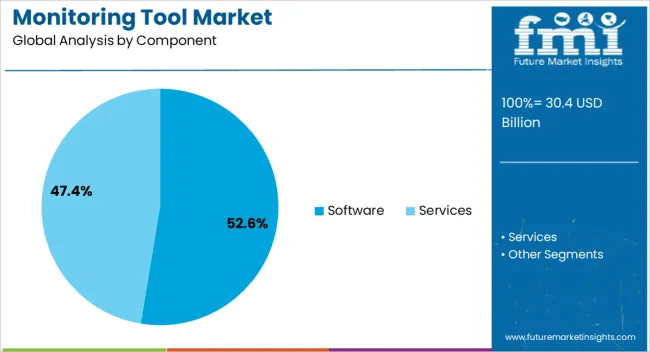
Insights into the Software Component Segment

Monitoring Tool Market Analysis By Component

The software component segment is projected to hold 52.6% of the market revenue in 2025, establishing it as the leading component type. Its growth is being driven by the flexibility, scalability, and real-time capabilities that software solutions provide in monitoring enterprise applications, networks, and IT systems. Software tools enable continuous performance tracking, predictive analysis, and automated alerting, reducing the risk of downtime and improving operational efficiency.

Integration with cloud platforms, analytics engines, and IT service management systems enhances decision-making capabilities. Software-based monitoring also allows organizations to adapt quickly to evolving IT environments, including hybrid and multi-cloud infrastructures, without significant hardware investments.

The ability to deliver centralized management, advanced reporting, and actionable insights further strengthens adoption across enterprises As businesses continue to prioritize agility, scalability, and data-driven IT operations, the software segment is expected to maintain its leadership position, driven by continuous innovation in intelligent monitoring capabilities and cloud integration.
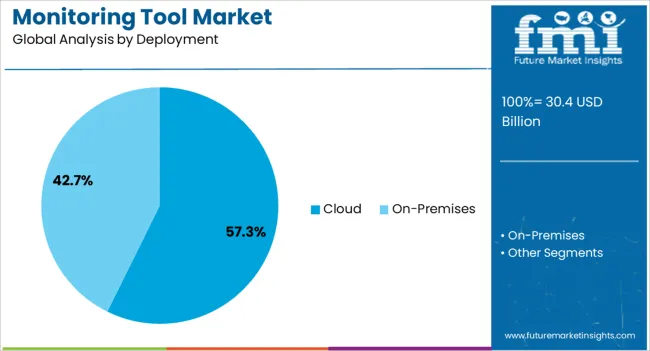
Insights into the Cloud Deployment Segment

Monitoring Tool Market Analysis By Deployment

The cloud deployment segment is anticipated to account for 57.3% of the market revenue in 2025, making it the leading deployment category. Its growth is fueled by the increasing adoption of cloud infrastructure, hybrid IT models, and the need for scalable monitoring solutions that provide real-time visibility across distributed environments. Cloud-based monitoring tools offer centralized management, automated updates, and seamless integration with existing enterprise systems, reducing operational complexity and IT overhead.

Organizations benefit from predictive analytics, resource optimization, and performance monitoring without the constraints of on-premises infrastructure. Security, reliability, and compliance requirements are further supporting cloud deployment, as tools can be rapidly updated to address emerging risks.

The flexibility and cost-efficiency of cloud solutions make them particularly suitable for enterprises managing dynamic workloads and multiple applications As cloud adoption continues to rise globally, this deployment segment is expected to remain the dominant contributor, driven by increasing digital transformation initiatives and demand for agile IT operations.
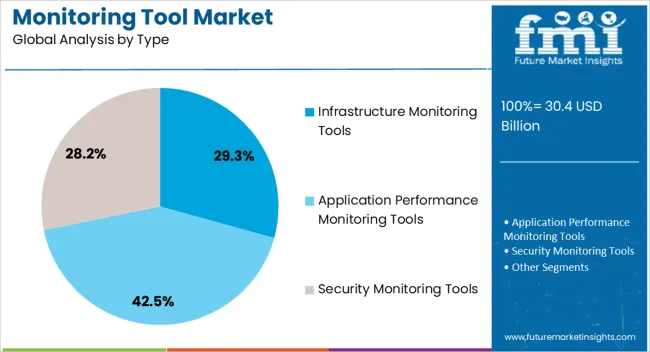
Insights into the Infrastructure Monitoring Tools Type Segment

Monitoring Tool Market Analysis By Type

The infrastructure monitoring tools type segment is projected to hold 29.3% of the market revenue in 2025, positioning it as the leading tool category. Growth is being driven by the need for organizations to maintain optimal performance of servers, networks, storage, and other critical IT infrastructure components. These tools provide real-time monitoring, alerting, and predictive analytics that reduce downtime, improve service delivery, and enhance operational efficiency.

Integration with cloud platforms and software-based monitoring solutions allows for centralized visibility and improved management across hybrid environments. Increasing complexity in IT operations, combined with the rising adoption of virtualized and containerized infrastructures, has further fueled demand.

Infrastructure monitoring tools enable proactive identification of issues, resource optimization, and adherence to performance and compliance standards As enterprises increasingly adopt digital-first strategies, the infrastructure monitoring tools segment is expected to sustain its leading position, supported by continuous innovation in AI-driven analytics and integration with broader IT management ecosystems.

Historical Performance vs Future Growth Outlook for the Monitoring Tool Market

In 2020, the global monitoring tool market showed a potential worth USD 11.7 billion, according to a report from Future Market Insights (FMI). The monitoring tool market witnessed significant growth, registering a CAGR of 24.9% from 2020 to 2025.

Historical CAGR 24.9%
Forecast CAGR 21.1%

The demand for monitoring tools across various industries was on the verge of improvement, such as adopting digital technologies, proliferating Internet of Things (IoT) devices, and the augmenting need for real-time data analysis and insights contributed to the enlargement of the market during this period.

The monitoring tool market is projected to continue its growth momentum with a CAGR of 21.1% from 2020 to 2025. Despite the slightly reduced growth rate compared to the historical period, this forecast indicates sustained augmentation and significant opportunities in the market.

The continued digitization of businesses, the integration of artificial intelligence and machine learning technologies into monitoring tools, and the magnified focus on cybersecurity and data protection are contemplated to inflate the market.

Key Drivers Supporting the Growth of Monitoring Tool Adoption

  • Monitoring technologies are capable due to continuous technological advancements like machine learning, artificial intelligence, and predictive analytics.
  • Organizations have the power to maximize their operations and make wise decisions as developments allow data to be collected, analyzed, and interpreted more effectively, giving.
  • The Internet of Things (IoT) and the spread of digital technologies exponentially propel the market according to the volume, variety, and velocity of data enterprises they generate.
  • The need for advanced analytics and visualization-capable monitoring tools stems from the fact that such tools are necessary for managing intricate data sets and deriving practical conclusions.
  • Monitoring technologies are essential for helping businesses keep an eye on their systems, spot irregularities, and stay in line with regulations all promoting market development.

Challenges Threatening the Expansion of the Monitoring Tool Market

  • Companies have trouble integrating monitoring solutions due to complicated deployment procedures, compatibility problems, and interoperability challenges with their current IT infrastructure.
  • Integration issues impede monitoring systems smooth deployment and application, restricting their efficacy and market uptake.
  • The high implementation costs are a barrier to entering small and medium-sized firms (SMEs) with restricted budgets, slowing market augmentation and adoption rates.

Monitoring Tool Industry Analysis by Top Investment Segments

The below section shows the leading segment. Based on the component, the software segment is registered to rise at 20.8% CAGR. Based on deployment, the cloud segment is registered to rise at 20.6% CAGR.

Artificial intelligence, machine learning, and predictive analytics are examples of cutting-edge technologies continuously added to software solutions.

Organizations extend their monitoring infrastructure with response to change in needs without being constrained by physical hardware to cloud deployment.

Category CAGR by 2035
Software 20.8%
Cloud 20.6%

Software Segment to Hold a Significant Share in the Market

Based on the component type, the software market is predicted to rise at a CAGR of 20.8%, which indicates that it is developing significantly.

The propelling usage of artificial intelligence (AI) and advanced analytics in monitoring software where these software solutions are being used by organizations to improve decision-making processes, extend operational efficiency, and extract deeper insights from their data.

Continuous advancements in automation capabilities, predictive analytics, and data visualization also fuel the development of the software segment in the market.

Cloud Segment to Hold a Dominant Share in the Market

Based on the deployment type, the cloud deployment market is registered to rise at a CAGR of 20.6%. A few benefits of cloud-based deployment are cost-effectiveness, scalability, and flexibility.

Businesses often approve cloud-based monitoring solutions to take advantage of these advantages and optimize their processes. Cloud deployment makes it easier to use the monitoring tools remotely, allowing for real-time monitoring and analysis from any location.

The need for software-as-a-service (SaaS) solutions and the augmenting usage of cloud computing across industries are propelling the development of the cloud segment in the market for monitoring tools.

Analysis of Top Countries Utilizing and Developing Monitoring Tool Solutions

The table describes about the top five countries ranked by revenue, with South Korea holding the top position.

South Korea is leading the monitoring tool market by spearheading innovative smart city development and urban planning approaches. With a strong focus on technology and innovation, South Korea is leveraging monitoring tools to transform its urban landscape into a more sustainable and efficient environment.

By deploying advanced monitoring solutions, South Korea is effectively managing resources, optimizing public services, and enhancing the quality of life for its citizens. The companies of South Korea companies actively contribute to the global monitoring tool market by researching, developing, and exporting cutting-edge monitoring technologies.

Forecast CAGRs from 2025 to 2035

Countries CAGR through 2035
United States 20.8%
United Kingdom 21.8%
China 21.7%
Japan 22.1%
South Korea 22.6%

Optimization of Business Operations in the United States

The monitoring tool market is primarily used for optimizing business operations across various industries. Companies utilize monitoring tools to track performance metrics, analyze data, and identify areas for improvement in processes, systems, and workflows.

From monitoring network performance and server uptime to analyzing customer behavior and market trends, monitoring tools are compelling in enhancing operational efficiency that propels business growth in this competitive market.

Cybersecurity and Threat Detection Impresses the United Kingdom Market

The monitoring tool market is majorly used for cybersecurity and threat detection purposes. With the rise in economic growth due to the frequency and sophistication of cyberattacks, organizations prioritize deploying monitoring tools to detect and mitigate security threats in real-time.

From monitoring network traffic for suspicious activity to analysis of system logs for signs of intrusion, monitoring tools help safeguard sensitive data, protect digital assets, and ensure compliance with regulatory requirements in the dynamic landscape of cybersecurity.

Industrial Automation and Manufacturing Improves the China Market

The market predominantly utilizes industrial automation and manufacturing applications. Technological innovation and advanced manufacturing capabilities and monitoring tools play a dignified role in optimizing production processes, monitoring equipment performance, and ensuring quality technological control in factories and industrial facilities.

Infrastructure Monitoring and Preparations for Disasters Makes Japan Hold an Important Position in the Market

The predominant usage for infrastructure monitoring and disaster preparedness initiatives is taken. Due to their susceptibility to natural disasters such as earthquakes and typhoons, organizations rely on monitoring tools to monitor critical infrastructure assets, including buildings, transportation networks, and utilities.

By continuously monitoring infrastructural health and performance metrics, monitoring tools enable early detection of potential issues, timely emergency response, and effective disaster recovery planning in high-risk environments in Japan.

Smart City Development and Urban Planning in South Korea

Development of smart city and urban planning initiatives are taken. As the country strives to become a global hub for technology and innovation, monitoring tools are pivotal in building smarter, more sustainable cities.

From monitoring traffic flow and air quality to analyzing energy consumption patterns and optimizing public services, monitoring tools enable data-driven decision-making and improve the quality of life for citizens in South Korea.
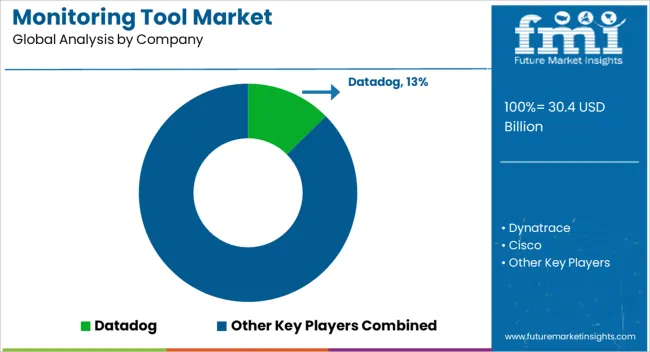
Competitive Landscape of the Monitoring Tool Market

Monitoring Tool Market Analysis By Company

The competitive landscape of the monitoring tool market is characterized by a diverse range of players, including multinational corporations. Lucrative opportunities are held by market players that compete based on product features, pricing, reliability, and customer service.

Continuous innovation, strategic partnerships, and acquisitions are common strategies companies employ to gain a competitive edge. With the propelling demand for advanced monitoring solutions, competition in the market remains fierce due to companies’ market share and customer loyalty.

Some of the key developments are:

  • In February 2025, Tech Mahindra Limited unveiled SANDSTORM, a robust tool designed for enhancing customer experience by offering real-time insights into device performance for businesses of varying sizes.
  • In June 2025, IBM acquired Apptio and bolstered IBM's resource optimization, observability, and application management solutions. The acquisition augmented to deliver added value to clients and foster synergies across multiple growth areas within IBM.

Scope and Coverage of the Monitoring Tool Market Report

  • Adjacent Study on Monitoring Tool Market
  • IT Infrastructure Monitoring Tool Market Size
  • Media Monitoring Tools Market Size, Current Insights, and Demographic Trends
  • Global Employee Monitoring Software Market
  • Key Strategies in the Database Monitoring Software Market

Overview of Analytical Coverage and Study Boundaries for the Monitoring Tool Industry

Attributes Details
Estimated Market Size in 2025 USD 25.1 billion
Projected Market Valuation in 2035 USD 170 billion
Value-based CAGR 2025 to 2035 21.1%
Forecast Period 2025 to 2035
Historical Data Available for 2020 to 2025
Market Analysis Value in USD billion
Key Regions Covered North America; Latin America; Western Europe; Eastern Europe; South Asia and Pacific; East Asia; The Middle East and Africa
Key Market Segments Covered Component, Deployment, Type, Vertical, Region
Key Countries Profiled The United States, Canada, Brazil, Mexico, Germany, The United Kingdom, France, Spain, Italy, Russia, Poland, Czech Republic, Romania, India, Bangladesh, Australia, New Zealand, China, Japan, South Korea, GCC countries, South Africa, Israel
Key Companies Profiled Atera; AWS (Amazon Web Services); Better Stack; Checkmk; Cisco; Datadog; Dynatrace; Exoprise; Google; IBM; Icinga; Idera; ITRS

Top Segments Studied in the Monitoring Tool Market Report

By Component:

  • Software
  • Services

By Deployment:

  • Cloud
  • On-premises

By Type:

  • Infrastructure Monitoring Tools
    • Network Monitoring
    • Storage Monitoring
    • Server Monitoring
    • Cloud Infrastructure Monitoring
    • Others
  • Application Performance Monitoring Tools
    • Database Monitoring
    • Web Application Monitoring
    • Mobile Application Monitoring
    • Code Level Monitoring
    • Others
  • Security Monitoring Tools
    • Intrusion Detection and Prevention Systems (IDPS)
    • Log Monitoring and Analysis
    • Vulnerability Assessment and Management
    • Others
  • End User Experience Monitoring Tools
    • Synthetic Monitoring
    • Real User Monitoring
    • Others

By Vertical:

  • BFSI
  • Retail & E-commerce
  • Healthcare
  • IT & Telecom
  • Media & Entertainment
  • Manufacturing
  • Others

By Region:

  • North America
  • Latin America
  • Western Europe
  • Eastern Europe
  • South Asia and Pacific
  • East Asia
  • The Middle East and Africa

Frequently Asked Questions

How big is the monitoring tool market in 2025?

The global monitoring tool market is estimated to be valued at USD 30.4 billion in 2025.

What will be the size of monitoring tool market in 2035?

The market size for the monitoring tool market is projected to reach USD 206.2 billion by 2035.

How much will be the monitoring tool market growth between 2025 and 2035?

The monitoring tool market is expected to grow at a 21.1% CAGR between 2025 and 2035.

What are the key product types in the monitoring tool market?

The key product types in monitoring tool market are software and services.

Which deployment segment to contribute significant share in the monitoring tool market in 2025?

In terms of deployment, cloud segment to command 57.3% share in the monitoring tool market in 2025.

Table of Content

  1. Executive Summary
    • Global Market Outlook
    • Demand-side Trends
    • Supply-side Trends
    • Technology Roadmap Analysis
    • Analysis and Recommendations
  2. Market Overview
    • Market Coverage / Taxonomy
    • Market Definition / Scope / Limitations
  3. Market Background
    • Market Dynamics
      • Drivers
      • Restraints
      • Opportunity
      • Trends
    • Scenario Forecast
      • Demand in Optimistic Scenario
      • Demand in Likely Scenario
      • Demand in Conservative Scenario
    • Opportunity Map Analysis
    • Product Life Cycle Analysis
    • Supply Chain Analysis
    • Investment Feasibility Matrix
    • Value Chain Analysis
    • PESTLE and Porter’s Analysis
    • Regulatory Landscape
    • Regional Parent Market Outlook
    • Production and Consumption Statistics
    • Import and Export Statistics
  4. Global Market Analysis 2020 to 2024 and Forecast, 2025 to 2035
    • Historical Market Size Value (USD Million) Analysis, 2020 to 2024
    • Current and Future Market Size Value (USD Million) Projections, 2025 to 2035
      • Y-o-Y Growth Trend Analysis
      • Absolute $ Opportunity Analysis
  5. Global Market Pricing Analysis 2020 to 2024 and Forecast 2025 to 2035
  6. Global Market Analysis 2020 to 2024 and Forecast 2025 to 2035, By Component
    • Introduction / Key Findings
    • Historical Market Size Value (USD Million) Analysis By Component , 2020 to 2024
    • Current and Future Market Size Value (USD Million) Analysis and Forecast By Component , 2025 to 2035
      • Software
      • Services
    • Y-o-Y Growth Trend Analysis By Component , 2020 to 2024
    • Absolute $ Opportunity Analysis By Component , 2025 to 2035
  7. Global Market Analysis 2020 to 2024 and Forecast 2025 to 2035, By Deployment
    • Introduction / Key Findings
    • Historical Market Size Value (USD Million) Analysis By Deployment, 2020 to 2024
    • Current and Future Market Size Value (USD Million) Analysis and Forecast By Deployment, 2025 to 2035
      • Cloud
      • On-Premises
    • Y-o-Y Growth Trend Analysis By Deployment, 2020 to 2024
    • Absolute $ Opportunity Analysis By Deployment, 2025 to 2035
  8. Global Market Analysis 2020 to 2024 and Forecast 2025 to 2035, By Type
    • Introduction / Key Findings
    • Historical Market Size Value (USD Million) Analysis By Type, 2020 to 2024
    • Current and Future Market Size Value (USD Million) Analysis and Forecast By Type, 2025 to 2035
      • Infrastructures
        • Network Monitoring
        • Storage Monitoring
        • Server Monitoring
        • Cloud Infrastructure Monitoring
        • Others
      • Application Performances
        • Database Monitoring
        • Web Application Monitoring
        • Mobile Application Monitoring
        • Code Level Monitoring
        • Others
      • Securitys
        • Intrusion Detection And Prevention Systems (IDPS)
        • Log Monitoring And Analysis
        • Vulnerability Assessment And Management
        • Others
      • End User Experiences
        • Synthetic Monitoring
        • Real User Monitoring
        • Others
    • Y-o-Y Growth Trend Analysis By Type, 2020 to 2024
    • Absolute $ Opportunity Analysis By Type, 2025 to 2035
  9. Global Market Analysis 2020 to 2024 and Forecast 2025 to 2035, By Vertical
    • Introduction / Key Findings
    • Historical Market Size Value (USD Million) Analysis By Vertical, 2020 to 2024
    • Current and Future Market Size Value (USD Million) Analysis and Forecast By Vertical, 2025 to 2035
      • BFSI
      • Retail & E-Commerce
      • Healthcare
      • IT & Telecom
      • Media & Entertainment
      • Manufacturing
      • Others
    • Y-o-Y Growth Trend Analysis By Vertical, 2020 to 2024
    • Absolute $ Opportunity Analysis By Vertical, 2025 to 2035
  10. Global Market Analysis 2020 to 2024 and Forecast 2025 to 2035, By Region
    • Introduction
    • Historical Market Size Value (USD Million) Analysis By Region, 2020 to 2024
    • Current Market Size Value (USD Million) Analysis and Forecast By Region, 2025 to 2035
      • North America
      • Latin America
      • Western Europe
      • Eastern Europe
      • East Asia
      • South Asia and Pacific
      • Middle East & Africa
    • Market Attractiveness Analysis By Region
  11. North America Market Analysis 2020 to 2024 and Forecast 2025 to 2035, By Country
    • Historical Market Size Value (USD Million) Trend Analysis By Market Taxonomy, 2020 to 2024
    • Market Size Value (USD Million) Forecast By Market Taxonomy, 2025 to 2035
      • By Country
        • USA
        • Canada
        • Mexico
      • By Component
      • By Deployment
      • By Type
      • By Vertical
    • Market Attractiveness Analysis
      • By Country
      • By Component
      • By Deployment
      • By Type
      • By Vertical
    • Key Takeaways
  12. Latin America Market Analysis 2020 to 2024 and Forecast 2025 to 2035, By Country
    • Historical Market Size Value (USD Million) Trend Analysis By Market Taxonomy, 2020 to 2024
    • Market Size Value (USD Million) Forecast By Market Taxonomy, 2025 to 2035
      • By Country
        • Brazil
        • Chile
        • Rest of Latin America
      • By Component
      • By Deployment
      • By Type
      • By Vertical
    • Market Attractiveness Analysis
      • By Country
      • By Component
      • By Deployment
      • By Type
      • By Vertical
    • Key Takeaways
  13. Western Europe Market Analysis 2020 to 2024 and Forecast 2025 to 2035, By Country
    • Historical Market Size Value (USD Million) Trend Analysis By Market Taxonomy, 2020 to 2024
    • Market Size Value (USD Million) Forecast By Market Taxonomy, 2025 to 2035
      • By Country
        • Germany
        • UK
        • Italy
        • Spain
        • France
        • Nordic
        • BENELUX
        • Rest of Western Europe
      • By Component
      • By Deployment
      • By Type
      • By Vertical
    • Market Attractiveness Analysis
      • By Country
      • By Component
      • By Deployment
      • By Type
      • By Vertical
    • Key Takeaways
  14. Eastern Europe Market Analysis 2020 to 2024 and Forecast 2025 to 2035, By Country
    • Historical Market Size Value (USD Million) Trend Analysis By Market Taxonomy, 2020 to 2024
    • Market Size Value (USD Million) Forecast By Market Taxonomy, 2025 to 2035
      • By Country
        • Russia
        • Poland
        • Hungary
        • Balkan & Baltic
        • Rest of Eastern Europe
      • By Component
      • By Deployment
      • By Type
      • By Vertical
    • Market Attractiveness Analysis
      • By Country
      • By Component
      • By Deployment
      • By Type
      • By Vertical
    • Key Takeaways
  15. East Asia Market Analysis 2020 to 2024 and Forecast 2025 to 2035, By Country
    • Historical Market Size Value (USD Million) Trend Analysis By Market Taxonomy, 2020 to 2024
    • Market Size Value (USD Million) Forecast By Market Taxonomy, 2025 to 2035
      • By Country
        • China
        • Japan
        • South Korea
      • By Component
      • By Deployment
      • By Type
      • By Vertical
    • Market Attractiveness Analysis
      • By Country
      • By Component
      • By Deployment
      • By Type
      • By Vertical
    • Key Takeaways
  16. South Asia and Pacific Market Analysis 2020 to 2024 and Forecast 2025 to 2035, By Country
    • Historical Market Size Value (USD Million) Trend Analysis By Market Taxonomy, 2020 to 2024
    • Market Size Value (USD Million) Forecast By Market Taxonomy, 2025 to 2035
      • By Country
        • India
        • ASEAN
        • Australia & New Zealand
        • Rest of South Asia and Pacific
      • By Component
      • By Deployment
      • By Type
      • By Vertical
    • Market Attractiveness Analysis
      • By Country
      • By Component
      • By Deployment
      • By Type
      • By Vertical
    • Key Takeaways
  17. Middle East & Africa Market Analysis 2020 to 2024 and Forecast 2025 to 2035, By Country
    • Historical Market Size Value (USD Million) Trend Analysis By Market Taxonomy, 2020 to 2024
    • Market Size Value (USD Million) Forecast By Market Taxonomy, 2025 to 2035
      • By Country
        • Kingdom of Saudi Arabia
        • Other GCC Countries
        • Turkiye
        • South Africa
        • Other African Union
        • Rest of Middle East & Africa
      • By Component
      • By Deployment
      • By Type
      • By Vertical
    • Market Attractiveness Analysis
      • By Country
      • By Component
      • By Deployment
      • By Type
      • By Vertical
    • Key Takeaways
  18. Key Countries Market Analysis
    • USA
      • Pricing Analysis
      • Market Share Analysis, 2024
        • By Component
        • By Deployment
        • By Type
        • By Vertical
    • Canada
      • Pricing Analysis
      • Market Share Analysis, 2024
        • By Component
        • By Deployment
        • By Type
        • By Vertical
    • Mexico
      • Pricing Analysis
      • Market Share Analysis, 2024
        • By Component
        • By Deployment
        • By Type
        • By Vertical
    • Brazil
      • Pricing Analysis
      • Market Share Analysis, 2024
        • By Component
        • By Deployment
        • By Type
        • By Vertical
    • Chile
      • Pricing Analysis
      • Market Share Analysis, 2024
        • By Component
        • By Deployment
        • By Type
        • By Vertical
    • Germany
      • Pricing Analysis
      • Market Share Analysis, 2024
        • By Component
        • By Deployment
        • By Type
        • By Vertical
    • UK
      • Pricing Analysis
      • Market Share Analysis, 2024
        • By Component
        • By Deployment
        • By Type
        • By Vertical
    • Italy
      • Pricing Analysis
      • Market Share Analysis, 2024
        • By Component
        • By Deployment
        • By Type
        • By Vertical
    • Spain
      • Pricing Analysis
      • Market Share Analysis, 2024
        • By Component
        • By Deployment
        • By Type
        • By Vertical
    • France
      • Pricing Analysis
      • Market Share Analysis, 2024
        • By Component
        • By Deployment
        • By Type
        • By Vertical
    • India
      • Pricing Analysis
      • Market Share Analysis, 2024
        • By Component
        • By Deployment
        • By Type
        • By Vertical
    • ASEAN
      • Pricing Analysis
      • Market Share Analysis, 2024
        • By Component
        • By Deployment
        • By Type
        • By Vertical
    • Australia & New Zealand
      • Pricing Analysis
      • Market Share Analysis, 2024
        • By Component
        • By Deployment
        • By Type
        • By Vertical
    • China
      • Pricing Analysis
      • Market Share Analysis, 2024
        • By Component
        • By Deployment
        • By Type
        • By Vertical
    • Japan
      • Pricing Analysis
      • Market Share Analysis, 2024
        • By Component
        • By Deployment
        • By Type
        • By Vertical
    • South Korea
      • Pricing Analysis
      • Market Share Analysis, 2024
        • By Component
        • By Deployment
        • By Type
        • By Vertical
    • Russia
      • Pricing Analysis
      • Market Share Analysis, 2024
        • By Component
        • By Deployment
        • By Type
        • By Vertical
    • Poland
      • Pricing Analysis
      • Market Share Analysis, 2024
        • By Component
        • By Deployment
        • By Type
        • By Vertical
    • Hungary
      • Pricing Analysis
      • Market Share Analysis, 2024
        • By Component
        • By Deployment
        • By Type
        • By Vertical
    • Kingdom of Saudi Arabia
      • Pricing Analysis
      • Market Share Analysis, 2024
        • By Component
        • By Deployment
        • By Type
        • By Vertical
    • Turkiye
      • Pricing Analysis
      • Market Share Analysis, 2024
        • By Component
        • By Deployment
        • By Type
        • By Vertical
    • South Africa
      • Pricing Analysis
      • Market Share Analysis, 2024
        • By Component
        • By Deployment
        • By Type
        • By Vertical
  19. Market Structure Analysis
    • Competition Dashboard
    • Competition Benchmarking
    • Market Share Analysis of Top Players
      • By Regional
      • By Component
      • By Deployment
      • By Type
      • By Vertical
  20. Competition Analysis
    • Competition Deep Dive
      • Datadog
        • Overview
        • Product Portfolio
        • Profitability by Market Segments (Product/Age /Sales Channel/Region)
        • Sales Footprint
        • Strategy Overview
          • Marketing Strategy
          • Product Strategy
          • Channel Strategy
      • Dynatrace
      • Cisco
      • AWS (Amazon Web Services)
      • Google
      • IBM
      • Atera
      • Checkmk
      • Idera
      • Exoprise
      • Icinga
      • ITRS
      • Better Stack
  21. Assumptions & Acronyms Used
  22. Research Methodology

List of Tables

  • Table 1: Global Market Value (USD Million) Forecast by Region, 2020-2035
  • Table 2: Global Market Value (USD Million) Forecast by Component , 2020-2035
  • Table 3: Global Market Value (USD Million) Forecast by Deployment, 2020-2035
  • Table 4: Global Market Value (USD Million) Forecast by Type, 2020-2035
  • Table 5: Global Market Value (USD Million) Forecast by Vertical, 2020-2035
  • Table 6: North America Market Value (USD Million) Forecast by Country, 2020-2035
  • Table 7: North America Market Value (USD Million) Forecast by Component , 2020-2035
  • Table 8: North America Market Value (USD Million) Forecast by Deployment, 2020-2035
  • Table 9: North America Market Value (USD Million) Forecast by Type, 2020-2035
  • Table 10: North America Market Value (USD Million) Forecast by Vertical, 2020-2035
  • Table 11: Latin America Market Value (USD Million) Forecast by Country, 2020-2035
  • Table 12: Latin America Market Value (USD Million) Forecast by Component , 2020-2035
  • Table 13: Latin America Market Value (USD Million) Forecast by Deployment, 2020-2035
  • Table 14: Latin America Market Value (USD Million) Forecast by Type, 2020-2035
  • Table 15: Latin America Market Value (USD Million) Forecast by Vertical, 2020-2035
  • Table 16: Western Europe Market Value (USD Million) Forecast by Country, 2020-2035
  • Table 17: Western Europe Market Value (USD Million) Forecast by Component , 2020-2035
  • Table 18: Western Europe Market Value (USD Million) Forecast by Deployment, 2020-2035
  • Table 19: Western Europe Market Value (USD Million) Forecast by Type, 2020-2035
  • Table 20: Western Europe Market Value (USD Million) Forecast by Vertical, 2020-2035
  • Table 21: Eastern Europe Market Value (USD Million) Forecast by Country, 2020-2035
  • Table 22: Eastern Europe Market Value (USD Million) Forecast by Component , 2020-2035
  • Table 23: Eastern Europe Market Value (USD Million) Forecast by Deployment, 2020-2035
  • Table 24: Eastern Europe Market Value (USD Million) Forecast by Type, 2020-2035
  • Table 25: Eastern Europe Market Value (USD Million) Forecast by Vertical, 2020-2035
  • Table 26: East Asia Market Value (USD Million) Forecast by Country, 2020-2035
  • Table 27: East Asia Market Value (USD Million) Forecast by Component , 2020-2035
  • Table 28: East Asia Market Value (USD Million) Forecast by Deployment, 2020-2035
  • Table 29: East Asia Market Value (USD Million) Forecast by Type, 2020-2035
  • Table 30: East Asia Market Value (USD Million) Forecast by Vertical, 2020-2035
  • Table 31: South Asia and Pacific Market Value (USD Million) Forecast by Country, 2020-2035
  • Table 32: South Asia and Pacific Market Value (USD Million) Forecast by Component , 2020-2035
  • Table 33: South Asia and Pacific Market Value (USD Million) Forecast by Deployment, 2020-2035
  • Table 34: South Asia and Pacific Market Value (USD Million) Forecast by Type, 2020-2035
  • Table 35: South Asia and Pacific Market Value (USD Million) Forecast by Vertical, 2020-2035
  • Table 36: Middle East & Africa Market Value (USD Million) Forecast by Country, 2020-2035
  • Table 37: Middle East & Africa Market Value (USD Million) Forecast by Component , 2020-2035
  • Table 38: Middle East & Africa Market Value (USD Million) Forecast by Deployment, 2020-2035
  • Table 39: Middle East & Africa Market Value (USD Million) Forecast by Type, 2020-2035
  • Table 40: Middle East & Africa Market Value (USD Million) Forecast by Vertical, 2020-2035

List of Figures

  • Figure 1: Global Market Pricing Analysis
  • Figure 2: Global Market Value (USD Million) Forecast 2020-2035
  • Figure 3: Global Market Value Share and BPS Analysis by Component , 2025 and 2035
  • Figure 4: Global Market Y-o-Y Growth Comparison by Component , 2025-2035
  • Figure 5: Global Market Attractiveness Analysis by Component
  • Figure 6: Global Market Value Share and BPS Analysis by Deployment, 2025 and 2035
  • Figure 7: Global Market Y-o-Y Growth Comparison by Deployment, 2025-2035
  • Figure 8: Global Market Attractiveness Analysis by Deployment
  • Figure 9: Global Market Value Share and BPS Analysis by Type, 2025 and 2035
  • Figure 10: Global Market Y-o-Y Growth Comparison by Type, 2025-2035
  • Figure 11: Global Market Attractiveness Analysis by Type
  • Figure 12: Global Market Value Share and BPS Analysis by Vertical, 2025 and 2035
  • Figure 13: Global Market Y-o-Y Growth Comparison by Vertical, 2025-2035
  • Figure 14: Global Market Attractiveness Analysis by Vertical
  • Figure 15: Global Market Value (USD Million) Share and BPS Analysis by Region, 2025 and 2035
  • Figure 16: Global Market Y-o-Y Growth Comparison by Region, 2025-2035
  • Figure 17: Global Market Attractiveness Analysis by Region
  • Figure 18: North America Market Incremental Dollar Opportunity, 2025-2035
  • Figure 19: Latin America Market Incremental Dollar Opportunity, 2025-2035
  • Figure 20: Western Europe Market Incremental Dollar Opportunity, 2025-2035
  • Figure 21: Eastern Europe Market Incremental Dollar Opportunity, 2025-2035
  • Figure 22: East Asia Market Incremental Dollar Opportunity, 2025-2035
  • Figure 23: South Asia and Pacific Market Incremental Dollar Opportunity, 2025-2035
  • Figure 24: Middle East & Africa Market Incremental Dollar Opportunity, 2025-2035
  • Figure 25: North America Market Value Share and BPS Analysis by Country, 2025 and 2035
  • Figure 26: North America Market Value Share and BPS Analysis by Component , 2025 and 2035
  • Figure 27: North America Market Y-o-Y Growth Comparison by Component , 2025-2035
  • Figure 28: North America Market Attractiveness Analysis by Component
  • Figure 29: North America Market Value Share and BPS Analysis by Deployment, 2025 and 2035
  • Figure 30: North America Market Y-o-Y Growth Comparison by Deployment, 2025-2035
  • Figure 31: North America Market Attractiveness Analysis by Deployment
  • Figure 32: North America Market Value Share and BPS Analysis by Type, 2025 and 2035
  • Figure 33: North America Market Y-o-Y Growth Comparison by Type, 2025-2035
  • Figure 34: North America Market Attractiveness Analysis by Type
  • Figure 35: North America Market Value Share and BPS Analysis by Vertical, 2025 and 2035
  • Figure 36: North America Market Y-o-Y Growth Comparison by Vertical, 2025-2035
  • Figure 37: North America Market Attractiveness Analysis by Vertical
  • Figure 38: Latin America Market Value Share and BPS Analysis by Country, 2025 and 2035
  • Figure 39: Latin America Market Value Share and BPS Analysis by Component , 2025 and 2035
  • Figure 40: Latin America Market Y-o-Y Growth Comparison by Component , 2025-2035
  • Figure 41: Latin America Market Attractiveness Analysis by Component
  • Figure 42: Latin America Market Value Share and BPS Analysis by Deployment, 2025 and 2035
  • Figure 43: Latin America Market Y-o-Y Growth Comparison by Deployment, 2025-2035
  • Figure 44: Latin America Market Attractiveness Analysis by Deployment
  • Figure 45: Latin America Market Value Share and BPS Analysis by Type, 2025 and 2035
  • Figure 46: Latin America Market Y-o-Y Growth Comparison by Type, 2025-2035
  • Figure 47: Latin America Market Attractiveness Analysis by Type
  • Figure 48: Latin America Market Value Share and BPS Analysis by Vertical, 2025 and 2035
  • Figure 49: Latin America Market Y-o-Y Growth Comparison by Vertical, 2025-2035
  • Figure 50: Latin America Market Attractiveness Analysis by Vertical
  • Figure 51: Western Europe Market Value Share and BPS Analysis by Country, 2025 and 2035
  • Figure 52: Western Europe Market Value Share and BPS Analysis by Component , 2025 and 2035
  • Figure 53: Western Europe Market Y-o-Y Growth Comparison by Component , 2025-2035
  • Figure 54: Western Europe Market Attractiveness Analysis by Component
  • Figure 55: Western Europe Market Value Share and BPS Analysis by Deployment, 2025 and 2035
  • Figure 56: Western Europe Market Y-o-Y Growth Comparison by Deployment, 2025-2035
  • Figure 57: Western Europe Market Attractiveness Analysis by Deployment
  • Figure 58: Western Europe Market Value Share and BPS Analysis by Type, 2025 and 2035
  • Figure 59: Western Europe Market Y-o-Y Growth Comparison by Type, 2025-2035
  • Figure 60: Western Europe Market Attractiveness Analysis by Type
  • Figure 61: Western Europe Market Value Share and BPS Analysis by Vertical, 2025 and 2035
  • Figure 62: Western Europe Market Y-o-Y Growth Comparison by Vertical, 2025-2035
  • Figure 63: Western Europe Market Attractiveness Analysis by Vertical
  • Figure 64: Eastern Europe Market Value Share and BPS Analysis by Country, 2025 and 2035
  • Figure 65: Eastern Europe Market Value Share and BPS Analysis by Component , 2025 and 2035
  • Figure 66: Eastern Europe Market Y-o-Y Growth Comparison by Component , 2025-2035
  • Figure 67: Eastern Europe Market Attractiveness Analysis by Component
  • Figure 68: Eastern Europe Market Value Share and BPS Analysis by Deployment, 2025 and 2035
  • Figure 69: Eastern Europe Market Y-o-Y Growth Comparison by Deployment, 2025-2035
  • Figure 70: Eastern Europe Market Attractiveness Analysis by Deployment
  • Figure 71: Eastern Europe Market Value Share and BPS Analysis by Type, 2025 and 2035
  • Figure 72: Eastern Europe Market Y-o-Y Growth Comparison by Type, 2025-2035
  • Figure 73: Eastern Europe Market Attractiveness Analysis by Type
  • Figure 74: Eastern Europe Market Value Share and BPS Analysis by Vertical, 2025 and 2035
  • Figure 75: Eastern Europe Market Y-o-Y Growth Comparison by Vertical, 2025-2035
  • Figure 76: Eastern Europe Market Attractiveness Analysis by Vertical
  • Figure 77: East Asia Market Value Share and BPS Analysis by Country, 2025 and 2035
  • Figure 78: East Asia Market Value Share and BPS Analysis by Component , 2025 and 2035
  • Figure 79: East Asia Market Y-o-Y Growth Comparison by Component , 2025-2035
  • Figure 80: East Asia Market Attractiveness Analysis by Component
  • Figure 81: East Asia Market Value Share and BPS Analysis by Deployment, 2025 and 2035
  • Figure 82: East Asia Market Y-o-Y Growth Comparison by Deployment, 2025-2035
  • Figure 83: East Asia Market Attractiveness Analysis by Deployment
  • Figure 84: East Asia Market Value Share and BPS Analysis by Type, 2025 and 2035
  • Figure 85: East Asia Market Y-o-Y Growth Comparison by Type, 2025-2035
  • Figure 86: East Asia Market Attractiveness Analysis by Type
  • Figure 87: East Asia Market Value Share and BPS Analysis by Vertical, 2025 and 2035
  • Figure 88: East Asia Market Y-o-Y Growth Comparison by Vertical, 2025-2035
  • Figure 89: East Asia Market Attractiveness Analysis by Vertical
  • Figure 90: South Asia and Pacific Market Value Share and BPS Analysis by Country, 2025 and 2035
  • Figure 91: South Asia and Pacific Market Value Share and BPS Analysis by Component , 2025 and 2035
  • Figure 92: South Asia and Pacific Market Y-o-Y Growth Comparison by Component , 2025-2035
  • Figure 93: South Asia and Pacific Market Attractiveness Analysis by Component
  • Figure 94: South Asia and Pacific Market Value Share and BPS Analysis by Deployment, 2025 and 2035
  • Figure 95: South Asia and Pacific Market Y-o-Y Growth Comparison by Deployment, 2025-2035
  • Figure 96: South Asia and Pacific Market Attractiveness Analysis by Deployment
  • Figure 97: South Asia and Pacific Market Value Share and BPS Analysis by Type, 2025 and 2035
  • Figure 98: South Asia and Pacific Market Y-o-Y Growth Comparison by Type, 2025-2035
  • Figure 99: South Asia and Pacific Market Attractiveness Analysis by Type
  • Figure 100: South Asia and Pacific Market Value Share and BPS Analysis by Vertical, 2025 and 2035
  • Figure 101: South Asia and Pacific Market Y-o-Y Growth Comparison by Vertical, 2025-2035
  • Figure 102: South Asia and Pacific Market Attractiveness Analysis by Vertical
  • Figure 103: Middle East & Africa Market Value Share and BPS Analysis by Country, 2025 and 2035
  • Figure 104: Middle East & Africa Market Value Share and BPS Analysis by Component , 2025 and 2035
  • Figure 105: Middle East & Africa Market Y-o-Y Growth Comparison by Component , 2025-2035
  • Figure 106: Middle East & Africa Market Attractiveness Analysis by Component
  • Figure 107: Middle East & Africa Market Value Share and BPS Analysis by Deployment, 2025 and 2035
  • Figure 108: Middle East & Africa Market Y-o-Y Growth Comparison by Deployment, 2025-2035
  • Figure 109: Middle East & Africa Market Attractiveness Analysis by Deployment
  • Figure 110: Middle East & Africa Market Value Share and BPS Analysis by Type, 2025 and 2035
  • Figure 111: Middle East & Africa Market Y-o-Y Growth Comparison by Type, 2025-2035
  • Figure 112: Middle East & Africa Market Attractiveness Analysis by Type
  • Figure 113: Middle East & Africa Market Value Share and BPS Analysis by Vertical, 2025 and 2035
  • Figure 114: Middle East & Africa Market Y-o-Y Growth Comparison by Vertical, 2025-2035
  • Figure 115: Middle East & Africa Market Attractiveness Analysis by Vertical
  • Figure 116: Global Market - Tier Structure Analysis
  • Figure 117: Global Market - Company Share Analysis
Dashboard
Dashboard
Dashboard
Dashboard
Dashboard
Dashboard

Full Research Suite comprises of:

Market outlook & trends analysis

Market outlook & trends analysis

Interviews & case studies

Interviews & case studies

Strategic recommendations

Strategic recommendations

Vendor profiles & capabilities analysis

Vendor profiles & capabilities analysis

5-year forecasts

5-year forecasts

8 regions and 60+ country-level data splits

8 regions and 60+ country-level data splits

Market segment data splits

Market segment data splits

12 months of continuous data updates

12 months of continuous data updates

DELIVERED AS:

PDF EXCEL ONLINE

Full Research Suite


$5000

$7500

$10000

Buy Report Now
Similar Industry Reports

Similar Industry Reports

Media Monitoring Tools Market

Media Monitoring Tools Market Size and Share Forecast Outlook 2025 to 2035

Network Fault Monitoring Tools Market

Network Fault Monitoring Tools Market Size and Share Forecast Outlook 2025 to 2035

Advanced Server Energy Monitoring Tools Market

Advanced Server Energy Monitoring Tools Market Size and Share Forecast Outlook 2025 to 2035

Application Metrics And Monitoring Tools Market

Application Metrics and Monitoring Tools Market Analysis By Component, Mode, Deployment, Verticals, and Region through 2035

Pet Monitoring Camera Market

Pet Monitoring Camera Market Size and Share Forecast Outlook 2025 to 2035

Pain Monitoring Devices Market

Pain Monitoring Devices Market Size and Share Forecast Outlook 2025 to 2035

Dose Monitoring Devices Market

Dose Monitoring Devices Market - Growth & Demand 2025 to 2035

Brain Monitoring Market

Brain Monitoring Market Size and Share Forecast Outlook 2025 to 2035

Motor Monitoring Market

Motor Monitoring Market Size and Share Forecast Outlook 2025 to 2035

Neuro-monitoring System Market

Neuro-monitoring System Market Size and Share Forecast Outlook 2025 to 2035

Noise Monitoring Devices Market

Noise Monitoring Devices Market Size and Share Forecast Outlook 2025 to 2035

Nerve Monitoring Devices Market

Nerve Monitoring Devices Market Insights - Growth & Forecast 2025 to 2035

Power Monitoring Market

Power Monitoring Market Report - Growth, Demand & Forecast 2025 to 2035

Urine Monitoring Systems Market

Urine Monitoring Systems Market Analysis - Size, Trends & Forecast 2025 to 2035

Brain Monitoring Systems Market

Brain Monitoring Systems Market is segmented by Lateral Flow Readers and Kits and Reagents from 2025 to 2035

Flare Monitoring Market

Flare Monitoring Market

Yield Monitoring Systems Market

Yield Monitoring Systems Market

Driver Monitoring System Market

Driver Monitoring System Market Growth - Trends & Forecast 2025 to 2035

Tunnel Monitoring System Market

Tunnel Monitoring System Market Growth - Trends & Forecast 2025 to 2035

Patient Monitoring System Market

Patient Monitoring System Market Size and Share Forecast Outlook 2025 to 2035

Future Market Insights

Monitoring Tool Market

Chat With MaRIA

Chat With

MaRIA

Hi There, I am MaRIA, Your Market Research Intelligence Assistant. How may I help you?