Reports

- Global Locations -

Headquarters

Future Market Insights, Inc.

Christiana Corporate, 200
Continental Drive, Suite 401,
Newark, Delaware - 19713,
United States

T: +1-845-579-5705

Americas

Future Market Insights, Inc.

616 Corporate Way, Suite 2-9018,
Valley Cottage, NY 10989, United States

T: +1-347-918-3531

MEA

Future Market Insights

1602-6 Jumeirah Bay X2 Tower, Plot No: JLT-PH2-X2A,
Jumeirah Lakes Towers, Dubai,
United Arab Emirates

Europe

Future Market Insights

3rd Floor, 207 Regent Street,
W1B 3HH London
United Kingdom

T: + 44 (0) 20 8123 9659
D: +44 (0) 20 3287 4268

Asia Pacific

Future Market Insights

IndiaLand Global Tech Park, Unit UG-1, Behind Grand HighStreet, Phase 1, Hinjawadi, MH, Pune – 411057, India

Neuro Monitoring System Market Snapshot (2022-2032)

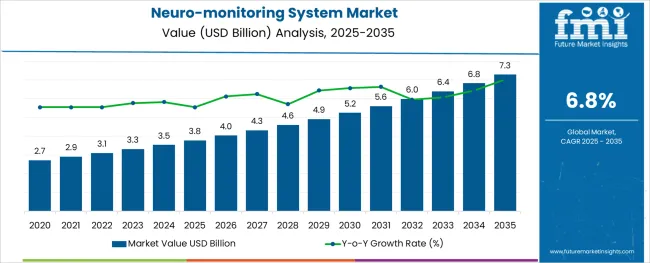
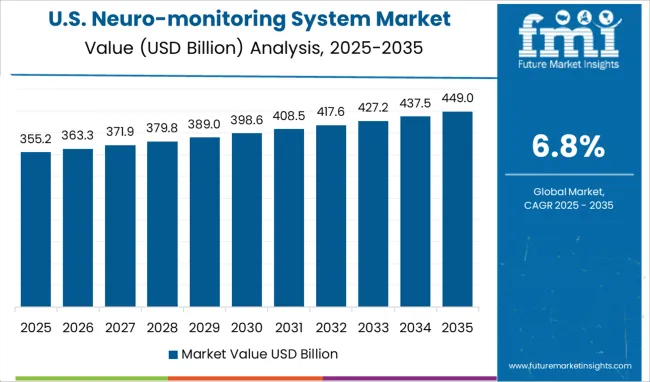
[250 Pages Report] The global neuro monitoring system market size is anticipated to be valued at US$ 9.4 Billion in 2032. An increasing number of critical and complex surgeries across the globe is set to propel the neuro-monitoring system market in the upcoming years. According to FMI, demand for neuro-monitoring systems is likely to reach US$ 3.1 Billion in 2022 and exhibit steady growth at 6.8% CAGR in the forecast period from 2022 to 2032.

Report Attribute Details
Neuro Monitoring System Market Estimated Base Year Value (2021) US$ 2.5 Billion
Neuro Monitoring System Market Expected Market Value (2022) US$ 3.1 Billion
Neuro Monitoring System Market Anticipated Forecast Value (2032) US$ 9.4 Billion
Neuro Monitoring System Market Projected Growth Rate (2022 to 2032) 6.8% CAGR

Neuro monitoring or nerve monitoring systems are considered to be novel techniques that can lower the risk of neurological defects after surgeries take place. These are associated with those surgeries that can negatively affect the nervous system.

Sales of neuromonitoring systems are expected to surge in future years owing to their ability to reduce the risk of paralysis, hearing loss, and muscle weakness. These systems are also capable of upgrading the outcomes amid a spinal surgery, increasing safety, and delivering immediate feedback.

Besides, neuro-monitoring systems can measure electrically evoked signals from the nerves to provide real-time information about their activities. These are considered to be ideal for preventing severe damage to the nervous system.

Various educational and research institutions are anticipated to conduct more R&D activities to discover new techniques. In May 2022, for instance, the Montreal Neurological Institute and Hospital recruited 70 medical students for performing virtual brain tumour removals.

They had to do it on a neurosurgical simulator and were provided with instructions from a remote expert instructor or AI tutor. Similar other innovations in the neuro-monitoring system market are likely to drive growth.

Don't pay for what you don't need

Customize your report by selecting specific countries or regions and save 30%!

Which Beneficial Properties Are Pushing the Neuro Monitoring System Market Growth

Demand for neuromonitoring systems is likely to grow at a fast pace on the back of the rising prevalence of chronic diseases. The increasing number of road accidents is another major factor that is estimated to augur well for the market. Also, increasing awareness among doctors regarding the benefits of neuro-monitoring systems is expected to propel the market.

As these systems are capable of assessing the correct placement screws during surgeries, these can prevent the risk of nerve intrusion. At the same time, these can monitor the parts of the spinal cord that can further assist in the detection of sensory changes in an individual’s body.

Which Factors May Hamper the Neuro Monitoring System Market Growth

The lack of knowledge about the availability of numerous cutting-edge healthcare devices, especially in underdeveloped countries is projected to hamper the expansion of the neuro-monitoring system market size. Also, these systems require high initial installation costs, which may not be feasible for small-scale enterprises based in emerging economies. This factor may also obstruct the market in the evaluation period.
Sabyasachi Ghosh
Sabyasachi Ghosh

Principal Consultant

Talk to Analyst

Find your sweet spots for generating winning opportunities in this market.

How Are Clinical Trials Propelling the North America Neuro Monitoring System Market

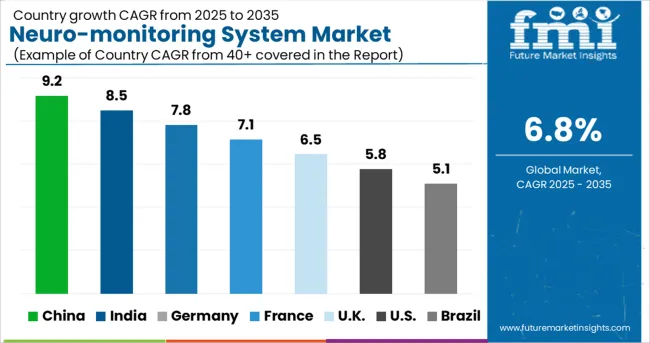
In terms of region, North America is likely to remain at the forefront by accounting for the largest neuro-monitoring system market share in the upcoming years. This growth is attributable to the robust presence of various prominent healthcare device manufacturers in the U.S. and Canada. The availability of well-established healthcare infrastructure in these countries is another crucial factor that is estimated to augment growth.

In addition to that, the large patient population suffering from chronic diseases is set to contribute to this growth. The rising number of clinical trials conducted by research institutions to prove the therapeutic efficacy of neuro-monitoring systems is another significant factor that is expected to bolster the market.
Is Technological Advancement Augmenting the Asia Pacific Neuro Monitoring System Market

The easy availability of favourable medical reimbursement policies in China, Japan, India, and South Korea is projected to foster the Asia Pacific neuro monitoring system market growth in future years. The increasing awareness among healthcare professionals about various clinical benefits related to nerve monitoring is anticipated to boost the regional market.

Furthermore, the growing usage of intraoperative nerve monitoring systems during various surgeries and ongoing technological advancements in the field of nerve stimulation is expected to aid growth. An increasing number of surgical centres and hospitals across the Asia Pacific owing to rising investments by governments is another vital factor that is set to drive the market.
Get the data you need at a Fraction of the cost

Personalize your report by choosing insights you need
and save 40%!

Market Competition

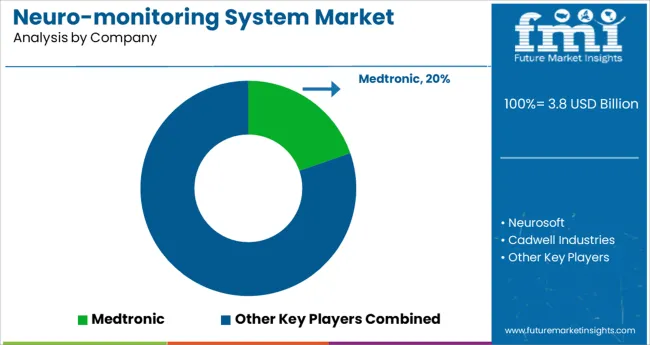
Some of the leading companies present in the global neuro monitoring system market include NuVasive Inc., Inomed Medizintechnik GmbH, AXIS Neuromonitoring, LLC, Accurate Monitoring, SpecialityCare, Medtronic, Biotronic NeuroNetwork Sentient Medical Systems, Natus Medical Incorporated, and Neuromonitoring Technologies among others.

The global market is highly competitive with the presence of a large number of key players. The majority of these companies are engaging in mergers and acquisitions with local enterprises to co-develop innovative products and attract more customers. A few other companies in the market are striving to expand their portfolios by introducing novel products and surging sales of neuro-monitoring systems.

Report Scope

Report Attribute Details
Growth Rate CAGR of 6.8% from 2022 to 2032
Base Year for Estimation 2021
Historical Data 2015 to 2020
Forecast Period 2022 to 2032
Quantitative Units Revenue in USD Million and CAGR from 2022 to 2032
Report Coverage Revenue Forecast, Volume Forecast, Company Ranking, Competitive Landscape, Growth Factors, Trends and Pricing Analysis
Segments Covered
  • Type
  • Application
  • End Users
  • Region
Regions Covered
  • North America
  • Latin America
  • Western Europe
  • Eastern Europe
  • APEJ
  • Japan
  • Middle East and Africa
Key Countries Profiled
  • USA
  • Canada
  • Brazil
  • Argentina
  • Germany
  • UK
  • France
  • Spain
  • Italy
  • Nordics
  • BENELUX
  • Australia & New Zealand
  • China
  • India
  • ASEAN
  • GCC
  • South Africa
Key Companies Profiled
  • NuVasive Inc.
  • Inomed Medizintechnik GmbH
  • AXIS Neuromonitoring, LLC
  • Accurate Monitoring
  • SpecialityCare
  • Medtronic
  • Biotronic NeuroNetwork Sentient Medical Systems
  • Natus Medical Incorporated
  • Neuromonitoring Technologies

Key Segments Profiled in the Neuro Monitoring System Industry Survey

By Type:

  • Sub-sensory Evoked Potentials
  • Motor-sensory Evoked Potentials
  • Brainstem Auditory Evoked Potentials (BAEP)
  • Visual Evoked Potentials (VEP)
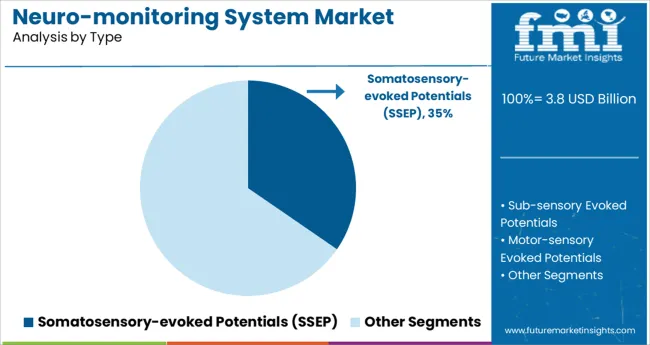
  • Somatosensory-evoked Potentials (SSEP)
  • Mapping for Motor-cortex

By Application:

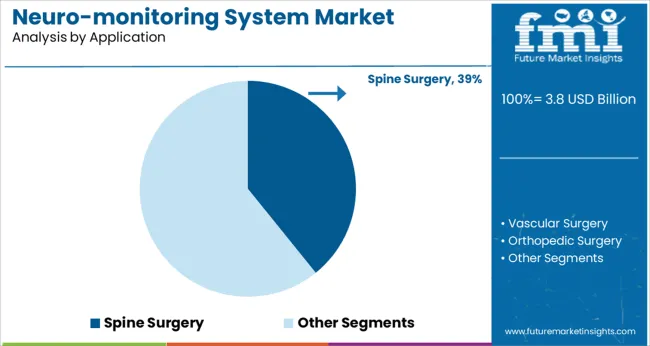
  • Spine Surgery
  • Vascular Surgery
  • Orthopedic Surgery
  • ENT Surgery

By End Users:

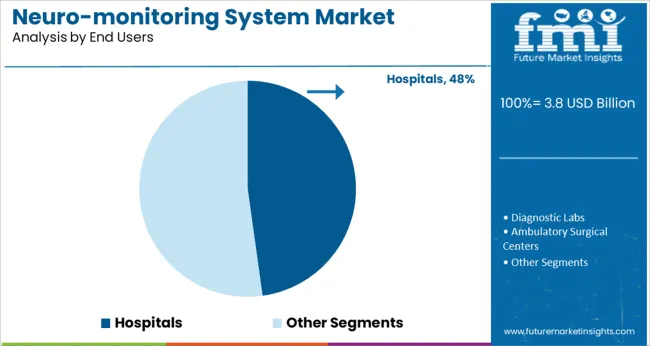
  • Hospitals
  • Diagnostic Labs
  • Ambulatory Surgical Centers
  • Outpatient Clinics

By Region:

  • North America
  • Latin America
  • Eastern Europe
  • Western Europe
  • Asia Pacific Excluding Japan and China
  • China
  • Japan
  • Middle East & Africa

Frequently Asked Questions

At what rate will the neuro monitoring system market grow?

The global neuro monitoring system market is likely to exceed US$ 9.4 Billion in 2032.

Which region is set to lead the neuro monitoring system market?

North America is set to lead the neuro monitoring system market in the forecast period.

Which are some of the renowned companies in the neuro monitoring system market?

NuVasive Inc., Inomed Medizintechnik GmbH, AXIS Neuromonitoring, LLC, Accurate Monitoring, SpecialityCare, and Medtronic are some of the renowned companies in the neuro monitoring system market.

Table of Content

1. Executive Summary

    1.1. Global Market Outlook

    1.2. Demand-side Trends

    1.3. Supply-side Trends

    1.4. Technology Roadmap Analysis

    1.5. Analysis and Recommendations

2. Market Overview

    2.1. Market Coverage / Taxonomy

    2.2. Market Definition / Scope / Limitations

3. Market Background

    3.1. Market Dynamics

        3.1.1. Drivers

        3.1.2. Restraints

        3.1.3. Opportunity

        3.1.4. Trends

    3.2. Scenario Forecast

        3.2.1. Demand in Optimistic Scenario

        3.2.2. Demand in Likely Scenario

        3.2.3. Demand in Conservative Scenario

    3.3. Opportunity Map Analysis

    3.4. Product Life Cycle Analysis

    3.5. Supply Chain Analysis

        3.5.1. Supply Side Participants and their Roles

            3.5.1.1. Producers

            3.5.1.2. Mid-Level Participants (Traders/ Agents/ Brokers)

            3.5.1.3. Wholesalers and Distributors

        3.5.2. Value Added and Value Created at Node in the Supply Chain

        3.5.3. List of Raw Material Suppliers

        3.5.4. List of Existing and Potential Buyer’s

    3.6. Investment Feasibility Matrix

    3.7. Value Chain Analysis

        3.7.1. Profit Margin Analysis

        3.7.2. Wholesalers and Distributors

        3.7.3. Retailers

    3.8. PESTLE and Porter’s Analysis

    3.9. Regulatory Landscape

        3.9.1. By Key Regions

        3.9.2. By Key Countries

    3.10. Regional Parent Market Outlook

    3.11. Production and Consumption Statistics

    3.12. Import and Export Statistics

4. Global Neuro-monitoring System Market Analysis 2017-2021 and Forecast, 2022-2032

    4.1. Historical Market Size Value (US$ Mn) & Volume (Units) Analysis, 2017-2021

    4.2. Current and Future Market Size Value (US$ Mn) & Volume (Units) Projections, 2022-2032

        4.2.1. Y-o-Y Growth Trend Analysis

        4.2.2. Absolute $ Opportunity Analysis

5. Global Neuro-monitoring System Market Analysis 2017-2021 and Forecast 2022-2032, By Product Type

    5.1. Introduction / Key Findings

    5.2. Historical Market Size Value (US$ Mn) & Volume (Units) Analysis By Product Type, 2017-2021

    5.3. Current and Future Market Size Value (US$ Mn) & Volume (Units) Analysis and Forecast By Product Type, 2022-2032

        5.3.1. Instruments

        5.3.2. Nerve Stimulation Electrodes and Probes

        5.3.3. Accessories

    5.4. Y-o-Y Growth Trend Analysis By Product Type, 2017-2021

    5.5. Absolute $ Opportunity Analysis By Product Type, 2022-2032

Deep-dive segmentation will be available in the sample on request

6. Global Neuro-monitoring System Market Analysis 2017-2021 and Forecast 2022-2032, By Application

    6.1. Introduction / Key Findings

    6.2. Historical Market Size Value (US$ Mn) & Volume (Units) Analysis By Application, 2017-2021

    6.3. Current and Future Market Size Value (US$ Mn) & Volume (Units) Analysis and Forecast By Application, 2022-2032

        6.3.1. Functional Neurosurgery

        6.3.2. Carotid Endarterectomy

        6.3.3. Epilepsy Surgery

        6.3.4. Stereotactic Surgery

        6.3.5. Carotid Endarterectomy

        6.3.6. Pelvic Fracture Surgery

        6.3.7. Vestibular Nerve Section

        6.3.8. Orbital Surgery

        6.3.9. Others

    6.4. Y-o-Y Growth Trend Analysis By Application, 2017-2021

    6.5. Absolute $ Opportunity Analysis By Application, 2022-2032

Deep-dive segmentation will be available in the sample on request

7. Global Neuro-monitoring System Market Analysis 2017-2021 and Forecast 2022-2032, By Technology

    7.1. Introduction / Key Findings

    7.2. Historical Market Size Value (US$ Mn) & Volume (Units) Analysis By Technology, 2017-2021

    7.3. Current and Future Market Size Value (US$ Mn) & Volume (Units) Analysis and Forecast By Technology, 2022-2032

        7.3.1. Motor-Sensory Evoked Potentials

        7.3.2. Sub-Sensory Evoked Potentials

        7.3.3. Mapping for Motor-Cortex

        7.3.4. Electromyography (EMG)

        7.3.5. Electroencephalography (EEG)

    7.4. Y-o-Y Growth Trend Analysis By Technology, 2017-2021

    7.5. Absolute $ Opportunity Analysis By Technology, 2022-2032

Deep-dive segmentation will be available in the sample on request

8. Global Neuro-monitoring System Market Analysis 2017-2021 and Forecast 2022-2032, By End Users

    8.1. Introduction / Key Findings

    8.2. Historical Market Size Value (US$ Mn) & Volume (Units) Analysis By End Users, 2017-2021

    8.3. Current and Future Market Size Value (US$ Mn) & Volume (Units) Analysis and Forecast By End Users, 2022-2032

        8.3.1. Hospitals

        8.3.2. Ambulatory Surgical Centers

        8.3.3. Diagnostic Centers

        8.3.4. Neonatal Intensive Care Value (US$ Mn) & Volume (Units)

        8.3.5. Intensive Care Value (US$ Mn) & Volume (Units)

        8.3.6. Specialized Clinics

    8.4. Y-o-Y Growth Trend Analysis By End Users, 2017-2021

    8.5. Absolute $ Opportunity Analysis By End Users, 2022-2032

Deep-dive segmentation will be available in the sample on request

9. Global Neuro-monitoring System Market Analysis 2017-2021 and Forecast 2022-2032, By Region

    9.1. Introduction

    9.2. Historical Market Size Value (US$ Mn) & Volume (Units) Analysis By Region, 2017-2021

    9.3. Current Market Size Value (US$ Mn) & Volume (Units) Analysis and Forecast By Region, 2022-2032

        9.3.1. North America

        9.3.2. Latin America

        9.3.3. Europe

        9.3.4. East Asia

        9.3.5. South Asia & Pacific

        9.3.6. MEA

    9.4. Market Attractiveness Analysis By Region

10. North America Neuro-monitoring System Market Analysis 2017-2021 and Forecast 2022-2032, By Country

    10.1. Historical Market Size Value (US$ Mn) & Volume (Units) Trend Analysis By Market Taxonomy, 2017-2021

    10.2. Market Size Value (US$ Mn) & Volume (Units) Forecast By Market Taxonomy, 2022-2032

        10.2.1. By Country

            10.2.1.1. U.S.

            10.2.1.2. Canada

        10.2.2. By Product Type

        10.2.3. By Application

        10.2.4. By Technology

        10.2.5. By End Users

    10.3. Market Attractiveness Analysis

        10.3.1. By Country

        10.3.2. By Product Type

        10.3.3. By Application

        10.3.4. By Technology

        10.3.5. By End Users

    10.4. Key Takeaways

11. Latin America Neuro-monitoring System Market Analysis 2017-2021 and Forecast 2022-2032, By Country

    11.1. Historical Market Size Value (US$ Mn) & Volume (Units) Trend Analysis By Market Taxonomy, 2017-2021

    11.2. Market Size Value (US$ Mn) & Volume (Units) Forecast By Market Taxonomy, 2022-2032

        11.2.1. By Country

            11.2.1.1. Brazil

            11.2.1.2. Mexico

            11.2.1.3. Rest of Latin America

        11.2.2. By Product Type

        11.2.3. By Application

        11.2.4. By Technology

        11.2.5. By End Users

    11.3. Market Attractiveness Analysis

        11.3.1. By Country

        11.3.2. By Product Type

        11.3.3. By Application

        11.3.4. By Technology

        11.3.5. By End Users

    11.4. Key Takeaways

12. Europe Neuro-monitoring System Market Analysis 2017-2021 and Forecast 2022-2032, By Country

    12.1. Historical Market Size Value (US$ Mn) & Volume (Units) Trend Analysis By Market Taxonomy, 2017-2021

    12.2. Market Size Value (US$ Mn) & Volume (Units) Forecast By Market Taxonomy, 2022-2032

        12.2.1. By Country

            12.2.1.1. Germany

            12.2.1.2. U.K.

            12.2.1.3. France

            12.2.1.4. Spain

            12.2.1.5. Italy

            12.2.1.6. Rest of Europe

        12.2.2. By Product Type

        12.2.3. By Application

        12.2.4. By Technology

        12.2.5. By End Users

    12.3. Market Attractiveness Analysis

        12.3.1. By Country

        12.3.2. By Product Type

        12.3.3. By Application

        12.3.4. By Technology

        12.3.5. By End Users

    12.4. Key Takeaways

13. East Asia Neuro-monitoring System Market Analysis 2017-2021 and Forecast 2022-2032, By Country

    13.1. Historical Market Size Value (US$ Mn) & Volume (Units) Trend Analysis By Market Taxonomy, 2017-2021

    13.2. Market Size Value (US$ Mn) & Volume (Units) Forecast By Market Taxonomy, 2022-2032

        13.2.1. By Country

            13.2.1.1. China

            13.2.1.2. Japan

            13.2.1.3. South Korea

        13.2.2. By Product Type

        13.2.3. By Application

        13.2.4. By Technology

        13.2.5. By End Users

    13.3. Market Attractiveness Analysis

        13.3.1. By Country

        13.3.2. By Product Type

        13.3.3. By Application

        13.3.4. By Technology

        13.3.5. By End Users

    13.4. Key Takeaways

14. South Asia & Pacific Neuro-monitoring System Market Analysis 2017-2021 and Forecast 2022-2032, By Country

    14.1. Historical Market Size Value (US$ Mn) & Volume (Units) Trend Analysis By Market Taxonomy, 2017-2021

    14.2. Market Size Value (US$ Mn) & Volume (Units) Forecast By Market Taxonomy, 2022-2032

        14.2.1. By Country

            14.2.1.1. India

            14.2.1.2. Thailand

            14.2.1.3. Indonesia

            14.2.1.4. Malaysia

            14.2.1.5. Singapore

            14.2.1.6. Australia

            14.2.1.7. New Zealand

            14.2.1.8. Rest of South Asia & Pacific

        14.2.2. By Product Type

        14.2.3. By Application

        14.2.4. By Technology

        14.2.5. By End Users

    14.3. Market Attractiveness Analysis

        14.3.1. By Country

        14.3.2. By Product Type

        14.3.3. By Application

        14.3.4. By Technology

        14.3.5. By End Users

    14.4. Key Takeaways

15. MEA Neuro-monitoring System Market Analysis 2017-2021 and Forecast 2022-2032, By Country

    15.1. Historical Market Size Value (US$ Mn) & Volume (Units) Trend Analysis By Market Taxonomy, 2017-2021

    15.2. Market Size Value (US$ Mn) & Volume (Units) Forecast By Market Taxonomy, 2022-2032

        15.2.1. By Country

            15.2.1.1. GCC Countries

            15.2.1.2. South Africa

            15.2.1.3. Israel

            15.2.1.4. Rest of MEA

        15.2.2. By Product Type

        15.2.3. By Application

        15.2.4. By Technology

        15.2.5. By End Users

    15.3. Market Attractiveness Analysis

        15.3.1. By Country

        15.3.2. By Product Type

        15.3.3. By Application

        15.3.4. By Technology

        15.3.5. By End Users

    15.4. Key Takeaways

16. Key Countries Neuro-monitoring System Market Analysis

    16.1. U.S.

        16.1.1. Pricing Analysis

        16.1.2. Market Share Analysis, 2021

            16.1.2.1. By Product Type

            16.1.2.2. By Application

            16.1.2.3. By Technology

            16.1.2.4. By End Users

    16.2. Canada

        16.2.1. Pricing Analysis

        16.2.2. Market Share Analysis, 2021

            16.2.2.1. By Product Type

            16.2.2.2. By Application

            16.2.2.3. By Technology

            16.2.2.4. By End Users

    16.3. Brazil

        16.3.1. Pricing Analysis

        16.3.2. Market Share Analysis, 2021

            16.3.2.1. By Product Type

            16.3.2.2. By Application

            16.3.2.3. By Technology

            16.3.2.4. By End Users

    16.4. Mexico

        16.4.1. Pricing Analysis

        16.4.2. Market Share Analysis, 2021

            16.4.2.1. By Product Type

            16.4.2.2. By Application

            16.4.2.3. By Technology

            16.4.2.4. By End Users

    16.5. Germany

        16.5.1. Pricing Analysis

        16.5.2. Market Share Analysis, 2021

            16.5.2.1. By Product Type

            16.5.2.2. By Application

            16.5.2.3. By Technology

            16.5.2.4. By End Users

    16.6. U.K.

        16.6.1. Pricing Analysis

        16.6.2. Market Share Analysis, 2021

            16.6.2.1. By Product Type

            16.6.2.2. By Application

            16.6.2.3. By Technology

            16.6.2.4. By End Users

    16.7. France

        16.7.1. Pricing Analysis

        16.7.2. Market Share Analysis, 2021

            16.7.2.1. By Product Type

            16.7.2.2. By Application

            16.7.2.3. By Technology

            16.7.2.4. By End Users

    16.8. Spain

        16.8.1. Pricing Analysis

        16.8.2. Market Share Analysis, 2021

            16.8.2.1. By Product Type

            16.8.2.2. By Application

            16.8.2.3. By Technology

            16.8.2.4. By End Users

    16.9. Italy

        16.9.1. Pricing Analysis

        16.9.2. Market Share Analysis, 2021

            16.9.2.1. By Product Type

            16.9.2.2. By Application

            16.9.2.3. By Technology

            16.9.2.4. By End Users

    16.10. China

        16.10.1. Pricing Analysis

        16.10.2. Market Share Analysis, 2021

            16.10.2.1. By Product Type

            16.10.2.2. By Application

            16.10.2.3. By Technology

            16.10.2.4. By End Users

    16.11. Japan

        16.11.1. Pricing Analysis

        16.11.2. Market Share Analysis, 2021

            16.11.2.1. By Product Type

            16.11.2.2. By Application

            16.11.2.3. By Technology

            16.11.2.4. By End Users

    16.12. South Korea

        16.12.1. Pricing Analysis

        16.12.2. Market Share Analysis, 2021

            16.12.2.1. By Product Type

            16.12.2.2. By Application

            16.12.2.3. By Technology

            16.12.2.4. By End Users

    16.13. India

        16.13.1. Pricing Analysis

        16.13.2. Market Share Analysis, 2021

            16.13.2.1. By Product Type

            16.13.2.2. By Application

            16.13.2.3. By Technology

            16.13.2.4. By End Users

    16.14. Thailand

        16.14.1. Pricing Analysis

        16.14.2. Market Share Analysis, 2021

            16.14.2.1. By Product Type

            16.14.2.2. By Application

            16.14.2.3. By Technology

            16.14.2.4. By End Users

    16.15. Indonesia

        16.15.1. Pricing Analysis

        16.15.2. Market Share Analysis, 2021

            16.15.2.1. By Product Type

            16.15.2.2. By Application

            16.15.2.3. By Technology

            16.15.2.4. By End Users

    16.16. Malaysia

        16.16.1. Pricing Analysis

        16.16.2. Market Share Analysis, 2021

            16.16.2.1. By Product Type

            16.16.2.2. By Application

            16.16.2.3. By Technology

            16.16.2.4. By End Users

    16.17. Singapore

        16.17.1. Pricing Analysis

        16.17.2. Market Share Analysis, 2021

            16.17.2.1. By Product Type

            16.17.2.2. By Application

            16.17.2.3. By Technology

            16.17.2.4. By End Users

    16.18. Australia

        16.18.1. Pricing Analysis

        16.18.2. Market Share Analysis, 2021

            16.18.2.1. By Product Type

            16.18.2.2. By Application

            16.18.2.3. By Technology

            16.18.2.4. By End Users

    16.19. New Zealand

        16.19.1. Pricing Analysis

        16.19.2. Market Share Analysis, 2021

            16.19.2.1. By Product Type

            16.19.2.2. By Application

            16.19.2.3. By Technology

            16.19.2.4. By End Users

    16.20. GCC Countries

        16.20.1. Pricing Analysis

        16.20.2. Market Share Analysis, 2021

            16.20.2.1. By Product Type

            16.20.2.2. By Application

            16.20.2.3. By Technology

            16.20.2.4. By End Users

    16.21. South Africa

        16.21.1. Pricing Analysis

        16.21.2. Market Share Analysis, 2021

            16.21.2.1. By Product Type

            16.21.2.2. By Application

            16.21.2.3. By Technology

            16.21.2.4. By End Users

    16.22. Israel

        16.22.1. Pricing Analysis

        16.22.2. Market Share Analysis, 2021

            16.22.2.1. By Product Type

            16.22.2.2. By Application

            16.22.2.3. By Technology

            16.22.2.4. By End Users

17. Market Structure Analysis

    17.1. Competition Dashboard

    17.2. Competition Benchmarking

    17.3. Market Share Analysis of Top Players

        17.3.1. By Regional

        17.3.2. By Product Type

        17.3.3. By Application

        17.3.4. By Technology

        17.3.5. By End Users

18. Competition Analysis

    18.1. Competition Deep Dive

        18.1.1. Neurosoft

            18.1.1.1. Overview

            18.1.1.2. Product Portfolio

            18.1.1.3. Profitability by Market Segments

            18.1.1.4. Sales Footprint

            18.1.1.5. Strategy Overview

                18.1.1.5.1. Marketing Strategy

                18.1.1.5.2. Product Strategy

                18.1.1.5.3. Channel Strategy

        18.1.2. Cadwell Industries

            18.1.2.1. Overview

            18.1.2.2. Product Portfolio

            18.1.2.3. Profitability by Market Segments

            18.1.2.4. Sales Footprint

            18.1.2.5. Strategy Overview

                18.1.2.5.1. Marketing Strategy

                18.1.2.5.2. Product Strategy

                18.1.2.5.3. Channel Strategy

        18.1.3. Dr. Langer Medical

            18.1.3.1. Overview

            18.1.3.2. Product Portfolio

            18.1.3.3. Profitability by Market Segments

            18.1.3.4. Sales Footprint

            18.1.3.5. Strategy Overview

                18.1.3.5.1. Marketing Strategy

                18.1.3.5.2. Product Strategy

                18.1.3.5.3. Channel Strategy

        18.1.4. Medizintechnik

            18.1.4.1. Overview

            18.1.4.2. Product Portfolio

            18.1.4.3. Profitability by Market Segments

            18.1.4.4. Sales Footprint

            18.1.4.5. Strategy Overview

                18.1.4.5.1. Marketing Strategy

                18.1.4.5.2. Product Strategy

                18.1.4.5.3. Channel Strategy

        18.1.5. Mdoloris Medical Systems

            18.1.5.1. Overview

            18.1.5.2. Product Portfolio

            18.1.5.3. Profitability by Market Segments

            18.1.5.4. Sales Footprint

            18.1.5.5. Strategy Overview

                18.1.5.5.1. Marketing Strategy

                18.1.5.5.2. Product Strategy

                18.1.5.5.3. Channel Strategy

        18.1.6. Neurosign

            18.1.6.1. Overview

            18.1.6.2. Product Portfolio

            18.1.6.3. Profitability by Market Segments

            18.1.6.4. Sales Footprint

            18.1.6.5. Strategy Overview

                18.1.6.5.1. Marketing Strategy

                18.1.6.5.2. Product Strategy

                18.1.6.5.3. Channel Strategy

        18.1.7. Neurosoft

            18.1.7.1. Overview

            18.1.7.2. Product Portfolio

            18.1.7.3. Profitability by Market Segments

            18.1.7.4. Sales Footprint

            18.1.7.5. Strategy Overview

                18.1.7.5.1. Marketing Strategy

                18.1.7.5.2. Product Strategy

                18.1.7.5.3. Channel Strategy

        18.1.8. Nihon Kohden Corporation

            18.1.8.1. Overview

            18.1.8.2. Product Portfolio

            18.1.8.3. Profitability by Market Segments

            18.1.8.4. Sales Footprint

            18.1.8.5. Strategy Overview

                18.1.8.5.1. Marketing Strategy

                18.1.8.5.2. Product Strategy

                18.1.8.5.3. Channel Strategy

        18.1.9. Recorders & Medicare Systems P Ltd.

            18.1.9.1. Overview

            18.1.9.2. Product Portfolio

            18.1.9.3. Profitability by Market Segments

            18.1.9.4. Sales Footprint

            18.1.9.5. Strategy Overview

                18.1.9.5.1. Marketing Strategy

                18.1.9.5.2. Product Strategy

                18.1.9.5.3. Channel Strategy

        18.1.10. Medicaid Systems

            18.1.10.1. Overview

            18.1.10.2. Product Portfolio

            18.1.10.3. Profitability by Market Segments

            18.1.10.4. Sales Footprint

            18.1.10.5. Strategy Overview

                18.1.10.5.1. Marketing Strategy

                18.1.10.5.2. Product Strategy

                18.1.10.5.3. Channel Strategy

        18.1.11. EB Neuro S.p.A.

            18.1.11.1. Overview

            18.1.11.2. Product Portfolio

            18.1.11.3. Profitability by Market Segments

            18.1.11.4. Sales Footprint

            18.1.11.5. Strategy Overview

                18.1.11.5.1. Marketing Strategy

                18.1.11.5.2. Product Strategy

                18.1.11.5.3. Channel Strategy

        18.1.12. Natus Medical Incorporated

            18.1.12.1. Overview

            18.1.12.2. Product Portfolio

            18.1.12.3. Profitability by Market Segments

            18.1.12.4. Sales Footprint

            18.1.12.5. Strategy Overview

                18.1.12.5.1. Marketing Strategy

                18.1.12.5.2. Product Strategy

                18.1.12.5.3. Channel Strategy

        18.1.13. Medtronic

            18.1.13.1. Overview

            18.1.13.2. Product Portfolio

            18.1.13.3. Profitability by Market Segments

            18.1.13.4. Sales Footprint

            18.1.13.5. Strategy Overview

                18.1.13.5.1. Marketing Strategy

                18.1.13.5.2. Product Strategy

                18.1.13.5.3. Channel Strategy

        18.1.14. NuVasive

            18.1.14.1. Overview

            18.1.14.2. Product Portfolio

            18.1.14.3. Profitability by Market Segments

            18.1.14.4. Sales Footprint

            18.1.14.5. Strategy Overview

                18.1.14.5.1. Marketing Strategy

                18.1.14.5.2. Product Strategy

                18.1.14.5.3. Channel Strategy

19. Assumptions & Acronyms Used

20. Research Methodology

Don't pay for what you don't need

Customize your report by selecting specific countries or regions and save 30%!

List of Tables

Table 1: Global Neuro-monitoring System Market Value (US$ Mn) Forecast by Region, 2017-2032

Table 2: Global Neuro-monitoring System Market Volume (Units) Forecast by Region, 2017-2032

Table 3: Global Neuro-monitoring System Market Value (US$ Mn) Forecast by Product Type, 2017-2032

Table 4: Global Neuro-monitoring System Market Volume (Units) Forecast by Product Type, 2017-2032

Table 5: Global Neuro-monitoring System Market Value (US$ Mn) Forecast by Application, 2017-2032

Table 6: Global Neuro-monitoring System Market Volume (Units) Forecast by Application, 2017-2032

Table 7: Global Neuro-monitoring System Market Value (US$ Mn) Forecast by Technology, 2017-2032

Table 8: Global Neuro-monitoring System Market Volume (Units) Forecast by Technology, 2017-2032

Table 9: Global Neuro-monitoring System Market Value (US$ Mn) Forecast by End Users, 2017-2032

Table 10: Global Neuro-monitoring System Market Volume (Units) Forecast by End Users, 2017-2032

Table 11: North America Neuro-monitoring System Market Value (US$ Mn) Forecast by Country, 2017-2032

Table 12: North America Neuro-monitoring System Market Volume (Units) Forecast by Country, 2017-2032

Table 13: North America Neuro-monitoring System Market Value (US$ Mn) Forecast by Product Type, 2017-2032

Table 14: North America Neuro-monitoring System Market Volume (Units) Forecast by Product Type, 2017-2032

Table 15: North America Neuro-monitoring System Market Value (US$ Mn) Forecast by Application, 2017-2032

Table 16: North America Neuro-monitoring System Market Volume (Units) Forecast by Application, 2017-2032

Table 17: North America Neuro-monitoring System Market Value (US$ Mn) Forecast by Technology, 2017-2032

Table 18: North America Neuro-monitoring System Market Volume (Units) Forecast by Technology, 2017-2032

Table 19: North America Neuro-monitoring System Market Value (US$ Mn) Forecast by End Users, 2017-2032

Table 20: North America Neuro-monitoring System Market Volume (Units) Forecast by End Users, 2017-2032

Table 21: Latin America Neuro-monitoring System Market Value (US$ Mn) Forecast by Country, 2017-2032

Table 22: Latin America Neuro-monitoring System Market Volume (Units) Forecast by Country, 2017-2032

Table 23: Latin America Neuro-monitoring System Market Value (US$ Mn) Forecast by Product Type, 2017-2032

Table 24: Latin America Neuro-monitoring System Market Volume (Units) Forecast by Product Type, 2017-2032

Table 25: Latin America Neuro-monitoring System Market Value (US$ Mn) Forecast by Application, 2017-2032

Table 26: Latin America Neuro-monitoring System Market Volume (Units) Forecast by Application, 2017-2032

Table 27: Latin America Neuro-monitoring System Market Value (US$ Mn) Forecast by Technology, 2017-2032

Table 28: Latin America Neuro-monitoring System Market Volume (Units) Forecast by Technology, 2017-2032

Table 29: Latin America Neuro-monitoring System Market Value (US$ Mn) Forecast by End Users, 2017-2032

Table 30: Latin America Neuro-monitoring System Market Volume (Units) Forecast by End Users, 2017-2032

Table 31: Europe Neuro-monitoring System Market Value (US$ Mn) Forecast by Country, 2017-2032

Table 32: Europe Neuro-monitoring System Market Volume (Units) Forecast by Country, 2017-2032

Table 33: Europe Neuro-monitoring System Market Value (US$ Mn) Forecast by Product Type, 2017-2032

Table 34: Europe Neuro-monitoring System Market Volume (Units) Forecast by Product Type, 2017-2032

Table 35: Europe Neuro-monitoring System Market Value (US$ Mn) Forecast by Application, 2017-2032

Table 36: Europe Neuro-monitoring System Market Volume (Units) Forecast by Application, 2017-2032

Table 37: Europe Neuro-monitoring System Market Value (US$ Mn) Forecast by Technology, 2017-2032

Table 38: Europe Neuro-monitoring System Market Volume (Units) Forecast by Technology, 2017-2032

Table 39: Europe Neuro-monitoring System Market Value (US$ Mn) Forecast by End Users, 2017-2032

Table 40: Europe Neuro-monitoring System Market Volume (Units) Forecast by End Users, 2017-2032

Table 41: East Asia Neuro-monitoring System Market Value (US$ Mn) Forecast by Country, 2017-2032

Table 42: East Asia Neuro-monitoring System Market Volume (Units) Forecast by Country, 2017-2032

Table 43: East Asia Neuro-monitoring System Market Value (US$ Mn) Forecast by Product Type, 2017-2032

Table 44: East Asia Neuro-monitoring System Market Volume (Units) Forecast by Product Type, 2017-2032

Table 45: East Asia Neuro-monitoring System Market Value (US$ Mn) Forecast by Application, 2017-2032

Table 46: East Asia Neuro-monitoring System Market Volume (Units) Forecast by Application, 2017-2032

Table 47: East Asia Neuro-monitoring System Market Value (US$ Mn) Forecast by Technology, 2017-2032

Table 48: East Asia Neuro-monitoring System Market Volume (Units) Forecast by Technology, 2017-2032

Table 49: East Asia Neuro-monitoring System Market Value (US$ Mn) Forecast by End Users, 2017-2032

Table 50: East Asia Neuro-monitoring System Market Volume (Units) Forecast by End Users, 2017-2032

Table 51: South Asia & Pacific Neuro-monitoring System Market Value (US$ Mn) Forecast by Country, 2017-2032

Table 52: South Asia & Pacific Neuro-monitoring System Market Volume (Units) Forecast by Country, 2017-2032

Table 53: South Asia & Pacific Neuro-monitoring System Market Value (US$ Mn) Forecast by Product Type, 2017-2032

Table 54: South Asia & Pacific Neuro-monitoring System Market Volume (Units) Forecast by Product Type, 2017-2032

Table 55: South Asia & Pacific Neuro-monitoring System Market Value (US$ Mn) Forecast by Application, 2017-2032

Table 56: South Asia & Pacific Neuro-monitoring System Market Volume (Units) Forecast by Application, 2017-2032

Table 57: South Asia & Pacific Neuro-monitoring System Market Value (US$ Mn) Forecast by Technology, 2017-2032

Table 58: South Asia & Pacific Neuro-monitoring System Market Volume (Units) Forecast by Technology, 2017-2032

Table 59: South Asia & Pacific Neuro-monitoring System Market Value (US$ Mn) Forecast by End Users, 2017-2032

Table 60: South Asia & Pacific Neuro-monitoring System Market Volume (Units) Forecast by End Users, 2017-2032

Table 61: MEA Neuro-monitoring System Market Value (US$ Mn) Forecast by Country, 2017-2032

Table 62: MEA Neuro-monitoring System Market Volume (Units) Forecast by Country, 2017-2032

Table 63: MEA Neuro-monitoring System Market Value (US$ Mn) Forecast by Product Type, 2017-2032

Table 64: MEA Neuro-monitoring System Market Volume (Units) Forecast by Product Type, 2017-2032

Table 65: MEA Neuro-monitoring System Market Value (US$ Mn) Forecast by Application, 2017-2032

Table 66: MEA Neuro-monitoring System Market Volume (Units) Forecast by Application, 2017-2032

Table 67: MEA Neuro-monitoring System Market Value (US$ Mn) Forecast by Technology, 2017-2032

Table 68: MEA Neuro-monitoring System Market Volume (Units) Forecast by Technology, 2017-2032

Table 69: MEA Neuro-monitoring System Market Value (US$ Mn) Forecast by End Users, 2017-2032

Table 70: MEA Neuro-monitoring System Market Volume (Units) Forecast by End Users, 2017-2032
Sabyasachi Ghosh
Sabyasachi Ghosh

Principal Consultant

Talk to Analyst

Find your sweet spots for generating winning opportunities in this market.

List of Charts

Figure 1: Global Neuro-monitoring System Market Value (US$ Mn) by Product Type, 2022-2032

Figure 2: Global Neuro-monitoring System Market Value (US$ Mn) by Application, 2022-2032

Figure 3: Global Neuro-monitoring System Market Value (US$ Mn) by Technology, 2022-2032

Figure 4: Global Neuro-monitoring System Market Value (US$ Mn) by End Users, 2022-2032

Figure 5: Global Neuro-monitoring System Market Value (US$ Mn) by Region, 2022-2032

Figure 6: Global Neuro-monitoring System Market Value (US$ Mn) Analysis by Region, 2017-2032

Figure 7: Global Neuro-monitoring System Market Volume (Units) Analysis by Region, 2017-2032

Figure 8: Global Neuro-monitoring System Market Value Share (%) and BPS Analysis by Region, 2022-2032

Figure 9: Global Neuro-monitoring System Market Y-o-Y Growth (%) Projections by Region, 2022-2032

Figure 10: Global Neuro-monitoring System Market Value (US$ Mn) Analysis by Product Type, 2017-2032

Figure 11: Global Neuro-monitoring System Market Volume (Units) Analysis by Product Type, 2017-2032

Figure 12: Global Neuro-monitoring System Market Value Share (%) and BPS Analysis by Product Type, 2022-2032

Figure 13: Global Neuro-monitoring System Market Y-o-Y Growth (%) Projections by Product Type, 2022-2032

Figure 14: Global Neuro-monitoring System Market Value (US$ Mn) Analysis by Application, 2017-2032

Figure 15: Global Neuro-monitoring System Market Volume (Units) Analysis by Application, 2017-2032

Figure 16: Global Neuro-monitoring System Market Value Share (%) and BPS Analysis by Application, 2022-2032

Figure 17: Global Neuro-monitoring System Market Y-o-Y Growth (%) Projections by Application, 2022-2032

Figure 18: Global Neuro-monitoring System Market Value (US$ Mn) Analysis by Technology, 2017-2032

Figure 19: Global Neuro-monitoring System Market Volume (Units) Analysis by Technology, 2017-2032

Figure 20: Global Neuro-monitoring System Market Value Share (%) and BPS Analysis by Technology, 2022-2032

Figure 21: Global Neuro-monitoring System Market Y-o-Y Growth (%) Projections by Technology, 2022-2032

Figure 22: Global Neuro-monitoring System Market Value (US$ Mn) Analysis by End Users, 2017-2032

Figure 23: Global Neuro-monitoring System Market Volume (Units) Analysis by End Users, 2017-2032

Figure 24: Global Neuro-monitoring System Market Value Share (%) and BPS Analysis by End Users, 2022-2032

Figure 25: Global Neuro-monitoring System Market Y-o-Y Growth (%) Projections by End Users, 2022-2032

Figure 26: Global Neuro-monitoring System Market Attractiveness by Product Type, 2022-2032

Figure 27: Global Neuro-monitoring System Market Attractiveness by Application, 2022-2032

Figure 28: Global Neuro-monitoring System Market Attractiveness by Technology, 2022-2032

Figure 29: Global Neuro-monitoring System Market Attractiveness by End Users, 2022-2032

Figure 30: Global Neuro-monitoring System Market Attractiveness by Region, 2022-2032

Figure 31: North America Neuro-monitoring System Market Value (US$ Mn) by Product Type, 2022-2032

Figure 32: North America Neuro-monitoring System Market Value (US$ Mn) by Application, 2022-2032

Figure 33: North America Neuro-monitoring System Market Value (US$ Mn) by Technology, 2022-2032

Figure 34: North America Neuro-monitoring System Market Value (US$ Mn) by End Users, 2022-2032

Figure 35: North America Neuro-monitoring System Market Value (US$ Mn) by Country, 2022-2032

Figure 36: North America Neuro-monitoring System Market Value (US$ Mn) Analysis by Country, 2017-2032

Figure 37: North America Neuro-monitoring System Market Volume (Units) Analysis by Country, 2017-2032

Figure 38: North America Neuro-monitoring System Market Value Share (%) and BPS Analysis by Country, 2022-2032

Figure 39: North America Neuro-monitoring System Market Y-o-Y Growth (%) Projections by Country, 2022-2032

Figure 40: North America Neuro-monitoring System Market Value (US$ Mn) Analysis by Product Type, 2017-2032

Figure 41: North America Neuro-monitoring System Market Volume (Units) Analysis by Product Type, 2017-2032

Figure 42: North America Neuro-monitoring System Market Value Share (%) and BPS Analysis by Product Type, 2022-2032

Figure 43: North America Neuro-monitoring System Market Y-o-Y Growth (%) Projections by Product Type, 2022-2032

Figure 44: North America Neuro-monitoring System Market Value (US$ Mn) Analysis by Application, 2017-2032

Figure 45: North America Neuro-monitoring System Market Volume (Units) Analysis by Application, 2017-2032

Figure 46: North America Neuro-monitoring System Market Value Share (%) and BPS Analysis by Application, 2022-2032

Figure 47: North America Neuro-monitoring System Market Y-o-Y Growth (%) Projections by Application, 2022-2032

Figure 48: North America Neuro-monitoring System Market Value (US$ Mn) Analysis by Technology, 2017-2032

Figure 49: North America Neuro-monitoring System Market Volume (Units) Analysis by Technology, 2017-2032

Figure 50: North America Neuro-monitoring System Market Value Share (%) and BPS Analysis by Technology, 2022-2032

Figure 51: North America Neuro-monitoring System Market Y-o-Y Growth (%) Projections by Technology, 2022-2032

Figure 52: North America Neuro-monitoring System Market Value (US$ Mn) Analysis by End Users, 2017-2032

Figure 53: North America Neuro-monitoring System Market Volume (Units) Analysis by End Users, 2017-2032

Figure 54: North America Neuro-monitoring System Market Value Share (%) and BPS Analysis by End Users, 2022-2032

Figure 55: North America Neuro-monitoring System Market Y-o-Y Growth (%) Projections by End Users, 2022-2032

Figure 56: North America Neuro-monitoring System Market Attractiveness by Product Type, 2022-2032

Figure 57: North America Neuro-monitoring System Market Attractiveness by Application, 2022-2032

Figure 58: North America Neuro-monitoring System Market Attractiveness by Technology, 2022-2032

Figure 59: North America Neuro-monitoring System Market Attractiveness by End Users, 2022-2032

Figure 60: North America Neuro-monitoring System Market Attractiveness by Country, 2022-2032

Figure 61: Latin America Neuro-monitoring System Market Value (US$ Mn) by Product Type, 2022-2032

Figure 62: Latin America Neuro-monitoring System Market Value (US$ Mn) by Application, 2022-2032

Figure 63: Latin America Neuro-monitoring System Market Value (US$ Mn) by Technology, 2022-2032

Figure 64: Latin America Neuro-monitoring System Market Value (US$ Mn) by End Users, 2022-2032

Figure 65: Latin America Neuro-monitoring System Market Value (US$ Mn) by Country, 2022-2032

Figure 66: Latin America Neuro-monitoring System Market Value (US$ Mn) Analysis by Country, 2017-2032

Figure 67: Latin America Neuro-monitoring System Market Volume (Units) Analysis by Country, 2017-2032

Figure 68: Latin America Neuro-monitoring System Market Value Share (%) and BPS Analysis by Country, 2022-2032

Figure 69: Latin America Neuro-monitoring System Market Y-o-Y Growth (%) Projections by Country, 2022-2032

Figure 70: Latin America Neuro-monitoring System Market Value (US$ Mn) Analysis by Product Type, 2017-2032

Figure 71: Latin America Neuro-monitoring System Market Volume (Units) Analysis by Product Type, 2017-2032

Figure 72: Latin America Neuro-monitoring System Market Value Share (%) and BPS Analysis by Product Type, 2022-2032

Figure 73: Latin America Neuro-monitoring System Market Y-o-Y Growth (%) Projections by Product Type, 2022-2032

Figure 74: Latin America Neuro-monitoring System Market Value (US$ Mn) Analysis by Application, 2017-2032

Figure 75: Latin America Neuro-monitoring System Market Volume (Units) Analysis by Application, 2017-2032

Figure 76: Latin America Neuro-monitoring System Market Value Share (%) and BPS Analysis by Application, 2022-2032

Figure 77: Latin America Neuro-monitoring System Market Y-o-Y Growth (%) Projections by Application, 2022-2032

Figure 78: Latin America Neuro-monitoring System Market Value (US$ Mn) Analysis by Technology, 2017-2032

Figure 79: Latin America Neuro-monitoring System Market Volume (Units) Analysis by Technology, 2017-2032

Figure 80: Latin America Neuro-monitoring System Market Value Share (%) and BPS Analysis by Technology, 2022-2032

Figure 81: Latin America Neuro-monitoring System Market Y-o-Y Growth (%) Projections by Technology, 2022-2032

Figure 82: Latin America Neuro-monitoring System Market Value (US$ Mn) Analysis by End Users, 2017-2032

Figure 83: Latin America Neuro-monitoring System Market Volume (Units) Analysis by End Users, 2017-2032

Figure 84: Latin America Neuro-monitoring System Market Value Share (%) and BPS Analysis by End Users, 2022-2032

Figure 85: Latin America Neuro-monitoring System Market Y-o-Y Growth (%) Projections by End Users, 2022-2032

Figure 86: Latin America Neuro-monitoring System Market Attractiveness by Product Type, 2022-2032

Figure 87: Latin America Neuro-monitoring System Market Attractiveness by Application, 2022-2032

Figure 88: Latin America Neuro-monitoring System Market Attractiveness by Technology, 2022-2032

Figure 89: Latin America Neuro-monitoring System Market Attractiveness by End Users, 2022-2032

Figure 90: Latin America Neuro-monitoring System Market Attractiveness by Country, 2022-2032

Figure 91: Europe Neuro-monitoring System Market Value (US$ Mn) by Product Type, 2022-2032

Figure 92: Europe Neuro-monitoring System Market Value (US$ Mn) by Application, 2022-2032

Figure 93: Europe Neuro-monitoring System Market Value (US$ Mn) by Technology, 2022-2032

Figure 94: Europe Neuro-monitoring System Market Value (US$ Mn) by End Users, 2022-2032

Figure 95: Europe Neuro-monitoring System Market Value (US$ Mn) by Country, 2022-2032

Figure 96: Europe Neuro-monitoring System Market Value (US$ Mn) Analysis by Country, 2017-2032

Figure 97: Europe Neuro-monitoring System Market Volume (Units) Analysis by Country, 2017-2032

Figure 98: Europe Neuro-monitoring System Market Value Share (%) and BPS Analysis by Country, 2022-2032

Figure 99: Europe Neuro-monitoring System Market Y-o-Y Growth (%) Projections by Country, 2022-2032

Figure 100: Europe Neuro-monitoring System Market Value (US$ Mn) Analysis by Product Type, 2017-2032

Figure 101: Europe Neuro-monitoring System Market Volume (Units) Analysis by Product Type, 2017-2032

Figure 102: Europe Neuro-monitoring System Market Value Share (%) and BPS Analysis by Product Type, 2022-2032

Figure 103: Europe Neuro-monitoring System Market Y-o-Y Growth (%) Projections by Product Type, 2022-2032

Figure 104: Europe Neuro-monitoring System Market Value (US$ Mn) Analysis by Application, 2017-2032

Figure 105: Europe Neuro-monitoring System Market Volume (Units) Analysis by Application, 2017-2032

Figure 106: Europe Neuro-monitoring System Market Value Share (%) and BPS Analysis by Application, 2022-2032

Figure 107: Europe Neuro-monitoring System Market Y-o-Y Growth (%) Projections by Application, 2022-2032

Figure 108: Europe Neuro-monitoring System Market Value (US$ Mn) Analysis by Technology, 2017-2032

Figure 109: Europe Neuro-monitoring System Market Volume (Units) Analysis by Technology, 2017-2032

Figure 110: Europe Neuro-monitoring System Market Value Share (%) and BPS Analysis by Technology, 2022-2032

Figure 111: Europe Neuro-monitoring System Market Y-o-Y Growth (%) Projections by Technology, 2022-2032

Figure 112: Europe Neuro-monitoring System Market Value (US$ Mn) Analysis by End Users, 2017-2032

Figure 113: Europe Neuro-monitoring System Market Volume (Units) Analysis by End Users, 2017-2032

Figure 114: Europe Neuro-monitoring System Market Value Share (%) and BPS Analysis by End Users, 2022-2032

Figure 115: Europe Neuro-monitoring System Market Y-o-Y Growth (%) Projections by End Users, 2022-2032

Figure 116: Europe Neuro-monitoring System Market Attractiveness by Product Type, 2022-2032

Figure 117: Europe Neuro-monitoring System Market Attractiveness by Application, 2022-2032

Figure 118: Europe Neuro-monitoring System Market Attractiveness by Technology, 2022-2032

Figure 119: Europe Neuro-monitoring System Market Attractiveness by End Users, 2022-2032

Figure 120: Europe Neuro-monitoring System Market Attractiveness by Country, 2022-2032

Figure 121: East Asia Neuro-monitoring System Market Value (US$ Mn) by Product Type, 2022-2032

Figure 122: East Asia Neuro-monitoring System Market Value (US$ Mn) by Application, 2022-2032

Figure 123: East Asia Neuro-monitoring System Market Value (US$ Mn) by Technology, 2022-2032

Figure 124: East Asia Neuro-monitoring System Market Value (US$ Mn) by End Users, 2022-2032

Figure 125: East Asia Neuro-monitoring System Market Value (US$ Mn) by Country, 2022-2032

Figure 126: East Asia Neuro-monitoring System Market Value (US$ Mn) Analysis by Country, 2017-2032

Figure 127: East Asia Neuro-monitoring System Market Volume (Units) Analysis by Country, 2017-2032

Figure 128: East Asia Neuro-monitoring System Market Value Share (%) and BPS Analysis by Country, 2022-2032

Figure 129: East Asia Neuro-monitoring System Market Y-o-Y Growth (%) Projections by Country, 2022-2032

Figure 130: East Asia Neuro-monitoring System Market Value (US$ Mn) Analysis by Product Type, 2017-2032

Figure 131: East Asia Neuro-monitoring System Market Volume (Units) Analysis by Product Type, 2017-2032

Figure 132: East Asia Neuro-monitoring System Market Value Share (%) and BPS Analysis by Product Type, 2022-2032

Figure 133: East Asia Neuro-monitoring System Market Y-o-Y Growth (%) Projections by Product Type, 2022-2032

Figure 134: East Asia Neuro-monitoring System Market Value (US$ Mn) Analysis by Application, 2017-2032

Figure 135: East Asia Neuro-monitoring System Market Volume (Units) Analysis by Application, 2017-2032

Figure 136: East Asia Neuro-monitoring System Market Value Share (%) and BPS Analysis by Application, 2022-2032

Figure 137: East Asia Neuro-monitoring System Market Y-o-Y Growth (%) Projections by Application, 2022-2032

Figure 138: East Asia Neuro-monitoring System Market Value (US$ Mn) Analysis by Technology, 2017-2032

Figure 139: East Asia Neuro-monitoring System Market Volume (Units) Analysis by Technology, 2017-2032

Figure 140: East Asia Neuro-monitoring System Market Value Share (%) and BPS Analysis by Technology, 2022-2032

Figure 141: East Asia Neuro-monitoring System Market Y-o-Y Growth (%) Projections by Technology, 2022-2032

Figure 142: East Asia Neuro-monitoring System Market Value (US$ Mn) Analysis by End Users, 2017-2032

Figure 143: East Asia Neuro-monitoring System Market Volume (Units) Analysis by End Users, 2017-2032

Figure 144: East Asia Neuro-monitoring System Market Value Share (%) and BPS Analysis by End Users, 2022-2032

Figure 145: East Asia Neuro-monitoring System Market Y-o-Y Growth (%) Projections by End Users, 2022-2032

Figure 146: East Asia Neuro-monitoring System Market Attractiveness by Product Type, 2022-2032

Figure 147: East Asia Neuro-monitoring System Market Attractiveness by Application, 2022-2032

Figure 148: East Asia Neuro-monitoring System Market Attractiveness by Technology, 2022-2032

Figure 149: East Asia Neuro-monitoring System Market Attractiveness by End Users, 2022-2032

Figure 150: East Asia Neuro-monitoring System Market Attractiveness by Country, 2022-2032

Figure 151: South Asia & Pacific Neuro-monitoring System Market Value (US$ Mn) by Product Type, 2022-2032

Figure 152: South Asia & Pacific Neuro-monitoring System Market Value (US$ Mn) by Application, 2022-2032

Figure 153: South Asia & Pacific Neuro-monitoring System Market Value (US$ Mn) by Technology, 2022-2032

Figure 154: South Asia & Pacific Neuro-monitoring System Market Value (US$ Mn) by End Users, 2022-2032

Figure 155: South Asia & Pacific Neuro-monitoring System Market Value (US$ Mn) by Country, 2022-2032

Figure 156: South Asia & Pacific Neuro-monitoring System Market Value (US$ Mn) Analysis by Country, 2017-2032

Figure 157: South Asia & Pacific Neuro-monitoring System Market Volume (Units) Analysis by Country, 2017-2032

Figure 158: South Asia & Pacific Neuro-monitoring System Market Value Share (%) and BPS Analysis by Country, 2022-2032

Figure 159: South Asia & Pacific Neuro-monitoring System Market Y-o-Y Growth (%) Projections by Country, 2022-2032

Figure 160: South Asia & Pacific Neuro-monitoring System Market Value (US$ Mn) Analysis by Product Type, 2017-2032

Figure 161: South Asia & Pacific Neuro-monitoring System Market Volume (Units) Analysis by Product Type, 2017-2032

Figure 162: South Asia & Pacific Neuro-monitoring System Market Value Share (%) and BPS Analysis by Product Type, 2022-2032

Figure 163: South Asia & Pacific Neuro-monitoring System Market Y-o-Y Growth (%) Projections by Product Type, 2022-2032

Figure 164: South Asia & Pacific Neuro-monitoring System Market Value (US$ Mn) Analysis by Application, 2017-2032

Figure 165: South Asia & Pacific Neuro-monitoring System Market Volume (Units) Analysis by Application, 2017-2032

Figure 166: South Asia & Pacific Neuro-monitoring System Market Value Share (%) and BPS Analysis by Application, 2022-2032

Figure 167: South Asia & Pacific Neuro-monitoring System Market Y-o-Y Growth (%) Projections by Application, 2022-2032

Figure 168: South Asia & Pacific Neuro-monitoring System Market Value (US$ Mn) Analysis by Technology, 2017-2032

Figure 169: South Asia & Pacific Neuro-monitoring System Market Volume (Units) Analysis by Technology, 2017-2032

Figure 170: South Asia & Pacific Neuro-monitoring System Market Value Share (%) and BPS Analysis by Technology, 2022-2032

Figure 171: South Asia & Pacific Neuro-monitoring System Market Y-o-Y Growth (%) Projections by Technology, 2022-2032

Figure 172: South Asia & Pacific Neuro-monitoring System Market Value (US$ Mn) Analysis by End Users, 2017-2032

Figure 173: South Asia & Pacific Neuro-monitoring System Market Volume (Units) Analysis by End Users, 2017-2032

Figure 174: South Asia & Pacific Neuro-monitoring System Market Value Share (%) and BPS Analysis by End Users, 2022-2032

Figure 175: South Asia & Pacific Neuro-monitoring System Market Y-o-Y Growth (%) Projections by End Users, 2022-2032

Figure 176: South Asia & Pacific Neuro-monitoring System Market Attractiveness by Product Type, 2022-2032

Figure 177: South Asia & Pacific Neuro-monitoring System Market Attractiveness by Application, 2022-2032

Figure 178: South Asia & Pacific Neuro-monitoring System Market Attractiveness by Technology, 2022-2032

Figure 179: South Asia & Pacific Neuro-monitoring System Market Attractiveness by End Users, 2022-2032

Figure 180: South Asia & Pacific Neuro-monitoring System Market Attractiveness by Country, 2022-2032

Figure 181: MEA Neuro-monitoring System Market Value (US$ Mn) by Product Type, 2022-2032

Figure 182: MEA Neuro-monitoring System Market Value (US$ Mn) by Application, 2022-2032

Figure 183: MEA Neuro-monitoring System Market Value (US$ Mn) by Technology, 2022-2032

Figure 184: MEA Neuro-monitoring System Market Value (US$ Mn) by End Users, 2022-2032

Figure 185: MEA Neuro-monitoring System Market Value (US$ Mn) by Country, 2022-2032

Figure 186: MEA Neuro-monitoring System Market Value (US$ Mn) Analysis by Country, 2017-2032

Figure 187: MEA Neuro-monitoring System Market Volume (Units) Analysis by Country, 2017-2032

Figure 188: MEA Neuro-monitoring System Market Value Share (%) and BPS Analysis by Country, 2022-2032

Figure 189: MEA Neuro-monitoring System Market Y-o-Y Growth (%) Projections by Country, 2022-2032

Figure 190: MEA Neuro-monitoring System Market Value (US$ Mn) Analysis by Product Type, 2017-2032

Figure 191: MEA Neuro-monitoring System Market Volume (Units) Analysis by Product Type, 2017-2032

Figure 192: MEA Neuro-monitoring System Market Value Share (%) and BPS Analysis by Product Type, 2022-2032

Figure 193: MEA Neuro-monitoring System Market Y-o-Y Growth (%) Projections by Product Type, 2022-2032

Figure 194: MEA Neuro-monitoring System Market Value (US$ Mn) Analysis by Application, 2017-2032

Figure 195: MEA Neuro-monitoring System Market Volume (Units) Analysis by Application, 2017-2032

Figure 196: MEA Neuro-monitoring System Market Value Share (%) and BPS Analysis by Application, 2022-2032

Figure 197: MEA Neuro-monitoring System Market Y-o-Y Growth (%) Projections by Application, 2022-2032

Figure 198: MEA Neuro-monitoring System Market Value (US$ Mn) Analysis by Technology, 2017-2032

Figure 199: MEA Neuro-monitoring System Market Volume (Units) Analysis by Technology, 2017-2032

Figure 200: MEA Neuro-monitoring System Market Value Share (%) and BPS Analysis by Technology, 2022-2032

Figure 201: MEA Neuro-monitoring System Market Y-o-Y Growth (%) Projections by Technology, 2022-2032

Figure 202: MEA Neuro-monitoring System Market Value (US$ Mn) Analysis by End Users, 2017-2032

Figure 203: MEA Neuro-monitoring System Market Volume (Units) Analysis by End Users, 2017-2032

Figure 204: MEA Neuro-monitoring System Market Value Share (%) and BPS Analysis by End Users, 2022-2032

Figure 205: MEA Neuro-monitoring System Market Y-o-Y Growth (%) Projections by End Users, 2022-2032

Figure 206: MEA Neuro-monitoring System Market Attractiveness by Product Type, 2022-2032

Figure 207: MEA Neuro-monitoring System Market Attractiveness by Application, 2022-2032

Figure 208: MEA Neuro-monitoring System Market Attractiveness by Technology, 2022-2032

Figure 209: MEA Neuro-monitoring System Market Attractiveness by End Users, 2022-2032

Figure 210: MEA Neuro-monitoring System Market Attractiveness by Country, 2022-2032

Recommendations

Healthcare

Epilepsy Monitoring Devices Market

Published : April 2023

Healthcare

Vital Signs Monitoring Devices Market

Published : January 2023

Healthcare

Dose Monitoring Devices Market

Published : October 2022

Healthcare

Critical Care Patient Monitoring Products Market

Published : June 2022

Explore Healthcare Insights

View Reports

Neuro-monitoring System Market