X-ray System Market Outlook for 2024 to 2034

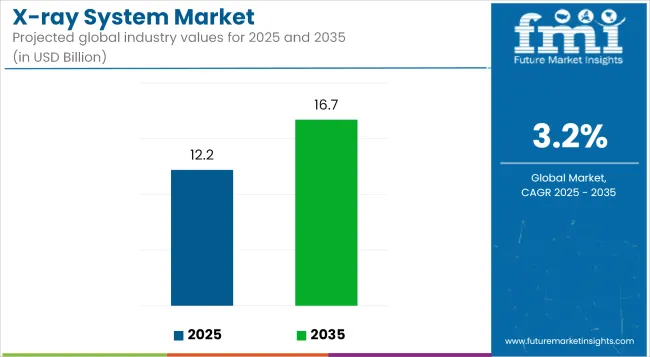
The X-ray system market size is projected to cross a valuation of US$ 11,880.4 million in 2024. The industry is likely to hit US$ 15,969.2 million by 2034. The increasing prevalence of chronic diseases and the aging global population contribute to the growing demand for medical X-ray systems.

Attributes Details
X-ray System Market Value for 2024 US$ 11,880.4 million
X-ray System Market Value for 2034 US$ 15,969.2 million
X-ray System Market Forecast CAGR for 2024 to 2034 3.0%

The sales of X-ray system are likely to expand at a moderate CAGR of 3.0% from 2024 to 2034. The demand for point-of-care imaging solutions is rising, particularly in remote or under-resourced healthcare settings. Companies are developing portable X-ray systems that enable quick and on-site diagnostics, facilitating timely medical interventions.

Don't pay for what you don't need

Customize your report by selecting specific countries or regions and save 30%!

Adoption Analysis of the X-ray System

  • Technological advancements in X-ray systems have led to the development of high-resolution and 3D imaging capabilities. This has expanded the applications of X-ray technology beyond traditional medical diagnostics to areas like industrial inspection and security screening.
  • The rising incidence of cancer worldwide has driven the demand for advanced X-ray technologies in oncology departments of healthcare facilities.
  • Acknowledging concerns about electronic waste, some companies are exploring sustainable practices, such as modular design and recycling programs, to minimize the environmental impact of outdated X-ray equipment.

Historical Performance and Future Growth of the X-ray System Market

CAGR from 2019 to 2023 3.5%
CAGR from 2024 to 2034 3.0%

The period from 2019 to 2023 witnessed significant strides in X-ray system technology, including the adoption of high-resolution imaging and the shift towards digital systems. These innovations fueled market growth by expanding applications in both healthcare and industrial sectors.

  • Increased global healthcare expenditure during this period contributed to the upgrading of medical facilities, fostering the demand for advanced X-ray systems. The emphasis on precision diagnostics and improved patient care further propelled market growth.
  • Companies capitalized on opportunities in emerging economies, leveraging the growing healthcare infrastructure and industrial development.

The X-ray system market may experience a degree of saturation as advanced technologies become more widely adopted. As a result, the market is poised to witness a CAGR of 3% through 2034. The slight decrease in CAGR reflects a mature market where the initial surge in demand has stabilized.

Sabyasachi Ghosh
Sabyasachi Ghosh

Principal Consultant

Talk to Analyst

Find your sweet spots for generating winning opportunities in this market.

Key Trends Influencing the X-ray System Market

  • Rise of Point-of-Care Imaging

The demand for point-of-care imaging is growing, necessitating the development of portable and compact X-ray systems. These systems enable healthcare professionals to conduct on-site diagnostics, particularly in remote or resource-limited settings.

  • Focus on Radiation Dose Reduction

Concerns about radiation exposure have led to a focus on low-dose imaging technologies. Companies are innovating to develop X-ray systems that maintain diagnostic accuracy while minimizing radiation doses, addressing both patient safety and environmental considerations.

  • Interdisciplinary Imaging Solutions

X-ray system manufacturers are increasingly working on integrating their technology with other imaging modalities, such as magnetic resonance imaging (MRI) and computed tomography (CT). This interdisciplinary approach provides a more comprehensive diagnostic toolkit for healthcare providers.

  • Telemedicine and Remote Imaging

The growth of telemedicine has spurred the development of X-ray systems with remote monitoring capabilities. This allows healthcare professionals to monitor and interpret imaging results remotely, enhancing accessibility to diagnostic services.

  • Sustainable Practices and Eco-Friendly Designs

Companies are increasingly adopting sustainable practices in X-ray system manufacturing. Modular designs and recycling initiatives are being explored to reduce electronic waste and minimize the environmental footprint of X-ray equipment.

  • Personalized Medicine and Advanced Applications

The trend toward personalized medicine is influencing the development of X-ray systems with tailored diagnostic capabilities. Advanced applications, such as functional and molecular imaging, are becoming areas of exploration for more precise diagnostics.

  • Regulatory Emphasis on Cybersecurity

With the digitalization of X-ray systems, there is a growing emphasis on cybersecurity to protect patient data. Compliance with stringent regulatory standards for data security is a key trend, driving companies to invest in robust cybersecurity measures.

Comparative View of the Adjacent X-ray System Market

This section focuses on providing a comparative analysis of three distinct markets, the X-ray system market, the X-ray positioning devices market, and X-ray photoelectron spectroscopy market. Each market segment is evaluated based on the projected value-based CAGR from 2024 to 2034, the growth factor, identified opportunities, and prevalent key trends.

X-ray System Market:

Attributes X-ray System Market
Value-based CAGR (2024 to 2034) 3.0%
Growth Factor Integration of AI-driven diagnostics propelling precision and efficiency in medical and industrial applications
Opportunity Expanding adoption in emerging economies with increasing healthcare infrastructure investments
Key Trends Continued shift towards digitalization and cloud integration for enhanced accessibility and collaborative diagnostics

X-Ray Positioning Devices Market:

Attributes X-Ray Positioning Devices Market
Value-based CAGR (2024 to 2034) 8%
Growth Factor Rising demand for advanced imaging techniques fueling the need for highly precise and customizable positioning devices
Opportunity Rapidly expanding market with a notable CAGR, offering significant potential for innovation by companies
Key Trends Increasing adoption of robotic and automated positioning solutions for streamlined imaging processes

X-ray Photoelectron Spectroscopy Market:

Attributes X-ray Photoelectron Spectroscopy Market
Value-based CAGR (2024 to 2034) 6.9%
Growth Factor Advancements in material research and analysis, driving the demand for high-resolution spectroscopy techniques
Opportunity Growing applications in pharmaceuticals and materials science, opening avenues for expansion
Key Trends Increasing focus on environmental sustainability and energy-related research in the spectroscopy market

Get the data you need at a Fraction of the cost

Personalize your report by choosing insights you need
and save 40%!

Category-wise Insights

In this section, a comprehensive examination of category-wise insights provides a detailed understanding of the X-ray system industry. The analysis is structured around product type and application segment. The report further highlights the dominance of the medical X-ray device segment and the persistent high adoption of X-ray systems in medical applications.

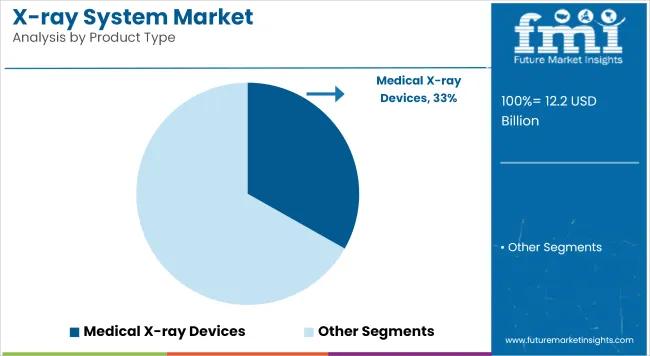
Medical X-ray Device Segment Takes Lead in X-ray System Market with 65.6% Share

Attributes Detail
By Product Type Medical X-ray Devices
Market Share in 2024 65.6%

With an impressive share of 65.6% in 2024, the medical X-ray device segment emerges as the undeniable leader.

  • Continuous advancements in medical X-ray technology drive increased adoption and dominance.
  • Growing demand for precise diagnostic tools reinforces the indispensability of medical X-ray devices in healthcare settings.
  • Widening applications in diagnostics, surgery, and interventional procedures contribute to sustained market growth.
  • Increased global healthcare spending propels the adoption of advanced medical X-ray devices.

Adoption of X-ray System in Medical Applications to Remain at All-time High

Attributes Detail
Dominating Application Segment Medical
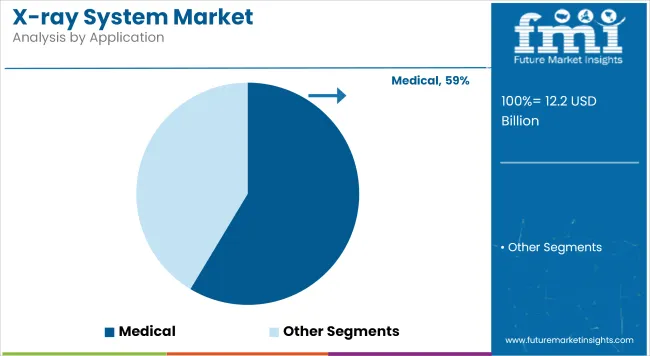
Market Share in 2024 55.5%

Capturing a substantial 55.5% market share in 2024, X-ray systems for medical applications maintain unwavering relevance in the global healthcare industry.

  • X-ray systems persist as indispensable tools for accurate medical diagnostics, ensuring swift and precise patient care.
  • Ongoing advancements broaden applications, from traditional diagnostics to intricate medical interventions.
  • The global healthcare landscape's reliance on X-ray systems fuels sustained growth.
  • Continuous innovation, including AI and digitalization, amplifies X-ray system capabilities, enhancing clinical outcomes.

Country-wise Insights

This section provides the country-wise analysis of the X-ray system market by offering insights into the CAGR projections through 2034 across key countries. The focus is on understanding the varied growth trajectories in the United States, Germany, China, India, and the United Kingdom. Notably, the report reveals the demand for X-ray system in India is projected to remain relevantly high with a steady CAGR of 4.5% through 2034.

Countries CAGR through 2034
United States 1.4%
Germany 1.8%
China 3.9%
India 4.5%
United Kingdom 2.0%

X-ray System Industry in the United States

The X-ray system industry in the United States is expected to record a sluggish CAGR of 1.4% through 2034.

  • The United States remains a global leader in technological innovation, particularly in areas like AI, biotech, and software development, impacting the demand outlook for X-ray systems.
  • Ongoing technological advancements contribute to sustained growth.
  • Collaborative efforts with healthcare institutions are likely to be a key move by manufacturers.

X-ray System Industry in Germany

The X-ray system industry in Germany is anticipated to rise at a CAGR of 1.8% through 2034.

  • Germany's reputation for high-quality manufacturing and engineering attracts investment and propels growth in X-ray systems.
  • Strong collaborations between renowned research institutions and industry fuel innovation.
  • Strict adherence to high-quality standards establishes trust in the market.

X-ray System Industry in China

The X-ray system industry in China is projected to witness a CAGR of 3.9% through 2034.

  • Swift advancements highlight China's leap in X-ray technology, driving significant growth.
  • Extensive investments in healthcare infrastructure create favorable conditions for X-ray system adoption.
  • Government policies, including financial incentives, propel the growth of X-ray technology.

X-ray System Industry in India

The X-ray system industry in India is anticipated to record a CAGR of 4.5% through 2034.

  • Initiatives, including telemedicine, contribute to enhancing medical accessibility and sustained growth.
  • Incorporation of advanced technologies aligns with India's leapfrogging approach to market expansion.
  • Schemes like Ayushman Bharat play a crucial role in fostering X-ray system adoption.

X-ray System Industry in the United Kingdom

The X-ray system industry in the United Kingdom is likely to expand at a CAGR of 2.0% through 2034.

  • A focus on clinical excellence and research underscores the UK's unique growth trajectory.
  • Collaborations with the NHS ensure widespread integration of X-ray systems into the healthcare ecosystem.
  • Rising focus on patient-centered healthcare solutions aligns with the UK's healthcare approach.

Companies Shaping the Future Outlook of the X-ray System Industry

The X-ray system industry is characterized by a mature and consolidated global market, with major players dominating the landscape. However, increasing competition is evident, particularly from new entrants in emerging markets like China and India.

The competition is defined by high product differentiation, strong brand loyalty, significant regulatory barriers, and cost pressures on hospitals and clinics. Despite these challenges, growth drivers include an aging population, rising healthcare spending, technological advancements, and expanding market access in developing countries.

Looking ahead, key trends shaping the competition in the X-ray system industry include an increased focus on value-based solutions, growing demand for mobile and portable X-ray systems, adoption of artificial intelligence to enhance image quality and automate workflows, and the strategic expansion into emerging markets like China and India, which present significant growth opportunities.

Startup Outlook for the X-ray System Industry

The X-ray system industry presents a promising landscape for startups offering innovative solutions that address unmet needs and leverage emerging technologies. While established players dominate the market, there are several opportunities for startups to carve their niche and achieve success.

Key Opportunities

  • Specialization in niche applications

Startups can focus on specific applications like dental X-rays, veterinary imaging, or portable X-ray solutions for remote locations.

  • AI-powered solutions

Develop AI-powered algorithms for image analysis, patient diagnosis, and dose optimization, offering improved accuracy and efficiency.

  • Cloud-based platforms

Develop cloud-based platforms for image storage, sharing, and remote diagnostics, enabling accessibility and collaboration.

  • Focus on cost-effectiveness

Offer affordable X-ray systems catering to budget-conscious healthcare providers, particularly in emerging markets.

  • Mobile and portable X-ray solutions

Develop user-friendly, compact, and portable X-ray systems for improved mobility and accessibility in diverse settings.

Recent Developments in the X-ray System Industry

  • In August 2021, Shimadzu Corporation launched the mobile X-ray system “MobileArt Evolution MX8 Version”, which supports using a flat panel X-ray detector (FPD) for digital imaging applications.
  • GE Healthcare partnered with Amazon Web Services (AWS) to provide AI and cloud-based imaging solutions to hospitals and healthcare providers.
  • In October 2021, Siemens Healthineers launched Luminos Impulse, a 2-in-1 remote-controlled imaging device that integrates fluoroscopy and radiography for improved clinical productivity and efficiency.

Key Companies in the Market

  • Koninklijke Philips N.V.
  • Siemens Healthineers AG
  • GE Healthcare
  • Canon Medical Systems
  • Shimadzu Corporation
  • FUJIFILM SonoSite, Inc.
  • Carestream
  • Mindray Medical International Limited
  • Hologic, Inc
  • New Medical Imaging
  • AGFA

Key Segments

By Product Type:

  • Medical X-ray Devices
    • Fixed/Floor Mounted
    • Mobile and Portable Devices
  • X-Ray Diffraction (XRD)
    • Powder Diffraction
    • High-Resolution XRD
    • Custom XRD
  • X-Ray Fluorescence (XRF)
    • Security X-Ray Devices
    • Closed X-Ray Systems
      • Full Body Scanner
        • Single View
        • Dual View
    • SAXS/WAXS

By Application:

  • Medical
  • Research and Development
  • Security

By End Use:

  • Hospital
  • Diagnostic Imaging Centers
  • Airports
  • Malls
  • Railway & Metro Stations
  • Government Facilities & Homeland Security

By Region:

  • North America
  • Latin America
  • Europe
  • East Asia
  • South Asia
  • Middle East and Africa

Frequently Asked Questions

What is the Market Potential for X-ray System?

The X-ray system market is projected to expand at a CAGR of 3.0% between 2024 and 2034.

Which Product Type Segment Dominates the X-ray System Market?

The medical X-ray devices segment dominates the X-ray system industry.

Who are the Top X-ray System Companies?

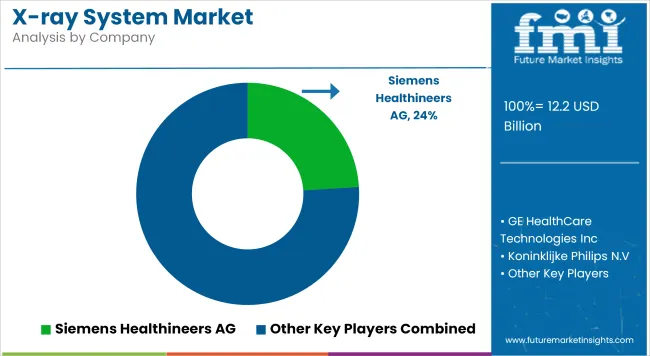
Koninklijke Philips N.V., Siemens Healthineers AG, and GE Healthcare are some of the top X-ray system manufacturers.

What is the X-ray System Market Growth Outlook for 2034?

The X-ray system market is anticipated to surpass US$ 15,969.2 million by 2034.

Which Trend is Driving the Demand for X-ray System through 2034?

Rising healthcare spending globally is a primary trend driving the demand for X-ray systems through 2034

Table of Content
1. Executive Summary

    1.1. Global Market Outlook

    1.2. Demand-side Trends

    1.3. Supply-side Trends

    1.4. Technology Roadmap Analysis

    1.5. Analysis and Recommendations

2. Market Overview

    2.1. Market Coverage / Taxonomy

    2.2. Market Definition / Scope / Limitations

3. Market Background

    3.1. Market Dynamics

        3.1.1. Drivers

        3.1.2. Restraints

        3.1.3. Opportunity

        3.1.4. Trends

    3.2. Scenario Forecast

        3.2.1. Demand in Optimistic Scenario

        3.2.2. Demand in Likely Scenario

        3.2.3. Demand in Conservative Scenario

    3.3. Opportunity Map Analysis

    3.4. Product Life Cycle Analysis

    3.5. Supply Chain Analysis

        3.5.1. Supply Side Participants and their Roles

            3.5.1.1. Producers

            3.5.1.2. Mid-Level Participants (Traders/ Agents/ Brokers)

            3.5.1.3. Wholesalers and Distributors

        3.5.2. Value Added and Value Created at Node in the Supply Chain

        3.5.3. List of Raw Material Suppliers

        3.5.4. List of Existing and Potential Buyer’s

    3.6. Investment Feasibility Matrix

    3.7. Value Chain Analysis

        3.7.1. Profit Margin Analysis

        3.7.2. Wholesalers and Distributors

        3.7.3. Retailers

    3.8. PESTLE and Porter’s Analysis

    3.9. Regulatory Landscape

        3.9.1. By Key Regions

        3.9.2. By Key Countries

    3.10. Regional Parent Market Outlook

    3.11. Production and Consumption Statistics

    3.12. Import and Export Statistics

4. Global Market Analysis 2019 to 2023 and Forecast, 2024 to 2034

    4.1. Historical Market Size Value (US$ Million) & Volume (Units) Analysis, 2019 to 2023

    4.2. Current and Future Market Size Value (US$ Million) & Volume (Units) Projections, 2024 to 2034

        4.2.1. Y-o-Y Growth Trend Analysis

        4.2.2. Absolute $ Opportunity Analysis

5. Global Market Analysis 2019 to 2023 and Forecast 2024 to 2034, By Technology

    5.1. Introduction / Key Findings

    5.2. Historical Market Size Value (US$ Million) & Volume (Units) Analysis By Technology, 2019 to 2023

    5.3. Current and Future Market Size Value (US$ Million) & Volume (Units) Analysis and Forecast By Technology, 2024 to 2034

        5.3.1. Digital Radiography

        5.3.2. Computed Radiography

    5.4. Y-o-Y Growth Trend Analysis By Technology, 2019 to 2023

    5.5. Absolute $ Opportunity Analysis By Technology, 2024 to 2034

6. Global Market Analysis 2019 to 2023 and Forecast 2024 to 2034, By Mobility

    6.1. Introduction / Key Findings

    6.2. Historical Market Size Value (US$ Million) & Volume (Units) Analysis By Mobility, 2019 to 2023

    6.3. Current and Future Market Size Value (US$ Million) & Volume (Units) Analysis and Forecast By Mobility, 2024 to 2034

        6.3.1. Stationary

        6.3.2. Mobile

    6.4. Y-o-Y Growth Trend Analysis By Mobility, 2019 to 2023

    6.5. Absolute $ Opportunity Analysis By Mobility, 2024 to 2034

7. Global Market Analysis 2019 to 2023 and Forecast 2024 to 2034, By End Uses

    7.1. Introduction / Key Findings

    7.2. Historical Market Size Value (US$ Million) & Volume (Units) Analysis By End Uses, 2019 to 2023

    7.3. Current and Future Market Size Value (US$ Million) & Volume (Units) Analysis and Forecast By End Uses, 2024 to 2034

        7.3.1. Hospitals

        7.3.2. Diagnostic Imaging Centres

    7.4. Y-o-Y Growth Trend Analysis By End Uses, 2019 to 2023

    7.5. Absolute $ Opportunity Analysis By End Uses, 2024 to 2034

8. Global Market Analysis 2019 to 2023 and Forecast 2024 to 2034, By Region

    8.1. Introduction

    8.2. Historical Market Size Value (US$ Million) & Volume (Units) Analysis By Region, 2019 to 2023

    8.3. Current Market Size Value (US$ Million) & Volume (Units) Analysis and Forecast By Region, 2024 to 2034

        8.3.1. North America

        8.3.2. Latin America

        8.3.3. Western Europe

        8.3.4. Eastern Europe

        8.3.5. South Asia and Pacific

        8.3.6. East Asia

        8.3.7. Middle East and Africa

    8.4. Market Attractiveness Analysis By Region

9. North America Market Analysis 2019 to 2023 and Forecast 2024 to 2034, By Country

    9.1. Historical Market Size Value (US$ Million) & Volume (Units) Trend Analysis By Market Taxonomy, 2019 to 2023

    9.2. Market Size Value (US$ Million) & Volume (Units) Forecast By Market Taxonomy, 2024 to 2034

        9.2.1. By Country

            9.2.1.1. USA

            9.2.1.2. Canada

        9.2.2. By Technology

        9.2.3. By Mobility

        9.2.4. By End Uses

    9.3. Market Attractiveness Analysis

        9.3.1. By Country

        9.3.2. By Technology

        9.3.3. By Mobility

        9.3.4. By End Uses

    9.4. Key Takeaways

10. Latin America Market Analysis 2019 to 2023 and Forecast 2024 to 2034, By Country

    10.1. Historical Market Size Value (US$ Million) & Volume (Units) Trend Analysis By Market Taxonomy, 2019 to 2023

    10.2. Market Size Value (US$ Million) & Volume (Units) Forecast By Market Taxonomy, 2024 to 2034

        10.2.1. By Country

            10.2.1.1. Brazil

            10.2.1.2. Mexico

            10.2.1.3. Rest of Latin America

        10.2.2. By Technology

        10.2.3. By Mobility

        10.2.4. By End Uses

    10.3. Market Attractiveness Analysis

        10.3.1. By Country

        10.3.2. By Technology

        10.3.3. By Mobility

        10.3.4. By End Uses

    10.4. Key Takeaways

11. Western Europe Market Analysis 2019 to 2023 and Forecast 2024 to 2034, By Country

    11.1. Historical Market Size Value (US$ Million) & Volume (Units) Trend Analysis By Market Taxonomy, 2019 to 2023

    11.2. Market Size Value (US$ Million) & Volume (Units) Forecast By Market Taxonomy, 2024 to 2034

        11.2.1. By Country

            11.2.1.1. Germany

            11.2.1.2. UK

            11.2.1.3. France

            11.2.1.4. Spain

            11.2.1.5. Italy

            11.2.1.6. Rest of Western Europe

        11.2.2. By Technology

        11.2.3. By Mobility

        11.2.4. By End Uses

    11.3. Market Attractiveness Analysis

        11.3.1. By Country

        11.3.2. By Technology

        11.3.3. By Mobility

        11.3.4. By End Uses

    11.4. Key Takeaways

12. Eastern Europe Market Analysis 2019 to 2023 and Forecast 2024 to 2034, By Country

    12.1. Historical Market Size Value (US$ Million) & Volume (Units) Trend Analysis By Market Taxonomy, 2019 to 2023

    12.2. Market Size Value (US$ Million) & Volume (Units) Forecast By Market Taxonomy, 2024 to 2034

        12.2.1. By Country

            12.2.1.1. Poland

            12.2.1.2. Russia

            12.2.1.3. Czech Republic

            12.2.1.4. Romania

            12.2.1.5. Rest of Eastern Europe

        12.2.2. By Technology

        12.2.3. By Mobility

        12.2.4. By End Uses

    12.3. Market Attractiveness Analysis

        12.3.1. By Country

        12.3.2. By Technology

        12.3.3. By Mobility

        12.3.4. By End Uses

    12.4. Key Takeaways

13. South Asia and Pacific Market Analysis 2019 to 2023 and Forecast 2024 to 2034, By Country

    13.1. Historical Market Size Value (US$ Million) & Volume (Units) Trend Analysis By Market Taxonomy, 2019 to 2023

    13.2. Market Size Value (US$ Million) & Volume (Units) Forecast By Market Taxonomy, 2024 to 2034

        13.2.1. By Country

            13.2.1.1. India

            13.2.1.2. Bangladesh

            13.2.1.3. Australia

            13.2.1.4. New Zealand

            13.2.1.5. Rest of South Asia and Pacific

        13.2.2. By Technology

        13.2.3. By Mobility

        13.2.4. By End Uses

    13.3. Market Attractiveness Analysis

        13.3.1. By Country

        13.3.2. By Technology

        13.3.3. By Mobility

        13.3.4. By End Uses

    13.4. Key Takeaways

14. East Asia Market Analysis 2019 to 2023 and Forecast 2024 to 2034, By Country

    14.1. Historical Market Size Value (US$ Million) & Volume (Units) Trend Analysis By Market Taxonomy, 2019 to 2023

    14.2. Market Size Value (US$ Million) & Volume (Units) Forecast By Market Taxonomy, 2024 to 2034

        14.2.1. By Country

            14.2.1.1. China

            14.2.1.2. Japan

            14.2.1.3. South Korea

        14.2.2. By Technology

        14.2.3. By Mobility

        14.2.4. By End Uses

    14.3. Market Attractiveness Analysis

        14.3.1. By Country

        14.3.2. By Technology

        14.3.3. By Mobility

        14.3.4. By End Uses

    14.4. Key Takeaways

15. Middle East and Africa Market Analysis 2019 to 2023 and Forecast 2024 to 2034, By Country

    15.1. Historical Market Size Value (US$ Million) & Volume (Units) Trend Analysis By Market Taxonomy, 2019 to 2023

    15.2. Market Size Value (US$ Million) & Volume (Units) Forecast By Market Taxonomy, 2024 to 2034

        15.2.1. By Country

            15.2.1.1. GCC Countries

            15.2.1.2. South Africa

            15.2.1.3. Israel

            15.2.1.4. Rest of MEA

        15.2.2. By Technology

        15.2.3. By Mobility

        15.2.4. By End Uses

    15.3. Market Attractiveness Analysis

        15.3.1. By Country

        15.3.2. By Technology

        15.3.3. By Mobility

        15.3.4. By End Uses

    15.4. Key Takeaways

16. Key Countries Market Analysis

    16.1. USA

        16.1.1. Pricing Analysis

        16.1.2. Market Share Analysis, 2023

            16.1.2.1. By Technology

            16.1.2.2. By Mobility

            16.1.2.3. By End Uses

    16.2. Canada

        16.2.1. Pricing Analysis

        16.2.2. Market Share Analysis, 2023

            16.2.2.1. By Technology

            16.2.2.2. By Mobility

            16.2.2.3. By End Uses

    16.3. Brazil

        16.3.1. Pricing Analysis

        16.3.2. Market Share Analysis, 2023

            16.3.2.1. By Technology

            16.3.2.2. By Mobility

            16.3.2.3. By End Uses

    16.4. Mexico

        16.4.1. Pricing Analysis

        16.4.2. Market Share Analysis, 2023

            16.4.2.1. By Technology

            16.4.2.2. By Mobility

            16.4.2.3. By End Uses

    16.5. Germany

        16.5.1. Pricing Analysis

        16.5.2. Market Share Analysis, 2023

            16.5.2.1. By Technology

            16.5.2.2. By Mobility

            16.5.2.3. By End Uses

    16.6. UK

        16.6.1. Pricing Analysis

        16.6.2. Market Share Analysis, 2023

            16.6.2.1. By Technology

            16.6.2.2. By Mobility

            16.6.2.3. By End Uses

    16.7. France

        16.7.1. Pricing Analysis

        16.7.2. Market Share Analysis, 2023

            16.7.2.1. By Technology

            16.7.2.2. By Mobility

            16.7.2.3. By End Uses

    16.8. Spain

        16.8.1. Pricing Analysis

        16.8.2. Market Share Analysis, 2023

            16.8.2.1. By Technology

            16.8.2.2. By Mobility

            16.8.2.3. By End Uses

    16.9. Italy

        16.9.1. Pricing Analysis

        16.9.2. Market Share Analysis, 2023

            16.9.2.1. By Technology

            16.9.2.2. By Mobility

            16.9.2.3. By End Uses

    16.10. Poland

        16.10.1. Pricing Analysis

        16.10.2. Market Share Analysis, 2023

            16.10.2.1. By Technology

            16.10.2.2. By Mobility

            16.10.2.3. By End Uses

    16.11. Russia

        16.11.1. Pricing Analysis

        16.11.2. Market Share Analysis, 2023

            16.11.2.1. By Technology

            16.11.2.2. By Mobility

            16.11.2.3. By End Uses

    16.12. Czech Republic

        16.12.1. Pricing Analysis

        16.12.2. Market Share Analysis, 2023

            16.12.2.1. By Technology

            16.12.2.2. By Mobility

            16.12.2.3. By End Uses

    16.13. Romania

        16.13.1. Pricing Analysis

        16.13.2. Market Share Analysis, 2023

            16.13.2.1. By Technology

            16.13.2.2. By Mobility

            16.13.2.3. By End Uses

    16.14. India

        16.14.1. Pricing Analysis

        16.14.2. Market Share Analysis, 2023

            16.14.2.1. By Technology

            16.14.2.2. By Mobility

            16.14.2.3. By End Uses

    16.15. Bangladesh

        16.15.1. Pricing Analysis

        16.15.2. Market Share Analysis, 2023

            16.15.2.1. By Technology

            16.15.2.2. By Mobility

            16.15.2.3. By End Uses

    16.16. Australia

        16.16.1. Pricing Analysis

        16.16.2. Market Share Analysis, 2023

            16.16.2.1. By Technology

            16.16.2.2. By Mobility

            16.16.2.3. By End Uses

    16.17. New Zealand

        16.17.1. Pricing Analysis

        16.17.2. Market Share Analysis, 2023

            16.17.2.1. By Technology

            16.17.2.2. By Mobility

            16.17.2.3. By End Uses

    16.18. China

        16.18.1. Pricing Analysis

        16.18.2. Market Share Analysis, 2023

            16.18.2.1. By Technology

            16.18.2.2. By Mobility

            16.18.2.3. By End Uses

    16.19. Japan

        16.19.1. Pricing Analysis

        16.19.2. Market Share Analysis, 2023

            16.19.2.1. By Technology

            16.19.2.2. By Mobility

            16.19.2.3. By End Uses

    16.20. South Korea

        16.20.1. Pricing Analysis

        16.20.2. Market Share Analysis, 2023

            16.20.2.1. By Technology

            16.20.2.2. By Mobility

            16.20.2.3. By End Uses

    16.21. GCC Countries

        16.21.1. Pricing Analysis

        16.21.2. Market Share Analysis, 2023

            16.21.2.1. By Technology

            16.21.2.2. By Mobility

            16.21.2.3. By End Uses

    16.22. South Africa

        16.22.1. Pricing Analysis

        16.22.2. Market Share Analysis, 2023

            16.22.2.1. By Technology

            16.22.2.2. By Mobility

            16.22.2.3. By End Uses

    16.23. Israel

        16.23.1. Pricing Analysis

        16.23.2. Market Share Analysis, 2023

            16.23.2.1. By Technology

            16.23.2.2. By Mobility

            16.23.2.3. By End Uses

17. Market Structure Analysis

    17.1. Competition Dashboard

    17.2. Competition Benchmarking

    17.3. Market Share Analysis of Top Players

        17.3.1. By Regional

        17.3.2. By Technology

        17.3.3. By Mobility

        17.3.4. By End Uses

18. Competition Analysis

    18.1. Competition Deep Dive

        18.1.1. Koninklijke Philips N.V.

            18.1.1.1. Overview

            18.1.1.2. Product Portfolio

            18.1.1.3. Profitability by Market Segments

            18.1.1.4. Sales Footprint

            18.1.1.5. Strategy Overview

                18.1.1.5.1. Marketing Strategy

                18.1.1.5.2. Product Strategy

                18.1.1.5.3. Channel Strategy

        18.1.2. Siemens Healthineers AG

            18.1.2.1. Overview

            18.1.2.2. Product Portfolio

            18.1.2.3. Profitability by Market Segments

            18.1.2.4. Sales Footprint

            18.1.2.5. Strategy Overview

                18.1.2.5.1. Marketing Strategy

                18.1.2.5.2. Product Strategy

                18.1.2.5.3. Channel Strategy

        18.1.3. GE Healthcare

            18.1.3.1. Overview

            18.1.3.2. Product Portfolio

            18.1.3.3. Profitability by Market Segments

            18.1.3.4. Sales Footprint

            18.1.3.5. Strategy Overview

                18.1.3.5.1. Marketing Strategy

                18.1.3.5.2. Product Strategy

                18.1.3.5.3. Channel Strategy

        18.1.4. Canon Medical Systems

            18.1.4.1. Overview

            18.1.4.2. Product Portfolio

            18.1.4.3. Profitability by Market Segments

            18.1.4.4. Sales Footprint

            18.1.4.5. Strategy Overview

                18.1.4.5.1. Marketing Strategy

                18.1.4.5.2. Product Strategy

                18.1.4.5.3. Channel Strategy

        18.1.5. Shimadzu Corporation

            18.1.5.1. Overview

            18.1.5.2. Product Portfolio

            18.1.5.3. Profitability by Market Segments

            18.1.5.4. Sales Footprint

            18.1.5.5. Strategy Overview

                18.1.5.5.1. Marketing Strategy

                18.1.5.5.2. Product Strategy

                18.1.5.5.3. Channel Strategy

        18.1.6. FUJIFILM SonoSite, Inc.

            18.1.6.1. Overview

            18.1.6.2. Product Portfolio

            18.1.6.3. Profitability by Market Segments

            18.1.6.4. Sales Footprint

            18.1.6.5. Strategy Overview

                18.1.6.5.1. Marketing Strategy

                18.1.6.5.2. Product Strategy

                18.1.6.5.3. Channel Strategy

        18.1.7. Carestream

            18.1.7.1. Overview

            18.1.7.2. Product Portfolio

            18.1.7.3. Profitability by Market Segments

            18.1.7.4. Sales Footprint

            18.1.7.5. Strategy Overview

                18.1.7.5.1. Marketing Strategy

                18.1.7.5.2. Product Strategy

                18.1.7.5.3. Channel Strategy

        18.1.8. Mindray Medical International Limited

            18.1.8.1. Overview

            18.1.8.2. Product Portfolio

            18.1.8.3. Profitability by Market Segments

            18.1.8.4. Sales Footprint

            18.1.8.5. Strategy Overview

                18.1.8.5.1. Marketing Strategy

                18.1.8.5.2. Product Strategy

                18.1.8.5.3. Channel Strategy

        18.1.9. Hologic, Inc

            18.1.9.1. Overview

            18.1.9.2. Product Portfolio

            18.1.9.3. Profitability by Market Segments

            18.1.9.4. Sales Footprint

            18.1.9.5. Strategy Overview

                18.1.9.5.1. Marketing Strategy

                18.1.9.5.2. Product Strategy

                18.1.9.5.3. Channel Strategy

        18.1.10. New Medical Imaging

            18.1.10.1. Overview

            18.1.10.2. Product Portfolio

            18.1.10.3. Profitability by Market Segments

            18.1.10.4. Sales Footprint

            18.1.10.5. Strategy Overview

                18.1.10.5.1. Marketing Strategy

                18.1.10.5.2. Product Strategy

                18.1.10.5.3. Channel Strategy

19. Assumptions & Acronyms Used

20. Research Methodology
Recommendations

Healthcare

X-Ray Positioning Devices Market

September 2024

REP-GB-2252

Upcoming

Healthcare

X-ray Photoelectron Spectroscopy Market

February 2022

REP-GB-539

June 2022

250 pages

Explore Healthcare Insights

View Reports