
- Market Size (2026)
- USD 1.7 Bn
- Forecast (2036)
- USD 3.0 Bn
- CAGR (2026 to 2036)
- 6.0%
How big is the HVAC system analyzer market in 2026?
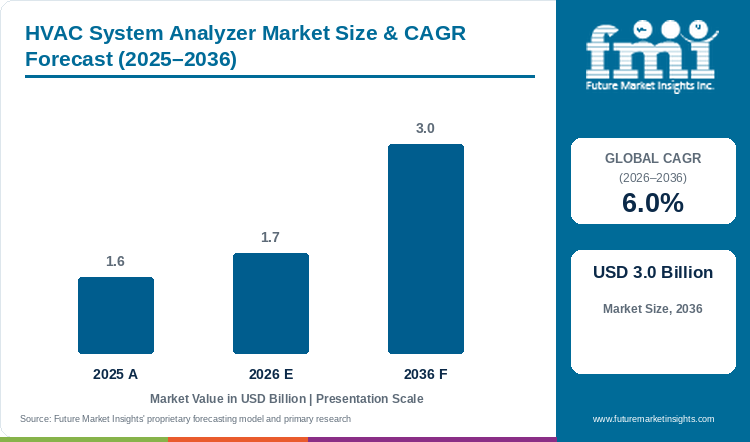
The HVAC System Analyzer Market is projected to expand at a CAGR of 6.0% between 2026 and 2036. Market value rises from USD 1.6 billion in 2025 to USD 1.7 billion in 2026 and USD 3.0 billion by 2036. [1]
The HVAC system analyzer market was valued at USD 1.6 billion in 2025. It is estimated at USD 1.7 billion in 2026 and forecast at USD 3.0 billion by 2036, with a 6.0% CAGR over the forecast period. Demand covers instruments used to examine operating conditions in heating, ventilation, air-conditioning and refrigeration systems. Technicians and facility teams select tools around the measurements needed, the service environment and the records required after the visit.
HVAC diagnostics cover airflow balancing, temperature, pressure, humidity, refrigeration-system conditions and leakage. Instruments combine some functions or focus on a particular task. Fluke’s 922 measures airflow-related parameters, while digital manifolds from Testo, Fieldpiece and Mastercool serve refrigeration-system measurement. Buyers select the instrument and accessories around the equipment being serviced and the readings required. [2, 3, 4, 5]
The value of a reading depends on how it is taken and used. A technician needs suitable probes, a workable connection to the system and enough context to interpret the result. Digital instruments can also support recording and sharing measurements, helping the service team maintain a record of the visit. Department of Energy guidance describes commissioning and maintenance as continuing parts of HVAC performance management. Instruments support that work by making system conditions visible for assessment and follow-up. [3, 4, 6]
Key Market Trends & Insights
- Digital output displays held 58.0% of revenue in 2025. [1]
- Commercial applications accounted for 30.0% of revenue in 2025. [1]
- Handheld instruments held 55.0% of revenue in 2025. [1]
- Tool selection depends on measurement tasks, probes, operating conditions and documentation needs.
Regional Highlights
- Profiled markets include United States, Germany, United Kingdom, China, India.
- Commissioning, building-performance programs and local service requirements define different purchasing settings for diagnostic instruments.
Market Size & Forecast
Table 1: Market Size and Forecast for the HVAC System Analyzer Market (USD billion and percentage), 2025 to 2036
| Metric | Value |
|---|---|
| 2025 Market Size | USD 1.6 billion |
| Estimated Market Size in 2026 | USD 1.7 billion |
| Projected Market Size by 2036 | USD 3.0 billion |
| CAGR, 2026 to 2036 | 6.0% |
| Added Revenue, 2026 to 2036 | USD 1.3 billion |
| Market Expansion Multiple | 1.8x |
Purchasing follows the measurements required during commissioning, maintenance and service. Sensors, probes, system compatibility and documentation determine the usefulness of the selected instrument. [3, 4, 6]
HVAC System Analyzer Market Industry and Operating Indicators
Published product and operating developments describe the choices and requirements suppliers face.
Table 2: Industry Indicators for the HVAC System Analyzer Market, 2025 to 2026
| Indicator | Data Point | Why It Matters | Source |
|---|---|---|---|
| Refrigerant monitoring | MSA introduced Bacharach X30 and X50 refrigerant monitors in February 2026. | Adds documented fixed-monitoring configurations for HVAC/R applications. | [7] |
| Connected instruments | Mastercool’s 2025 HVAC/R presentation documents digital manifolds and connected service instruments. | Shows how field measurements can be recorded and used within service work. | [19] |
| Service-tool documentation | YELLOW JACKET’s May 2025 guide covers A2L-compatible service tools; its current product page identifies probes and manifold options. | Supports selection of tools and accessories for the intended system. | [18] |
Analyst Perspective
An analyzer needs to fit the service task. The technician must be able to connect it, obtain the required readings and keep a useful record. Buyers should assess the complete measuring setup, including probes and support, as part of the tool’s commercial value.
- Nikhil Kaitwade, Principal Consultant, Future Market Insights.
How is the HVAC system analyzer market segmented?
The market is segmented by Output Display, Application and Configuration. [1]
By Output Display: Digital, Analog.
By Application: Commercial, Industrial, Residential, Automotive & Transportation, Others.
By Configuration: Handheld, Mobile Units, Stationary Units.
By Region: North America, Latin America, Western Europe, Eastern Europe, East Asia, South Asia and Pacific, Middle East and Africa.
Output display distinguishes digital and analog instruments. Application coverage includes commercial, industrial, residential, automotive and transportation systems, and other uses. Configuration separates handheld instruments, mobile units and stationary units. These categories span field-service tools and installed monitoring, with the measurement function determining the role of each product. Portable airflow instruments, refrigerant manifolds and stationary refrigerant monitors address different conditions. Embedded thermal-energy meters provide related operating information within hydronic systems and are considered separately from portable diagnostic tools. [1, 2, 7, 8]
What supports digital output displays?
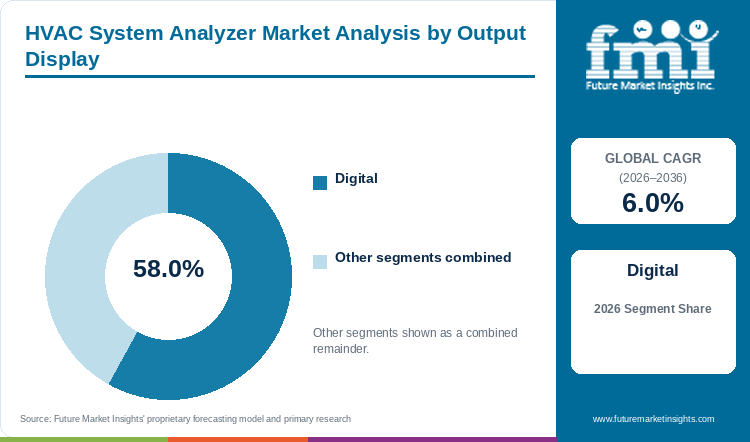
Digital output displays held 58.0% of segment revenue in 2025. Buyers compare screen functions and stored records alongside sensors, probes and measurement setup. [1, 3, 4]
Table 3: Output Display Share for the HVAC System Analyzer Market (percentage share), 2025
| Output Display | Share (2025) |
|---|---|
| Digital Output Displays | 58.0% |
| Other Segments Combined | 42.0% |
| Total | 100.0% |
Table 4: Output Display Focus and Market Growth for the HVAC System Analyzer Market, 2026 to 2036
| Metric | Value |
|---|---|
| Global CAGR (2026 to 2036) | 6.0% |
| Featured Category | Digital Output Displays |
A digital display can present several readings together and support the interpretation of changing conditions. Testo’s 558s includes a touchscreen and trend visualization, while Fieldpiece’s SMAN range combines measurement display with data logging and connections to wireless tools. The buyer needs to assess the functions available on the specific model. Screen layout and stored records can support service work, but measurement quality also depends on the sensor, probe and setup. Digital presentation is therefore one part of the instrument selection process. [3, 4]
- Digital output displays held 58.0% of segment revenue in 2025. [1]
- Testo documents trend visualization and touchscreen operation for the 558s manifold. [3]
What supports commercial applications?
Commercial applications accounted for 30.0% of revenue in 2025. Facility teams use airflow checks, refrigerant diagnostics and fixed monitoring according to the installation and service task. [1, 6, 7]
Commercial installations, including commercial heat pumps, can involve several pieces of HVAC equipment and operating zones. A facility team may need airflow checks, refrigerant diagnostics and fixed monitoring in relevant plant areas. DOE commissioning guidance covers new and existing buildings and the need to revisit performance when conditions do not meet expectations. Readings taken during assessment help the team decide what needs further investigation or adjustment, with the service record preserving the conditions under which the measurements were taken. [6, 7]
- Commercial applications accounted for 30.0% of revenue in 2025. [1]
- DOE guidance includes commissioning work on both new and existing HVAC installations. [6]
What supports handheld configurations?
A handheld instrument allows a technician to take the measurement setup to the equipment. The full kit may include probes, hoses and a device used to store or view results. PCE’s HVAC 2 provides a portable example covering airflow and pressure-related measurements, while wireless probe systems can separate the sensor from the display. Buyers need to consider the task, access to the measurement point and the practical arrangement used during a service visit. Portability is valuable when it supports a usable and repeatable setup. [4, 9]
- Handheld configurations held 55.0% of revenue in 2025. [1]
- PCE documents air speed, pressure, airflow, differential pressure and temperature measurement for HVAC 2. [9]
How do refrigerant manifolds shape the offer?
A refrigerant manifold supports pressure and temperature assessment within the refrigeration circuit. Suppliers provide different port arrangements, supported refrigerants, probes and record functions. Mastercool’s Spartan range includes wireless connectivity, and ROTHENBERGER’s ROCOOL 600 has a modular measuring arrangement. The technician needs the correct product and accessories for the system being serviced. Purchasing decisions therefore include compatibility, connections and service support alongside display functions. The buyer also needs to understand which measurements are integrated and which require an additional probe or component. [5, 10]
- Manifolds provide a distinct refrigeration-system diagnostic capability within the broader market.
- Mastercool documents app-enabled wireless functions for its Spartan manifold range. [5]
What creates demand for stationary monitoring?
Stationary refrigeration leak detection provides information from a fixed location or connected sampling points. MSA Bacharach’s X30 and X50 monitor refrigerants, while its wider portfolio includes multi-zone systems. The operator specifies what is monitored and how readings or alerts feed into the response procedure. Placement, configuration and connections with other systems make installation part of the purchasing requirement. [7]
- Stationary units form a separate configuration category. [1]
- MSA introduced the Bacharach X30 and X50 refrigerant-monitoring offer in February 2026. [7]
What drives and constrains analyzer demand?
Commissioning, maintenance and operating-condition checks support demand; task-specific compatibility and measurement setup constrain selection; connected service records create opportunities.
- Driver: HVAC service teams need readings to assess equipment and system conditions.
- Restraint: Sensors, accessories and supported measurement ranges must fit the task.
- Opportunity: Connected instruments can help teams record and share service information.
Commissioning and maintenance create repeated occasions to examine HVAC performance. DOE guidance connects effective operation with suitable design, installation and continuing assessment, including checks on HVAC control systems. Contractors and facility teams need instruments for their work, from airflow checks to refrigeration-circuit diagnostics. The tool purchase can also require accessories and continuing service support. Suppliers compete through measuring arrangements that fit the customer’s service procedure. [6, 11]
Restraint. An instrument may combine several functions while still requiring a specific sensor or connection for a particular task. Buyers need to check ranges, supported refrigerants, accessories and service requirements before standardizing a tool across a team. Calibration and instrument care also affect continued use. Testo provides calibration and service arrangements, while Mastercool publishes technical-assistance material for its equipment. These support capabilities matter when the customer needs to maintain a usable tool set across repeated service visits. [12, 13]
Fieldpiece’s Job Link connections and Mastercool’s app-enabled manifolds help technicians record measurements against a job. The readings need to retain their equipment and measurement context so a supervisor can interpret them. Compatible probes, display functions and reporting tools support this transfer from field work to the service record. [4, 5]
How do country opportunities compare?
The geographic comparison examines service and building-performance conditions over the 2026 to 2036 outlook.
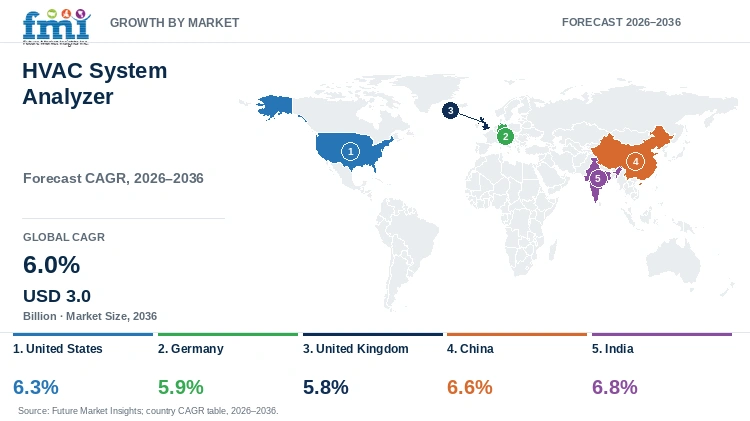
| Market | Commercial Context |
|---|---|
| United States | Commissioning, maintenance and a broad diagnostic-tool portfolio |
| Germany | Building-performance priorities and professional measuring instruments |
| United Kingdom | Heat-pump training and installation-service requirements |
| China | Building energy-efficiency and retrofit programs |
| India | Commercial and residential building-energy programs |
What shapes geographic demand?
Analyzer purchasing follows the HVAC equipment and service work within each market. North American contractors and facility teams use tools across commissioning and regular maintenance. European building-performance programs provide a context for examining heating and cooling operation, while China and India address building energy efficiency through their own programs. These settings create different purchasing tasks for contractors and owners. Suppliers need to connect their local offer with equipment compatibility, technician support and the records required by the customer. [6, 14, 15, 16, 17]
United States: Contractors and facility teams need task-specific diagnostic instruments. Germany: Building-performance assessment connects with field measurement and service support. United Kingdom: Heat-pump training provides a context for installer skills and measuring practice. China: Retrofit and building-efficiency work create an operating-assessment context. India: Building-energy programs support attention to HVAC performance.
Country-wise Analysis
United States
U.S. demand involves contractors, facility operators and service teams working across different HVAC installations. DOE guidance describes commissioning as a process applied to both new and existing systems. Fluke, Fieldpiece and Mastercool provide examples of tools used for airflow or refrigeration-system assessment. The buyer needs to distinguish those tasks and equip the team accordingly. A contractor standardizing instruments should consider the supported measurements, available accessories and the way results enter the service record. An owner selecting fixed monitoring has a different purchasing requirement, including installation and response arrangements. [2, 4, 5, 6]
Germany
Germany’s profile sits within the European building-performance framework. The European Commission’s guidance on the Energy Performance of Buildings Directive addresses improvements to building efficiency, providing a wider context for examining heating and cooling operation. Measuring instruments support the practical assessment carried out by contractors and facility teams. Testo’s digital manifold and service offer illustrate product and support capabilities relevant to that work. Buyers need to select the instrument around the system being examined and maintain the measuring setup through appropriate care and service arrangements. [3, 12, 14]
United Kingdom
The United Kingdom’s Heat Training Grant supports discounted heat-pump training. Installers and service technicians need to understand the readings required during commissioning or diagnosis and select compatible probes and instruments. Suppliers support contractors through product information and service access. Demand for analyzers follows the measurement work performed during installation and maintenance. [15]
China
China’s 2025 carbon-peaking and carbon-neutrality white paper describes energy-saving retrofit activity in existing urban buildings. This provides context for assessing building systems and their operation. HVAC analyzers can support measurement during service and performance checks, with the installation determining the instruments required. A buyer serving several equipment types needs to assess compatibility and the practical work carried out by technicians. Product documentation, local availability and support can influence how consistently a service team uses its selected tool set across installations and follow-up visits. [16]
India
India’s Bureau of Energy Efficiency provides commercial-building and residential-building programs addressing energy performance. HVAC equipment forms part of the building-services context in which contractors and owners assess operation. The analyzer buyer needs to establish the measurements required and the conditions in which technicians work. A service firm may need portable tools for several installations, while a facility owner may combine field assessment with installed monitoring. Suppliers can support those buyers through suitable configurations, accessory availability and understandable documentation that connects readings with the equipment being examined. [17]
Who supplies HVAC diagnostic instruments?
Suppliers include Fluke, Testo, Fieldpiece, Mastercool, PCE Instruments, MSA Bacharach, ROTHENBERGER and YELLOW JACKET.
Fluke and PCE provide airflow and related instruments; Testo, Fieldpiece, Mastercool and ROTHENBERGER offer digital manifolds. YELLOW JACKET supplies wireless probes and TITANMAX manifolds, while MSA Bacharach provides refrigerant monitors. Belimo’s thermal-energy metering is embedded within hydronic systems. These products serve different measurement tasks, from portable assessment to fixed monitoring and installed energy measurement. [2, 3, 4, 5, 7, 8, 9, 10, 18]
- Portable and airflow measurement: Fluke, PCE Instruments and relevant Testo instruments.
- Refrigeration-system diagnostics: Fieldpiece, Mastercool, ROTHENBERGER and YELLOW JACKET.
- Installed refrigerant monitoring: MSA Bacharach.
Competitive Benchmarking: HVAC System Analyzer Market
| Supplier | Supplier Role | Product or Capability | Service Task | Configuration Context |
|---|---|---|---|---|
| Fluke | Airflow measurement | 922 airflow meter / micromanometer | Airflow and pressure assessment | Portable instrument |
| Testo | Refrigeration measurement | 558s digital manifold | Pressure and temperature diagnosis | Portable manifold |
| Fieldpiece | HVAC/R diagnostics | SM382V and SM482V SMAN | Refrigerant-system measurement | Wireless-tool connections |
| Mastercool | Refrigeration service instruments | Spartan smart manifold | Pressure and temperature assessment | App-enabled manifold |
| PCE Instruments | HVAC measurement | HVAC 2 | Airflow, pressure and temperature | Portable instrument |
| MSA Bacharach | Refrigerant monitoring | X30 and X50 | Installed refrigerant monitoring | Stationary monitoring |
| ROTHENBERGER | Refrigeration measuring tools | ROCOOL 600 | Modular system measurement | Portable manifold |
| YELLOW JACKET | HVAC/R service tools | YJACK probes and TITANMAX | Refrigerant and related readings | Wireless probes and manifolds |
Key Developments in HVAC System Analysis
- MSA introduced the Bacharach X30 and X50 refrigerant-monitoring offer in February 2026, addressing flexible configurations for HVAC/R applications. [7]
- Mastercool’s 2025 HVAC/R presentation documents digital manifolds and connected service instruments within its portfolio. [19]
- YELLOW JACKET publishes an A2L-compatible service-tool guide dated May 2025, while its current product page identifies wireless probes and current manifold options. [18]
Key Players in HVAC System Analysis
- Fluke Corporation
- Testo
- Fieldpiece Instruments
- Mastercool Inc.
- PCE Instruments
- MSA Safety / Bacharach
- ROTHENBERGER
- YELLOW JACKET / Ritchie Engineering
Related Embedded Measurement
- Belimo: Thermal energy metering and hydronic control. [8]
HVAC System Analyzer Market - Report Scope
| Coverage Field | Report Scope |
|---|---|
| Market Breakdown | Output Display; Application; Configuration |
| Quantitative Units | Revenue in USD billion |
| Market Definition | Instruments and connected measuring arrangements used to assess HVAC and refrigeration operating conditions, including airflow, temperature, pressure, humidity and refrigerant-related diagnostics. |
| Exclusions | Complete HVAC equipment; general building construction; maintenance labour; unrelated industrial analyzers; standalone control valves without covered diagnostic functions. |
| Regions Covered | North America; Latin America; Western Europe; Eastern Europe; East Asia; South Asia and Pacific; Middle East and Africa |
| Country Profiles | United States; Germany; United Kingdom; China; India |
| Competitive Coverage | Portable diagnostic instruments, manifolds, wireless probes and installed refrigerant monitoring |
| 2025 Market Value | USD 1.6 billion |
| 2026 Market Value | Estimated at USD 1.7 billion |
| 2036 Forecast Value | USD 3.0 billion |
| CAGR | 6.0% |
| Forecast Period | 2026 to 2036 |
| Historical Segment Shares (2025) | Digital 58.0%; Commercial 30.0%; Handheld 55.0% |
HVAC System Analyzer Market - Research Framework
| Research Area | Coverage |
|---|---|
| Market Coverage | HVAC operating-condition measurement and diagnostics |
| Industry Evidence | Manufacturer documentation, product announcements and building-performance guidance |
| Geographic Analysis | Commissioning, maintenance, training and building-energy programs |
| Competitive Analysis | Measurement function, configuration, compatibility and service support |
HVAC System Analyzer Market by Segments
HVAC System Analyzer Market segmented by Output Display:
- Digital
- Analog
HVAC System Analyzer Market segmented by Application:
- Commercial
- Industrial
- Residential
- Automotive & Transportation
- Others
HVAC System Analyzer Market segmented by Configuration:
- Handheld
- Mobile Units
- Stationary Units
HVAC System Analyzer Market by Region
- North America
- United States
- Canada
- Latin America
- Brazil
- Mexico
- Rest of Latin America
- Western Europe
- Germany
- Italy
- France
- United Kingdom
- Spain
- Benelux
- Rest of Western Europe
- Eastern Europe
- Russia
- Rest of Eastern Europe
- East Asia
- China
- Japan
- South Korea
- South Asia and Pacific
- India
- ASEAN
- Australia and New Zealand
- Rest of South Asia and Pacific
- Middle East and Africa
- GCC Countries
- Türkiye
- North Africa
- South Africa
- Rest of Middle East and Africa
Research Sources and Bibliography
- [1] Future Market Insights. HVAC System Analyzer Market.
- [2] Fluke. 922 Airflow Meter and Micromanometer.
- [3] Testo. 558s digital manifold.
- [4] Fieldpiece. SM382V wireless refrigerant manifold.
- [5] Mastercool. Spartan Four-way Smart Manifold.
- [6] U.S. Department of Energy. HVAC commissioning.
- [7] MSA (2026, February 12). X30 and X50 refrigerant monitors.
- [8] Belimo. Energy Valve and Thermal Energy Meter.
- [9] PCE Instruments. Multifunction HVAC Meter PCE-HVAC 2.
- ROTHENBERGER. ROCOOL 600 Digital Measuring Arrangement.
- U.S. Department of Energy. HVAC Design and Implementation Guidance.
- Testo. Service and Calibration.
- Mastercool. Technical Assistance.
- European Commission. Energy Performance of Buildings Directive.
- [15] UK Government. Heat Training Grant for Heat Pumps.
- [16] State Council Information Office of China (2025, November). Carbon Peaking and Carbon Neutrality: Plans and Solutions.
- [17] Bureau of Energy Efficiency, India. Energy efficiency in buildings.
- [18] YELLOW JACKET. A2L-compatible Service Tools and Current Product Guide.
- [19] Mastercool. 2025 HVAC/R Product Presentation.
This Report Answers
- What was the HVAC system analyzer market value in 2025?
- How large is the estimated market in 2026 and what is forecast for 2036?
- Which display, application and configuration segments led in 2025?
- How do airflow instruments and refrigerant manifolds differ?
- What creates demand for stationary monitoring?
- Which country service conditions are profiled?
- Which suppliers provide documented HVAC diagnostic capabilities?
- How do compatibility and service records influence purchasing?
Table of Content
Table of Content
- Key Takeaways
- Market Size and CAGR
- Top Growth Driver
- Fastest Growing Segment
- Leading Region
- Key Companies
- Emerging Opportunities
- Executive Summary
- Global Market Outlook
- Demand-side Trends
- Supply-side Trends
- Technology Roadmap Analysis
- Analysis and Recommendations
- Analyst Perspective (What is happening? Why now? What should investors know?)
- Key Questions Answered
- How large is the market?
- What is the CAGR?
- What are key trends?
- Which region dominates?
- Who are the leaders?
Read More...
- Market Overview
- Market Coverage / Taxonomy
- Market Definition / Scope / Limitations
- Research Methodology
- Chapter Orientation
- Analytical Lens and Working Hypotheses
- Market Structure, Signals, and Trend Drivers
- Benchmarking and Cross-market Comparability
- Market Sizing, Forecasting, and Opportunity Mapping
- Research Design and Evidence Framework
- Desk Research Programme (Secondary Evidence)
- Expert Input and Fieldwork (Primary Evidence)
- Tooling, Models, and Reference Databases
- Data Engineering and Model Build
- Quality Assurance and Audit Trail
- Market Background
- Market Dynamics (Drivers, Restraints, Opportunity, Trends)
- Scenario Forecast (Optimistic, Likely, Conservative)
- Impact Analysis
- AI Impact
- Sustainability Impact
- Regulatory Impact
- Technology Impact
- Consumer / Buyer Analysis
- Purchase Drivers
- Adoption Barriers
- Buyer Journey
- Opportunity Map Analysis
- Product Life Cycle Analysis
- Supply Chain Analysis
- Investment Feasibility Matrix
- Value Chain Analysis
- PESTLE and Porter's Analysis
- Regulatory Landscape
- Regional Parent Market Outlook
- Production and Consumption Statistics
- Import and Export Statistics
- Global Market Analysis and Forecast, 2021 to 2036
- Historical Market Size Value (USD Billion) Analysis, 2021 to 2025
- Current and Future Market Size Value (USD Billion) Projections, 2026 to 2036
- Y-o-Y Growth Trend Analysis
- Absolute $ Opportunity Analysis
- Global Market Pricing Analysis, 2021 to 2036
- Global Market Analysis and Forecast, By Output Display, 2021 to 2036
- Introduction / Key Findings
- Historical Market Size Value (USD Billion) Analysis By Output Display, 2021 to 2025
- Current and Future Market Size Value (USD Billion) Analysis and Forecast By Output Display, 2026 to 2036
- Digital
- Analog
- Y-o-Y Growth Trend Analysis By Output Display, 2021 to 2025
- Absolute $ Opportunity Analysis By Output Display, 2026 to 2036
- Global Market Analysis and Forecast, By Application, 2021 to 2036
- Introduction / Key Findings
- Historical Market Size Value (USD Billion) Analysis By Application, 2021 to 2025
- Current and Future Market Size Value (USD Billion) Analysis and Forecast By Application, 2026 to 2036
- Commercial
- Industrial
- Residential
- Automotive & Transportation
- Others
- Y-o-Y Growth Trend Analysis By Application, 2021 to 2025
- Absolute $ Opportunity Analysis By Application, 2026 to 2036
- Global Market Analysis and Forecast, By Configuration, 2021 to 2036
- Introduction / Key Findings
- Historical Market Size Value (USD Billion) Analysis By Configuration, 2021 to 2025
- Current and Future Market Size Value (USD Billion) Analysis and Forecast By Configuration, 2026 to 2036
- Handheld
- Mobile Units
- Stationary Units
- Y-o-Y Growth Trend Analysis By Configuration, 2021 to 2025
- Absolute $ Opportunity Analysis By Configuration, 2026 to 2036
- Global Market Analysis and Forecast, By Region, 2021 to 2036
- Introduction
- Historical Market Size Value (USD Billion) Analysis By Region, 2021 to 2025
- Current Market Size Value (USD Billion) Analysis and Forecast By Region, 2026 to 2036
- North America
- Latin America
- Western Europe
- Eastern Europe
- East Asia
- South Asia and Pacific
- Middle East and Africa
- Market Attractiveness Analysis By Region
- North America Market Analysis and Forecast, By Country, 2021 to 2036
- Historical Market Size Value (USD Billion) Trend Analysis By Market Taxonomy, 2021 to 2025
- Market Size Value (USD Billion) Forecast By Market Taxonomy, 2026 to 2036
- By Country
- United States
- Canada
- By Output Display
- By Application
- By Configuration
- By Country
- Market Attractiveness Analysis
- By Country
- By Output Display
- By Application
- By Configuration
- Key Takeaways
- Latin America Market Analysis and Forecast, By Country
- Historical Market Size Value (USD Billion) Trend Analysis By Market Taxonomy, 2021 to 2025
- Market Size Value (USD Billion) Forecast By Market Taxonomy, 2026 to 2036
- By Country
- Brazil
- Mexico
- Rest of Latin America
- By Output Display
- By Application
- By Configuration
- By Country
- Market Attractiveness Analysis
- By Country
- By Output Display
- By Application
- By Configuration
- Key Takeaways
- Western Europe Market Analysis and Forecast, By Country
- Historical Market Size Value (USD Billion) Trend Analysis By Market Taxonomy, 2021 to 2025
- Market Size Value (USD Billion) Forecast By Market Taxonomy, 2026 to 2036
- By Country
- Germany
- Italy
- France
- United Kingdom
- Spain
- Benelux
- Rest of Western Europe
- By Output Display
- By Application
- By Configuration
- By Country
- Market Attractiveness Analysis
- By Country
- By Output Display
- By Application
- By Configuration
- Key Takeaways
- Eastern Europe Market Analysis and Forecast, By Country
- Historical Market Size Value (USD Billion) Trend Analysis By Market Taxonomy, 2021 to 2025
- Market Size Value (USD Billion) Forecast By Market Taxonomy, 2026 to 2036
- By Country
- Russia
- Rest of Eastern Europe
- By Output Display
- By Application
- By Configuration
- By Country
- Market Attractiveness Analysis
- By Country
- By Output Display
- By Application
- By Configuration
- Key Takeaways
- East Asia Market Analysis and Forecast, By Country
- Historical Market Size Value (USD Billion) Trend Analysis By Market Taxonomy, 2021 to 2025
- Market Size Value (USD Billion) Forecast By Market Taxonomy, 2026 to 2036
- By Country
- China
- Japan
- South Korea
- By Output Display
- By Application
- By Configuration
- By Country
- Market Attractiveness Analysis
- By Country
- By Output Display
- By Application
- By Configuration
- Key Takeaways
- South Asia and Pacific Market Analysis and Forecast, By Country
- Historical Market Size Value (USD Billion) Trend Analysis By Market Taxonomy, 2021 to 2025
- Market Size Value (USD Billion) Forecast By Market Taxonomy, 2026 to 2036
- By Country
- India
- ASEAN
- Australia and New Zealand
- Rest of South Asia and Pacific
- By Output Display
- By Application
- By Configuration
- By Country
- Market Attractiveness Analysis
- By Country
- By Output Display
- By Application
- By Configuration
- Key Takeaways
- Middle East and Africa Market Analysis and Forecast, By Country
- Historical Market Size Value (USD Billion) Trend Analysis By Market Taxonomy, 2021 to 2025
- Market Size Value (USD Billion) Forecast By Market Taxonomy, 2026 to 2036
- By Country
- GCC Countries
- Türkiye
- North Africa
- South Africa
- Rest of Middle East and Africa
- By Output Display
- By Application
- By Configuration
- By Country
- Market Attractiveness Analysis
- By Country
- By Output Display
- By Application
- By Configuration
- Key Takeaways
- Key Countries Market Analysis
- United States
- Pricing Analysis
- Market Share Analysis, 2025
- By Output Display
- By Application
- By Configuration
- Canada
- Pricing Analysis
- Market Share Analysis, 2025
- By Output Display
- By Application
- By Configuration
- Mexico
- Pricing Analysis
- Market Share Analysis, 2025
- By Output Display
- By Application
- By Configuration
- Brazil
- Pricing Analysis
- Market Share Analysis, 2025
- By Output Display
- By Application
- By Configuration
- Germany
- Pricing Analysis
- Market Share Analysis, 2025
- By Output Display
- By Application
- By Configuration
- United Kingdom
- Pricing Analysis
- Market Share Analysis, 2025
- By Output Display
- By Application
- By Configuration
- Italy
- Pricing Analysis
- Market Share Analysis, 2025
- By Output Display
- By Application
- By Configuration
- Spain
- Pricing Analysis
- Market Share Analysis, 2025
- By Output Display
- By Application
- By Configuration
- France
- Pricing Analysis
- Market Share Analysis, 2025
- By Output Display
- By Application
- By Configuration
- India
- Pricing Analysis
- Market Share Analysis, 2025
- By Output Display
- By Application
- By Configuration
- ASEAN
- Pricing Analysis
- Market Share Analysis, 2025
- By Output Display
- By Application
- By Configuration
- Australia and New Zealand
- Pricing Analysis
- Market Share Analysis, 2025
- By Output Display
- By Application
- By Configuration
- China
- Pricing Analysis
- Market Share Analysis, 2025
- By Output Display
- By Application
- By Configuration
- Japan
- Pricing Analysis
- Market Share Analysis, 2025
- By Output Display
- By Application
- By Configuration
- South Korea
- Pricing Analysis
- Market Share Analysis, 2025
- By Output Display
- By Application
- By Configuration
- Russia
- Pricing Analysis
- Market Share Analysis, 2025
- By Output Display
- By Application
- By Configuration
- Türkiye
- Pricing Analysis
- Market Share Analysis, 2025
- By Output Display
- By Application
- By Configuration
- South Africa
- Pricing Analysis
- Market Share Analysis, 2025
- By Output Display
- By Application
- By Configuration
- United States
- Market Structure Analysis
- Competition Dashboard
- Competition Benchmarking
- Market Share Analysis of Top Players
- By Regional
- By Output Display
- By Application
- By Configuration
- Emerging Startups
- Innovation Benchmarking
- Competition Analysis
- Competition Deep Dive
- Fluke
- Overview
- Product Portfolio
- Profitability by Market Segments
- Sales Footprint
- Strategy Overview
- Marketing Strategy
- Product Strategy
- Channel Strategy
- Testo
- Fieldpiece
- Mastercool
- PCE Instruments
- MSA Bacharach
- ROTHENBERGER
- YELLOW JACKET
- Fluke Corporation
- Fieldpiece Instruments
- MSA Safety / Bacharach
- YELLOW JACKET / Ritchie Engineering
- Belimo: Thermal energy metering and hydronic control. [8]
- Fluke
- Case Studies
- Success Stories
- Recent Developments
- Competition Deep Dive
- Assumptions & Acronyms Used
List of Tables
- Table 1: Global Market Value (USD Billion) Forecast by Region, 2021 to 2036
- Table 2: Global Market Value (USD Billion) Forecast by Output Display, 2021 to 2036
- Table 3: Global Market Value (USD Billion) Forecast by Application, 2021 to 2036
- Table 4: Global Market Value (USD Billion) Forecast by Configuration, 2021 to 2036
- Table 5: North America Market Value (USD Billion) Forecast by Country, 2021 to 2036
- Table 6: North America Market Value (USD Billion) Forecast by Output Display, 2021 to 2036
- Table 7: North America Market Value (USD Billion) Forecast by Application, 2021 to 2036
- Table 8: North America Market Value (USD Billion) Forecast by Configuration, 2021 to 2036
- Table 9: Latin America Market Value (USD Billion) Forecast by Country, 2021 to 2036
- Table 10: Latin America Market Value (USD Billion) Forecast by Output Display, 2021 to 2036
- Table 11: Latin America Market Value (USD Billion) Forecast by Application, 2021 to 2036
- Table 12: Latin America Market Value (USD Billion) Forecast by Configuration, 2021 to 2036
- Table 13: Western Europe Market Value (USD Billion) Forecast by Country, 2021 to 2036
- Table 14: Western Europe Market Value (USD Billion) Forecast by Output Display, 2021 to 2036
- Table 15: Western Europe Market Value (USD Billion) Forecast by Application, 2021 to 2036
- Table 16: Western Europe Market Value (USD Billion) Forecast by Configuration, 2021 to 2036
- Table 17: Eastern Europe Market Value (USD Billion) Forecast by Country, 2021 to 2036
- Table 18: Eastern Europe Market Value (USD Billion) Forecast by Output Display, 2021 to 2036
- Table 19: Eastern Europe Market Value (USD Billion) Forecast by Application, 2021 to 2036
- Table 20: Eastern Europe Market Value (USD Billion) Forecast by Configuration, 2021 to 2036
- Table 21: East Asia Market Value (USD Billion) Forecast by Country, 2021 to 2036
- Table 22: East Asia Market Value (USD Billion) Forecast by Output Display, 2021 to 2036
- Table 23: East Asia Market Value (USD Billion) Forecast by Application, 2021 to 2036
- Table 24: East Asia Market Value (USD Billion) Forecast by Configuration, 2021 to 2036
- Table 25: South Asia and Pacific Market Value (USD Billion) Forecast by Country, 2021 to 2036
- Table 26: South Asia and Pacific Market Value (USD Billion) Forecast by Output Display, 2021 to 2036
- Table 27: South Asia and Pacific Market Value (USD Billion) Forecast by Application, 2021 to 2036
- Table 28: South Asia and Pacific Market Value (USD Billion) Forecast by Configuration, 2021 to 2036
- Table 29: Middle East and Africa Market Value (USD Billion) Forecast by Country, 2021 to 2036
- Table 30: Middle East and Africa Market Value (USD Billion) Forecast by Output Display, 2021 to 2036
- Table 31: Middle East and Africa Market Value (USD Billion) Forecast by Application, 2021 to 2036
- Table 32: Middle East and Africa Market Value (USD Billion) Forecast by Configuration, 2021 to 2036
List of Figures
- Figure 1: Global Market Pricing Analysis
- Figure 2: Global Market Value (USD Billion) Forecast 2021-2036
- Figure 3: Global Market Value Share and BPS Analysis by Output Display, 2026 and 2036
- Figure 4: Global Market Y-o-Y Growth Comparison by Output Display, 2026-2036
- Figure 5: Global Market Attractiveness Analysis by Output Display
- Figure 6: Global Market Value Share and BPS Analysis by Application, 2026 and 2036
- Figure 7: Global Market Y-o-Y Growth Comparison by Application, 2026-2036
- Figure 8: Global Market Attractiveness Analysis by Application
- Figure 9: Global Market Value Share and BPS Analysis by Configuration, 2026 and 2036
- Figure 10: Global Market Y-o-Y Growth Comparison by Configuration, 2026-2036
- Figure 11: Global Market Attractiveness Analysis by Configuration
- Figure 12: Global Market Value (USD Billion) Share and BPS Analysis by Region, 2026 and 2036
- Figure 13: Global Market Y-o-Y Growth Comparison by Region, 2026-2036
- Figure 14: Global Market Attractiveness Analysis by Region
- Figure 15: North America Market Incremental Dollar Opportunity, 2026-2036
- Figure 16: Latin America Market Incremental Dollar Opportunity, 2026-2036
- Figure 17: Western Europe Market Incremental Dollar Opportunity, 2026-2036
- Figure 18: Eastern Europe Market Incremental Dollar Opportunity, 2026-2036
- Figure 19: East Asia Market Incremental Dollar Opportunity, 2026-2036
- Figure 20: South Asia and Pacific Market Incremental Dollar Opportunity, 2026-2036
- Figure 21: Middle East and Africa Market Incremental Dollar Opportunity, 2026-2036
- Figure 22: North America Market Value Share and BPS Analysis by Country, 2026 and 2036
- Figure 23: North America Market Value Share and BPS Analysis by Output Display, 2026 and 2036
- Figure 24: North America Market Y-o-Y Growth Comparison by Output Display, 2026-2036
- Figure 25: North America Market Attractiveness Analysis by Output Display
- Figure 26: North America Market Value Share and BPS Analysis by Application, 2026 and 2036
- Figure 27: North America Market Y-o-Y Growth Comparison by Application, 2026-2036
- Figure 28: North America Market Attractiveness Analysis by Application
- Figure 29: North America Market Value Share and BPS Analysis by Configuration, 2026 and 2036
- Figure 30: North America Market Y-o-Y Growth Comparison by Configuration, 2026-2036
- Figure 31: North America Market Attractiveness Analysis by Configuration
- Figure 32: Latin America Market Value Share and BPS Analysis by Country, 2026 and 2036
- Figure 33: Latin America Market Value Share and BPS Analysis by Output Display, 2026 and 2036
- Figure 34: Latin America Market Y-o-Y Growth Comparison by Output Display, 2026-2036
- Figure 35: Latin America Market Attractiveness Analysis by Output Display
- Figure 36: Latin America Market Value Share and BPS Analysis by Application, 2026 and 2036
- Figure 37: Latin America Market Y-o-Y Growth Comparison by Application, 2026-2036
- Figure 38: Latin America Market Attractiveness Analysis by Application
- Figure 39: Latin America Market Value Share and BPS Analysis by Configuration, 2026 and 2036
- Figure 40: Latin America Market Y-o-Y Growth Comparison by Configuration, 2026-2036
- Figure 41: Latin America Market Attractiveness Analysis by Configuration
- Figure 42: Western Europe Market Value Share and BPS Analysis by Country, 2026 and 2036
- Figure 43: Western Europe Market Value Share and BPS Analysis by Output Display, 2026 and 2036
- Figure 44: Western Europe Market Y-o-Y Growth Comparison by Output Display, 2026-2036
- Figure 45: Western Europe Market Attractiveness Analysis by Output Display
- Figure 46: Western Europe Market Value Share and BPS Analysis by Application, 2026 and 2036
- Figure 47: Western Europe Market Y-o-Y Growth Comparison by Application, 2026-2036
- Figure 48: Western Europe Market Attractiveness Analysis by Application
- Figure 49: Western Europe Market Value Share and BPS Analysis by Configuration, 2026 and 2036
- Figure 50: Western Europe Market Y-o-Y Growth Comparison by Configuration, 2026-2036
- Figure 51: Western Europe Market Attractiveness Analysis by Configuration
- Figure 52: Eastern Europe Market Value Share and BPS Analysis by Country, 2026 and 2036
- Figure 53: Eastern Europe Market Value Share and BPS Analysis by Output Display, 2026 and 2036
- Figure 54: Eastern Europe Market Y-o-Y Growth Comparison by Output Display, 2026-2036
- Figure 55: Eastern Europe Market Attractiveness Analysis by Output Display
- Figure 56: Eastern Europe Market Value Share and BPS Analysis by Application, 2026 and 2036
- Figure 57: Eastern Europe Market Y-o-Y Growth Comparison by Application, 2026-2036
- Figure 58: Eastern Europe Market Attractiveness Analysis by Application
- Figure 59: Eastern Europe Market Value Share and BPS Analysis by Configuration, 2026 and 2036
- Figure 60: Eastern Europe Market Y-o-Y Growth Comparison by Configuration, 2026-2036
- Figure 61: Eastern Europe Market Attractiveness Analysis by Configuration
- Figure 62: East Asia Market Value Share and BPS Analysis by Country, 2026 and 2036
- Figure 63: East Asia Market Value Share and BPS Analysis by Output Display, 2026 and 2036
- Figure 64: East Asia Market Y-o-Y Growth Comparison by Output Display, 2026-2036
- Figure 65: East Asia Market Attractiveness Analysis by Output Display
- Figure 66: East Asia Market Value Share and BPS Analysis by Application, 2026 and 2036
- Figure 67: East Asia Market Y-o-Y Growth Comparison by Application, 2026-2036
- Figure 68: East Asia Market Attractiveness Analysis by Application
- Figure 69: East Asia Market Value Share and BPS Analysis by Configuration, 2026 and 2036
- Figure 70: East Asia Market Y-o-Y Growth Comparison by Configuration, 2026-2036
- Figure 71: East Asia Market Attractiveness Analysis by Configuration
- Figure 72: South Asia and Pacific Market Value Share and BPS Analysis by Country, 2026 and 2036
- Figure 73: South Asia and Pacific Market Value Share and BPS Analysis by Output Display, 2026 and 2036
- Figure 74: South Asia and Pacific Market Y-o-Y Growth Comparison by Output Display, 2026-2036
- Figure 75: South Asia and Pacific Market Attractiveness Analysis by Output Display
- Figure 76: South Asia and Pacific Market Value Share and BPS Analysis by Application, 2026 and 2036
- Figure 77: South Asia and Pacific Market Y-o-Y Growth Comparison by Application, 2026-2036
- Figure 78: South Asia and Pacific Market Attractiveness Analysis by Application
- Figure 79: South Asia and Pacific Market Value Share and BPS Analysis by Configuration, 2026 and 2036
- Figure 80: South Asia and Pacific Market Y-o-Y Growth Comparison by Configuration, 2026-2036
- Figure 81: South Asia and Pacific Market Attractiveness Analysis by Configuration
- Figure 82: Middle East and Africa Market Value Share and BPS Analysis by Country, 2026 and 2036
- Figure 83: Middle East and Africa Market Value Share and BPS Analysis by Output Display, 2026 and 2036
- Figure 84: Middle East and Africa Market Y-o-Y Growth Comparison by Output Display, 2026-2036
- Figure 85: Middle East and Africa Market Attractiveness Analysis by Output Display
- Figure 86: Middle East and Africa Market Value Share and BPS Analysis by Application, 2026 and 2036
- Figure 87: Middle East and Africa Market Y-o-Y Growth Comparison by Application, 2026-2036
- Figure 88: Middle East and Africa Market Attractiveness Analysis by Application
- Figure 89: Middle East and Africa Market Value Share and BPS Analysis by Configuration, 2026 and 2036
- Figure 90: Middle East and Africa Market Y-o-Y Growth Comparison by Configuration, 2026-2036
- Figure 91: Middle East and Africa Market Attractiveness Analysis by Configuration
- Figure 92: Global Market - Tier Structure Analysis
- Figure 93: Global Market - Company Share Analysis
Frequently Asked Questions
How big is the HVAC system analyzer market in 2026?
The market is estimated at USD 1.7 billion in 2026, following USD 1.6 billion in 2025. [1]
What is the market forecast for 2036?
The market is forecast at USD 3.0 billion by 2036 at 6.0% CAGR over 2026 to 2036. [1]
Which output-display segment led in 2025?
Digital output displays held 58.0% of revenue in 2025. [1]
Which application led in 2025?
Commercial applications accounted for 30.0% of revenue in 2025. [1]
Which configuration led in 2025?
Handheld instruments held 55.0% of revenue in 2025. [1]
Which configurations are covered?
The taxonomy includes handheld, mobile and stationary units.
Preview the report firsthand - request a free sample
Get SampleGet the brochure for pricing and purchase details.
Get PDF
