Brake System Market Size and Share Forecast Outlook From 2024 to 2034

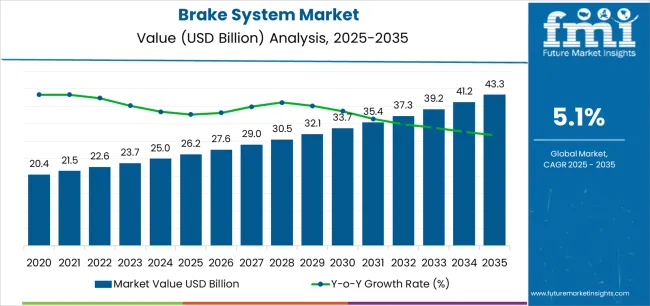
The global Brake System Market is expected to rise from USD 24.9 billion in 2024 to USD 42.3 billion by 2034. The market is projected to surge at a 5.4% CAGR by 2034.

Attributes Key Insights
Estimated Global Brake System Market Size (2024E) USD 24.9 billion
Projected Brake System Market Value (2034F) USD 42.3 billion
Value-based CAGR (2024 to 2034) 5.4%

Sales Trend Analysis from 2019 to 2023 Compared to Market Outlook for 2024 to 2034

  • The brake system market is expected to rise as a result of the high demand for passive and active safety features in automobiles.
  • Factors such as strict safety standards, adoption of luxury automobiles, and increasing use of disc brakes in commercial vehicles are expected to propel the market growth.
  • The lifespan of brake components is restricted to a specific number of kilometers, boosting the replacement market.
  • Considerable growth in the demand for passenger and commercial cars worldwide is anticipated to drive up demand for brake systems.
  • Throughout the projected period, market participants are expected to launch new technologies through research & development and introduce better systems, contributing to market growth.
  • The demand for car brake systems is expected to expand because of the strict safety regulations governments and regulatory bodies have implemented. For instance, the United States Department of Transportation's National Highway Traffic Safety Administration (NHTSA) planned to mandate automatic emergency braking in cars.

Top Market Dynamics and Industry Trends in the Brake System Sector

The global brake system sales grew at a CAGR of 7.1% from 2019 to 2023. The growth of brake systems from 2019 to 2023 can be attributed to a convergence of factors:

  • Regenerative brakes were gaining traction in the market as electric cars (EVs) became more common.
  • By capturing and storing energy during braking, this technique increases energy efficiency and the driving range of electric vehicles.
  • Using lightweight materials in brake components, including aluminum alloys and carbon composites, has risen. This development is consistent with the automotive industry's emphasis on reducing weight to increase fuel efficiency.
  • Advanced brake technologies played a key role in ADAS, which includes collision avoidance systems and automated emergency braking (AEB). Innovation in brake systems is still primarily driven by incorporating ADAS capabilities.

The brake system market is expected to surge at a CAGR of 5.4% by 2034.

  • Governments and regulatory agencies are enforcing strict safety laws, propelling the development of brake system innovations.
  • Manufacturers push advanced safety features into brake systems to comply with criteria like the New Car Assessment Program (NCAP).

Factors Restraining the Demand for Brake System Components

  • Electric and hybrid cars (EVs) are gaining traction in the automotive industry. These automobiles are equipped with regenerative brake systems, which harvest and store energy during braking. The desire for greater energy efficiency and less environmental effect drives this trend.
  • The incorporation of ADAS into automobiles is causing an advancement in braking technology.
  • Sophisticated brake technologies play a key role in improving car safety through features, including collision avoidance systems, adaptive cruise control, and automated emergency braking (AEB).
  • Brake systems are integrating electrical and sensor components to improve performance and control.
  • Anti-lock braking systems (ABS), traction control systems (TCS), and electronic stability control (ESC) are increasingly becoming standard equipment, improving handling and safety.

Analysis of Top Countries Manufacturing and Using Brake Systems

  • Uncertainties and economic changes, such as recessions or downturns, are set to affect consumer spending power and automobile sales.
  • Similar to several other industries, the brake system industry is vulnerable to supply chain interruptions.
  • Natural disasters, geopolitical unrest, or worldwide pandemics, such as the COVID-19 outbreak, are expected to cause supply chain disruptions that impact production schedules and result in shortages of essential components.
  • Developing, testing, and researching cutting-edge brake technology, particularly those for electric and driverless vehicles, is expensive.

Analysis of Top Countries Manufacturing, Regulating, and Adopting Brake Systems

The table below shows the estimated growth rates of the top five countries. The United Kingdom, South Korea, and Japan are set to record high CAGRs of 6.6%, 7.0%, and 6.9%, respectively, through 2034.

Countries Projected CAGR (2024 to 2034)
United States 5.7%
United Kingdom 6.6%
China 5.9%
South Korea 7.0%
Japan 6.9%

The table below explains the brake system market size of the leading five countries for 2034. Among them, the United States is anticipated to remain at the forefront by reaching a valuation of USD 7.6 billion. Japan is expected to reach around USD 4.7 billion by 2034, less than China's USD 6.6 billion.

Countries Market Values (2034)
United States USD 7.6 billion
United Kingdom USD 1.7 billion
China USD 6.6 billion
South Korea USD 2.7 billion
Japan USD 4.7 billion

Consumer Awareness Boosts Brake System Demand in the United States

The United States brake system industry is poised to exhibit a CAGR of 5.7% during the assessment period. By 2034, the United States market is expected to reach USD 7.6 billion. Key factors supporting the market growth are:

  • The National Highway Traffic Safety Administration (NHTSA) enforces strict safety regulations in the United States. Adherence to these standards greatly influences the characteristics and design of brake systems in cars sold nationwide.
  • There is an increasing demand for cars with sophisticated brake systems and other advanced safety features.
  • Automatic emergency braking (AEB), electronic stability control (ESC), and anti-lock braking systems (ABS) are increasingly being included as standard equipment in new cars.

Growing Demand for Electric and Hybrid Vehicles Propelling Demand in China

Brake system demand in China is anticipated to rise at a steady CAGR of 5.9% during the forecast period. This is attributable to a combination of factors, including:

  • Interest in electric and hybrid vehicles is growing in the automotive sector.
  • With their surging popularity, brake systems in cars are set to be more sophisticated than those in conventional vehicles, utilizing innovative technology like regenerative braking.
  • There is a sizable aftermarket for brake systems and components in China.
  • The market for aftermarket brake pads, rotors, calipers, and other components is driven by consumers' frequent desire for brake modifications for replacement or performance reasons.

Booming Automotive Industry in Japan Upscaling the Market

Japan's brake system market is expected to reach a valuation of around USD 4.7 billion by 2034. Top factors supporting the market’s expansion in the country include:

  • Safety and performance are two things that customers frequently value in Japan. Hence, advancements in brake technology that boost efficiency shorten stopping distances, and increase general safety are widely accepted in the market.
  • The car manufacturing industry in Japan is well-established. Brake system parts, such as calipers, rotors, and pads, are frequently obtained from foreign vendors or manufactured domestically.
  • The production environment is expected to impact the availability and cost of brake systems in Japan.

Increasing Advancements in Brake Technology to Surge Sales in the United Kingdom

The demand for brake systems is increasing in the United Kingdom, with a projected CAGR of 6.6% through 2034. Emerging patterns in the United Kingdom’s market are as follows:

  • Developments in technology, sensors, and materials are expected to impact the United Kingdom's brake system market. These innovations are expected to surge brake systems' overall safety, reactivity, and control.
  • Government initiatives such as environmental laws and fuel economy standards indirectly impact the brake system market in the United Kingdom.

Technological Innovations in South Korea Inflating Market Growth

The brake system market is projected to increase in South Korea at a CAGR of 7.0% through 2034. The factors driving the market’s growth are as follows:

  • Global trends are influencing the brake system market in South Korea.
  • Changes in the automotive sector, such as the emergence of connected features and autonomous cars, impact the design and operation of brake systems in cars marketed in South Korea.

Leading Suppliers in the Brake System Sector

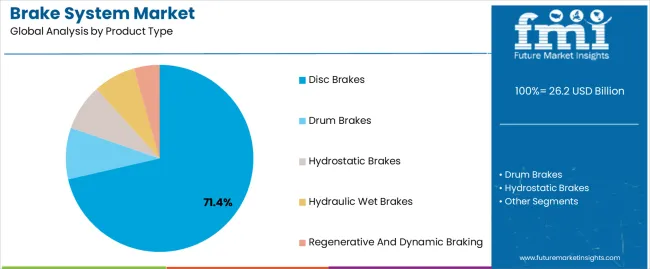
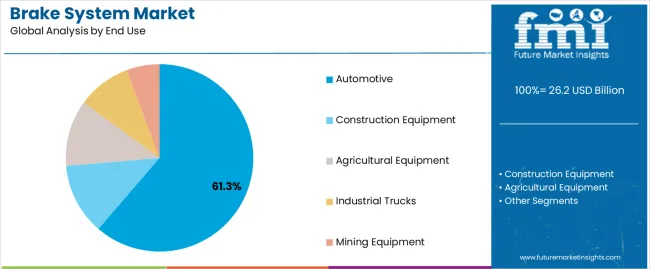
The section below shows the disc brake segment dominated by product type. It is predicted to rise at a CAGR of 5.2% in 2034. The automotive segment is anticipated to generate a dominant share through 2024 based on end-use. It is set to surge at a CAGR of 5.0% in 2034.

Segment CAGR (2024 to 2034)
Disc Brakes (Product Type) 5.2%
Automotive (End-use) 5.0%

Disc Brake Segment Tops the Product Type Category

Based on product type, demand for disc brakes is expected to remain high during the evaluation period.

  • Disc brake systems' increased dependability, safety features, and greater performance have made them more well-liked in the market.
  • Customers increasingly prefer disc brakes as they can provide shorter stopping distances, better control, and resistance to brake fade.
  • Disc brakes are widely used in high-performance vehicles, commercial vehicles, and passenger cars, satisfying the demands of the automotive sector.
  • Disc brakes are less expensive in the long run since they require less upkeep and replacement.

Adoption of Brake Systems in Automotive End-use to Surge Through 2034

Based on end-use, the automotive segment is expected to surge at a CAGR of 5.0% through 2034.

  • Brake systems are changing to meet the special needs of electric and hybrid vehicles as the market for these vehicles grows.
  • Common in electric vehicles, regenerative braking technology functions in tandem with conventional friction brakes.
  • Motorcycles need specific braking systems; the front and rear wheels are frequently equipped with disc brakes.
  • Advanced braking technology, such as anti-lock braking systems (ABS), is sometimes found in high-performance motorbikes.

Notable Players in the Business Landscape

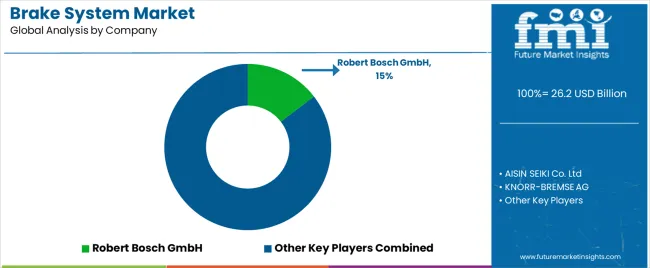
The brake system market is highly competitive due to the presence of several leading participants. Key companies and manufacturers in the industry include AISIN SEIKI Co. Ltd, KNORR-BREMSE AG, Nissin Kogyo Co., Ltd, CONTINENTAL AG, and BREMBO SPA.

Leading players are employing several growth strategies, such as new product launches and joint ventures, to increase their vehicle production capacity.

For instance
  • In 2023, SSAB and MENETA jointly announced the launch of the world's first car brake components and sealing materials made of steel that doesn't come from fossil fuels, marking a crucial turning point in the automobile industry.
  • In 2022, Brembo unveiled the ENESYS Energy Saving System in the aftermarket sector, created especially for light commercial vehicles (LCVs).
  • In 2023, Bosch invested USD 283.2 million to expand its facility in Aguascalientes, Central Mexico. The investment is projected to allow the factory to produce electronic parking brakes (EPB) for top automakers, including Tesla, BMW, and Nissan.

Comprehensive Review of Key Market Players

  • AISIN SEIKI Co. Ltd
  • KNORR-BREMSE AG
  • Nissin Kogyo Co., Ltd
  • CONTINENTAL AG
  • BREMBO S.P.A
  • ZF FRIEDRICHSHAFEN AG
  • Robert Bosch GmbH
  • Delphi Technologies
  • HALDEX
  • Hitachi Automotive Systems

Top Segments Studied in the Brake System Market

By Product Type:

  • Disc Brakes
  • Drum Brakes
  • Hydrostatic Brakes
  • Hydraulic Wet Brakes
  • Regenerative and Dynamic Braking

By End-use:

  • Automotive
  • Construction Equipment
  • Agricultural Equipment
  • Industrial Trucks
  • Mining Equipment

By Distribution Channel:

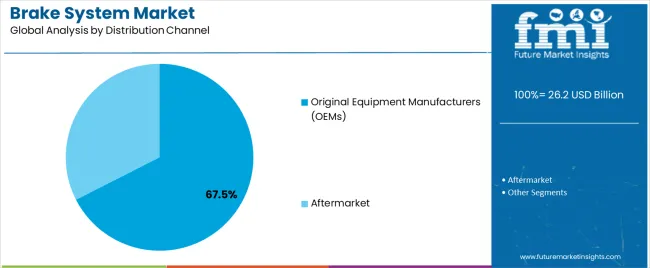
  • Original Equipment Manufacturers (OEMs)
  • Aftermarket

By Region:

  • North America
  • Latin America
  • Europe
  • East Asia
  • South Asia
  • Oceania
  • Middle East and Africa

Table of Content

  • 1. Executive Summary
  • 2. Market Overview
  • 3. Market Background
  • 4. Global Market Analysis 2019 to 2023 and Forecast, 2024 to 2034
  • 5. Global Market Analysis 2019 to 2023 and Forecast 2024 to 2034, By Product Type
    • 5.1. Disc Brakes
    • 5.2. Drum Brakes
    • 5.3. Hydrostatic Brakes
    • 5.4. Hydraulic Wet Brakes
    • 5.5. Regenerative & Dynamic Braking
  • 6. Global Market Analysis 2019 to 2023 and Forecast 2024 to 2034, By End Use
    • 6.1. Automotive
    • 6.2. Construction Equipment
    • 6.3. Agricultural Equipment
    • 6.4. Industrial Trucks
    • 6.5. Mining Equipment
  • 7. Global Market Analysis 2019 to 2023 and Forecast 2024 to 2034, By Distribution Channel
    • 7.1. Original Equipment Manufacturers (OEMs)
    • 7.2. Aftermarket
  • 8. Global Market Analysis 2019 to 2023 and Forecast 2024 to 2034, By Region
    • 8.1. North America
    • 8.2. Latin America
    • 8.3. Europe
    • 8.4. East Asia
    • 8.5. South Asia
    • 8.6. Oceania
    • 8.7. Middle East and Africa
  • 9. North America Market Analysis 2019 to 2023 and Forecast 2024 to 2034, By Country
  • 10. Latin America Market Analysis 2019 to 2023 and Forecast 2024 to 2034, By Country
  • 11. Europe Market Analysis 2019 to 2023 and Forecast 2024 to 2034, By Country
  • 12. East Asia Market Analysis 2019 to 2023 and Forecast 2024 to 2034, By Country
  • 13. South Asia Market Analysis 2019 to 2023 and Forecast 2024 to 2034, By Country
  • 14. Oceania Market Analysis 2019 to 2023 and Forecast 2024 to 2034, By Country
  • 15. Middle East and Africa Market Analysis 2019 to 2023 and Forecast 2024 to 2034, By Country
  • 16. Key Countries Market Analysis
  • 17. Market Structure Analysis
  • 18. Competition Analysis
    • 18.1. AISIN SEIKI Co. Ltd
    • 18.2. KNORR-BREMSE AG
    • 18.3. Nissin Kogyo Co., Ltd
    • 18.4. CONTINENTAL AG
    • 18.5. BREMBO S.P.A
    • 18.6. ZF FRIEDRICHSHAFEN AG
    • 18.7. Robert Bosch GmbH
    • 18.8. Delphi Technologies
    • 18.9. HALDEX
    • 18.10. Hitachi Automotive Systems
  • 19. Assumptions & Acronyms Used
  • 20. Research Methodology

List of Tables

Table 1: Global Market Value (US$ million) Forecast by Region, 2019 to 2034

Table 2: Global Market Volume (Units) Forecast by Region, 2019 to 2034

Table 3: Global Market Value (US$ million) Forecast by Product Type, 2019 to 2034

Table 4: Global Market Volume (Units) Forecast by Product Type, 2019 to 2034

Table 5: Global Market Value (US$ million) Forecast by End Use, 2019 to 2034

Table 6: Global Market Volume (Units) Forecast by End Use, 2019 to 2034

Table 7: Global Market Value (US$ million) Forecast by Distribution Channel, 2019 to 2034

Table 8: Global Market Volume (Units) Forecast by Distribution Channel, 2019 to 2034

Table 9: North America Market Value (US$ million) Forecast by Country, 2019 to 2034

Table 10: North America Market Volume (Units) Forecast by Country, 2019 to 2034

Table 11: North America Market Value (US$ million) Forecast by Product Type, 2019 to 2034

Table 12: North America Market Volume (Units) Forecast by Product Type, 2019 to 2034

Table 13: North America Market Value (US$ million) Forecast by End Use, 2019 to 2034

Table 14: North America Market Volume (Units) Forecast by End Use, 2019 to 2034

Table 15: North America Market Value (US$ million) Forecast by Distribution Channel, 2019 to 2034

Table 16: North America Market Volume (Units) Forecast by Distribution Channel, 2019 to 2034

Table 17: Latin America Market Value (US$ million) Forecast by Country, 2019 to 2034

Table 18: Latin America Market Volume (Units) Forecast by Country, 2019 to 2034

Table 19: Latin America Market Value (US$ million) Forecast by Product Type, 2019 to 2034

Table 20: Latin America Market Volume (Units) Forecast by Product Type, 2019 to 2034

Table 21: Latin America Market Value (US$ million) Forecast by End Use, 2019 to 2034

Table 22: Latin America Market Volume (Units) Forecast by End Use, 2019 to 2034

Table 23: Latin America Market Value (US$ million) Forecast by Distribution Channel, 2019 to 2034

Table 24: Latin America Market Volume (Units) Forecast by Distribution Channel, 2019 to 2034

Table 25: Europe Market Value (US$ million) Forecast by Country, 2019 to 2034

Table 26: Europe Market Volume (Units) Forecast by Country, 2019 to 2034

Table 27: Europe Market Value (US$ million) Forecast by Product Type, 2019 to 2034

Table 28: Europe Market Volume (Units) Forecast by Product Type, 2019 to 2034

Table 29: Europe Market Value (US$ million) Forecast by End Use, 2019 to 2034

Table 30: Europe Market Volume (Units) Forecast by End Use, 2019 to 2034

Table 31: Europe Market Value (US$ million) Forecast by Distribution Channel, 2019 to 2034

Table 32: Europe Market Volume (Units) Forecast by Distribution Channel, 2019 to 2034

Table 33: East Asia Market Value (US$ million) Forecast by Country, 2019 to 2034

Table 34: East Asia Market Volume (Units) Forecast by Country, 2019 to 2034

Table 35: East Asia Market Value (US$ million) Forecast by Product Type, 2019 to 2034

Table 36: East Asia Market Volume (Units) Forecast by Product Type, 2019 to 2034

Table 37: East Asia Market Value (US$ million) Forecast by End Use, 2019 to 2034

Table 38: East Asia Market Volume (Units) Forecast by End Use, 2019 to 2034

Table 39: East Asia Market Value (US$ million) Forecast by Distribution Channel, 2019 to 2034

Table 40: East Asia Market Volume (Units) Forecast by Distribution Channel, 2019 to 2034

Table 41: South Asia Market Value (US$ million) Forecast by Country, 2019 to 2034

Table 42: South Asia Market Volume (Units) Forecast by Country, 2019 to 2034

Table 43: South Asia Market Value (US$ million) Forecast by Product Type, 2019 to 2034

Table 44: South Asia Market Volume (Units) Forecast by Product Type, 2019 to 2034

Table 45: South Asia Market Value (US$ million) Forecast by End Use, 2019 to 2034

Table 46: South Asia Market Volume (Units) Forecast by End Use, 2019 to 2034

Table 47: South Asia Market Value (US$ million) Forecast by Distribution Channel, 2019 to 2034

Table 48: South Asia Market Volume (Units) Forecast by Distribution Channel, 2019 to 2034

Table 49: Oceania Market Value (US$ million) Forecast by Country, 2019 to 2034

Table 50: Oceania Market Volume (Units) Forecast by Country, 2019 to 2034

Table 51: Oceania Market Value (US$ million) Forecast by Product Type, 2019 to 2034

Table 52: Oceania Market Volume (Units) Forecast by Product Type, 2019 to 2034

Table 53: Oceania Market Value (US$ million) Forecast by End Use, 2019 to 2034

Table 54: Oceania Market Volume (Units) Forecast by End Use, 2019 to 2034

Table 55: Oceania Market Value (US$ million) Forecast by Distribution Channel, 2019 to 2034

Table 56: Oceania Market Volume (Units) Forecast by Distribution Channel, 2019 to 2034

Table 57: Middle East and Africa Market Value (US$ million) Forecast by Country, 2019 to 2034

Table 58: Middle East and Africa Market Volume (Units) Forecast by Country, 2019 to 2034

Table 59: Middle East and Africa Market Value (US$ million) Forecast by Product Type, 2019 to 2034

Table 60: Middle East and Africa Market Volume (Units) Forecast by Product Type, 2019 to 2034

Table 61: Middle East and Africa Market Value (US$ million) Forecast by End Use, 2019 to 2034

Table 62: Middle East and Africa Market Volume (Units) Forecast by End Use, 2019 to 2034

Table 63: Middle East and Africa Market Value (US$ million) Forecast by Distribution Channel, 2019 to 2034

Table 64: Middle East and Africa Market Volume (Units) Forecast by Distribution Channel, 2019 to 2034

List of Figures

Figure 1: Global Market Value (US$ million) by Product Type, 2024 to 2034

Figure 2: Global Market Value (US$ million) by End Use, 2024 to 2034

Figure 3: Global Market Value (US$ million) by Distribution Channel, 2024 to 2034

Figure 4: Global Market Value (US$ million) by Region, 2024 to 2034

Figure 5: Global Market Value (US$ million) Analysis by Region, 2019 to 2034

Figure 6: Global Market Volume (Units) Analysis by Region, 2019 to 2034

Figure 7: Global Market Value Share (%) and BPS Analysis by Region, 2024 to 2034

Figure 8: Global Market Y-o-Y Growth (%) Projections by Region, 2024 to 2034

Figure 9: Global Market Value (US$ million) Analysis by Product Type, 2019 to 2034

Figure 10: Global Market Volume (Units) Analysis by Product Type, 2019 to 2034

Figure 11: Global Market Value Share (%) and BPS Analysis by Product Type, 2024 to 2034

Figure 12: Global Market Y-o-Y Growth (%) Projections by Product Type, 2024 to 2034

Figure 13: Global Market Value (US$ million) Analysis by End Use, 2019 to 2034

Figure 14: Global Market Volume (Units) Analysis by End Use, 2019 to 2034

Figure 15: Global Market Value Share (%) and BPS Analysis by End Use, 2024 to 2034

Figure 16: Global Market Y-o-Y Growth (%) Projections by End Use, 2024 to 2034

Figure 17: Global Market Value (US$ million) Analysis by Distribution Channel, 2019 to 2034

Figure 18: Global Market Volume (Units) Analysis by Distribution Channel, 2019 to 2034

Figure 19: Global Market Value Share (%) and BPS Analysis by Distribution Channel, 2024 to 2034

Figure 20: Global Market Y-o-Y Growth (%) Projections by Distribution Channel, 2024 to 2034

Figure 21: Global Market Attractiveness by Product Type, 2024 to 2034

Figure 22: Global Market Attractiveness by End Use, 2024 to 2034

Figure 23: Global Market Attractiveness by Distribution Channel, 2024 to 2034

Figure 24: Global Market Attractiveness by Region, 2024 to 2034

Figure 25: North America Market Value (US$ million) by Product Type, 2024 to 2034

Figure 26: North America Market Value (US$ million) by End Use, 2024 to 2034

Figure 27: North America Market Value (US$ million) by Distribution Channel, 2024 to 2034

Figure 28: North America Market Value (US$ million) by Country, 2024 to 2034

Figure 29: North America Market Value (US$ million) Analysis by Country, 2019 to 2034

Figure 30: North America Market Volume (Units) Analysis by Country, 2019 to 2034

Figure 31: North America Market Value Share (%) and BPS Analysis by Country, 2024 to 2034

Figure 32: North America Market Y-o-Y Growth (%) Projections by Country, 2024 to 2034

Figure 33: North America Market Value (US$ million) Analysis by Product Type, 2019 to 2034

Figure 34: North America Market Volume (Units) Analysis by Product Type, 2019 to 2034

Figure 35: North America Market Value Share (%) and BPS Analysis by Product Type, 2024 to 2034

Figure 36: North America Market Y-o-Y Growth (%) Projections by Product Type, 2024 to 2034

Figure 37: North America Market Value (US$ million) Analysis by End Use, 2019 to 2034

Figure 38: North America Market Volume (Units) Analysis by End Use, 2019 to 2034

Figure 39: North America Market Value Share (%) and BPS Analysis by End Use, 2024 to 2034

Figure 40: North America Market Y-o-Y Growth (%) Projections by End Use, 2024 to 2034

Figure 41: North America Market Value (US$ million) Analysis by Distribution Channel, 2019 to 2034

Figure 42: North America Market Volume (Units) Analysis by Distribution Channel, 2019 to 2034

Figure 43: North America Market Value Share (%) and BPS Analysis by Distribution Channel, 2024 to 2034

Figure 44: North America Market Y-o-Y Growth (%) Projections by Distribution Channel, 2024 to 2034

Figure 45: North America Market Attractiveness by Product Type, 2024 to 2034

Figure 46: North America Market Attractiveness by End Use, 2024 to 2034

Figure 47: North America Market Attractiveness by Distribution Channel, 2024 to 2034

Figure 48: North America Market Attractiveness by Country, 2024 to 2034

Figure 49: Latin America Market Value (US$ million) by Product Type, 2024 to 2034

Figure 50: Latin America Market Value (US$ million) by End Use, 2024 to 2034

Figure 51: Latin America Market Value (US$ million) by Distribution Channel, 2024 to 2034

Figure 52: Latin America Market Value (US$ million) by Country, 2024 to 2034

Figure 53: Latin America Market Value (US$ million) Analysis by Country, 2019 to 2034

Figure 54: Latin America Market Volume (Units) Analysis by Country, 2019 to 2034

Figure 55: Latin America Market Value Share (%) and BPS Analysis by Country, 2024 to 2034

Figure 56: Latin America Market Y-o-Y Growth (%) Projections by Country, 2024 to 2034

Figure 57: Latin America Market Value (US$ million) Analysis by Product Type, 2019 to 2034

Figure 58: Latin America Market Volume (Units) Analysis by Product Type, 2019 to 2034

Figure 59: Latin America Market Value Share (%) and BPS Analysis by Product Type, 2024 to 2034

Figure 60: Latin America Market Y-o-Y Growth (%) Projections by Product Type, 2024 to 2034

Figure 61: Latin America Market Value (US$ million) Analysis by End Use, 2019 to 2034

Figure 62: Latin America Market Volume (Units) Analysis by End Use, 2019 to 2034

Figure 63: Latin America Market Value Share (%) and BPS Analysis by End Use, 2024 to 2034

Figure 64: Latin America Market Y-o-Y Growth (%) Projections by End Use, 2024 to 2034

Figure 65: Latin America Market Value (US$ million) Analysis by Distribution Channel, 2019 to 2034

Figure 66: Latin America Market Volume (Units) Analysis by Distribution Channel, 2019 to 2034

Figure 67: Latin America Market Value Share (%) and BPS Analysis by Distribution Channel, 2024 to 2034

Figure 68: Latin America Market Y-o-Y Growth (%) Projections by Distribution Channel, 2024 to 2034

Figure 69: Latin America Market Attractiveness by Product Type, 2024 to 2034

Figure 70: Latin America Market Attractiveness by End Use, 2024 to 2034

Figure 71: Latin America Market Attractiveness by Distribution Channel, 2024 to 2034

Figure 72: Latin America Market Attractiveness by Country, 2024 to 2034

Figure 73: Europe Market Value (US$ million) by Product Type, 2024 to 2034

Figure 74: Europe Market Value (US$ million) by End Use, 2024 to 2034

Figure 75: Europe Market Value (US$ million) by Distribution Channel, 2024 to 2034

Figure 76: Europe Market Value (US$ million) by Country, 2024 to 2034

Figure 77: Europe Market Value (US$ million) Analysis by Country, 2019 to 2034

Figure 78: Europe Market Volume (Units) Analysis by Country, 2019 to 2034

Figure 79: Europe Market Value Share (%) and BPS Analysis by Country, 2024 to 2034

Figure 80: Europe Market Y-o-Y Growth (%) Projections by Country, 2024 to 2034

Figure 81: Europe Market Value (US$ million) Analysis by Product Type, 2019 to 2034

Figure 82: Europe Market Volume (Units) Analysis by Product Type, 2019 to 2034

Figure 83: Europe Market Value Share (%) and BPS Analysis by Product Type, 2024 to 2034

Figure 84: Europe Market Y-o-Y Growth (%) Projections by Product Type, 2024 to 2034

Figure 85: Europe Market Value (US$ million) Analysis by End Use, 2019 to 2034

Figure 86: Europe Market Volume (Units) Analysis by End Use, 2019 to 2034

Figure 87: Europe Market Value Share (%) and BPS Analysis by End Use, 2024 to 2034

Figure 88: Europe Market Y-o-Y Growth (%) Projections by End Use, 2024 to 2034

Figure 89: Europe Market Value (US$ million) Analysis by Distribution Channel, 2019 to 2034

Figure 90: Europe Market Volume (Units) Analysis by Distribution Channel, 2019 to 2034

Figure 91: Europe Market Value Share (%) and BPS Analysis by Distribution Channel, 2024 to 2034

Figure 92: Europe Market Y-o-Y Growth (%) Projections by Distribution Channel, 2024 to 2034

Figure 93: Europe Market Attractiveness by Product Type, 2024 to 2034

Figure 94: Europe Market Attractiveness by End Use, 2024 to 2034

Figure 95: Europe Market Attractiveness by Distribution Channel, 2024 to 2034

Figure 96: Europe Market Attractiveness by Country, 2024 to 2034

Figure 97: East Asia Market Value (US$ million) by Product Type, 2024 to 2034

Figure 98: East Asia Market Value (US$ million) by End Use, 2024 to 2034

Figure 99: East Asia Market Value (US$ million) by Distribution Channel, 2024 to 2034

Figure 100: East Asia Market Value (US$ million) by Country, 2024 to 2034

Figure 101: East Asia Market Value (US$ million) Analysis by Country, 2019 to 2034

Figure 102: East Asia Market Volume (Units) Analysis by Country, 2019 to 2034

Figure 103: East Asia Market Value Share (%) and BPS Analysis by Country, 2024 to 2034

Figure 104: East Asia Market Y-o-Y Growth (%) Projections by Country, 2024 to 2034

Figure 105: East Asia Market Value (US$ million) Analysis by Product Type, 2019 to 2034

Figure 106: East Asia Market Volume (Units) Analysis by Product Type, 2019 to 2034

Figure 107: East Asia Market Value Share (%) and BPS Analysis by Product Type, 2024 to 2034

Figure 108: East Asia Market Y-o-Y Growth (%) Projections by Product Type, 2024 to 2034

Figure 109: East Asia Market Value (US$ million) Analysis by End Use, 2019 to 2034

Figure 110: East Asia Market Volume (Units) Analysis by End Use, 2019 to 2034

Figure 111: East Asia Market Value Share (%) and BPS Analysis by End Use, 2024 to 2034

Figure 112: East Asia Market Y-o-Y Growth (%) Projections by End Use, 2024 to 2034

Figure 113: East Asia Market Value (US$ million) Analysis by Distribution Channel, 2019 to 2034

Figure 114: East Asia Market Volume (Units) Analysis by Distribution Channel, 2019 to 2034

Figure 115: East Asia Market Value Share (%) and BPS Analysis by Distribution Channel, 2024 to 2034

Figure 116: East Asia Market Y-o-Y Growth (%) Projections by Distribution Channel, 2024 to 2034

Figure 117: East Asia Market Attractiveness by Product Type, 2024 to 2034

Figure 118: East Asia Market Attractiveness by End Use, 2024 to 2034

Figure 119: East Asia Market Attractiveness by Distribution Channel, 2024 to 2034

Figure 120: East Asia Market Attractiveness by Country, 2024 to 2034

Figure 121: South Asia Market Value (US$ million) by Product Type, 2024 to 2034

Figure 122: South Asia Market Value (US$ million) by End Use, 2024 to 2034

Figure 123: South Asia Market Value (US$ million) by Distribution Channel, 2024 to 2034

Figure 124: South Asia Market Value (US$ million) by Country, 2024 to 2034

Figure 125: South Asia Market Value (US$ million) Analysis by Country, 2019 to 2034

Figure 126: South Asia Market Volume (Units) Analysis by Country, 2019 to 2034

Figure 127: South Asia Market Value Share (%) and BPS Analysis by Country, 2024 to 2034

Figure 128: South Asia Market Y-o-Y Growth (%) Projections by Country, 2024 to 2034

Figure 129: South Asia Market Value (US$ million) Analysis by Product Type, 2019 to 2034

Figure 130: South Asia Market Volume (Units) Analysis by Product Type, 2019 to 2034

Figure 131: South Asia Market Value Share (%) and BPS Analysis by Product Type, 2024 to 2034

Figure 132: South Asia Market Y-o-Y Growth (%) Projections by Product Type, 2024 to 2034

Figure 133: South Asia Market Value (US$ million) Analysis by End Use, 2019 to 2034

Figure 134: South Asia Market Volume (Units) Analysis by End Use, 2019 to 2034

Figure 135: South Asia Market Value Share (%) and BPS Analysis by End Use, 2024 to 2034

Figure 136: South Asia Market Y-o-Y Growth (%) Projections by End Use, 2024 to 2034

Figure 137: South Asia Market Value (US$ million) Analysis by Distribution Channel, 2019 to 2034

Figure 138: South Asia Market Volume (Units) Analysis by Distribution Channel, 2019 to 2034

Figure 139: South Asia Market Value Share (%) and BPS Analysis by Distribution Channel, 2024 to 2034

Figure 140: South Asia Market Y-o-Y Growth (%) Projections by Distribution Channel, 2024 to 2034

Figure 141: South Asia Market Attractiveness by Product Type, 2024 to 2034

Figure 142: South Asia Market Attractiveness by End Use, 2024 to 2034

Figure 143: South Asia Market Attractiveness by Distribution Channel, 2024 to 2034

Figure 144: South Asia Market Attractiveness by Country, 2024 to 2034

Figure 145: Oceania Market Value (US$ million) by Product Type, 2024 to 2034

Figure 146: Oceania Market Value (US$ million) by End Use, 2024 to 2034

Figure 147: Oceania Market Value (US$ million) by Distribution Channel, 2024 to 2034

Figure 148: Oceania Market Value (US$ million) by Country, 2024 to 2034

Figure 149: Oceania Market Value (US$ million) Analysis by Country, 2019 to 2034

Figure 150: Oceania Market Volume (Units) Analysis by Country, 2019 to 2034

Figure 151: Oceania Market Value Share (%) and BPS Analysis by Country, 2024 to 2034

Figure 152: Oceania Market Y-o-Y Growth (%) Projections by Country, 2024 to 2034

Figure 153: Oceania Market Value (US$ million) Analysis by Product Type, 2019 to 2034

Figure 154: Oceania Market Volume (Units) Analysis by Product Type, 2019 to 2034

Figure 155: Oceania Market Value Share (%) and BPS Analysis by Product Type, 2024 to 2034

Figure 156: Oceania Market Y-o-Y Growth (%) Projections by Product Type, 2024 to 2034

Figure 157: Oceania Market Value (US$ million) Analysis by End Use, 2019 to 2034

Figure 158: Oceania Market Volume (Units) Analysis by End Use, 2019 to 2034

Figure 159: Oceania Market Value Share (%) and BPS Analysis by End Use, 2024 to 2034

Figure 160: Oceania Market Y-o-Y Growth (%) Projections by End Use, 2024 to 2034

Figure 161: Oceania Market Value (US$ million) Analysis by Distribution Channel, 2019 to 2034

Figure 162: Oceania Market Volume (Units) Analysis by Distribution Channel, 2019 to 2034

Figure 163: Oceania Market Value Share (%) and BPS Analysis by Distribution Channel, 2024 to 2034

Figure 164: Oceania Market Y-o-Y Growth (%) Projections by Distribution Channel, 2024 to 2034

Figure 165: Oceania Market Attractiveness by Product Type, 2024 to 2034

Figure 166: Oceania Market Attractiveness by End Use, 2024 to 2034

Figure 167: Oceania Market Attractiveness by Distribution Channel, 2024 to 2034

Figure 168: Oceania Market Attractiveness by Country, 2024 to 2034

Figure 169: Middle East and Africa Market Value (US$ million) by Product Type, 2024 to 2034

Figure 170: Middle East and Africa Market Value (US$ million) by End Use, 2024 to 2034

Figure 171: Middle East and Africa Market Value (US$ million) by Distribution Channel, 2024 to 2034

Figure 172: Middle East and Africa Market Value (US$ million) by Country, 2024 to 2034

Figure 173: Middle East and Africa Market Value (US$ million) Analysis by Country, 2019 to 2034

Figure 174: Middle East and Africa Market Volume (Units) Analysis by Country, 2019 to 2034

Figure 175: Middle East and Africa Market Value Share (%) and BPS Analysis by Country, 2024 to 2034

Figure 176: Middle East and Africa Market Y-o-Y Growth (%) Projections by Country, 2024 to 2034

Figure 177: Middle East and Africa Market Value (US$ million) Analysis by Product Type, 2019 to 2034

Figure 178: Middle East and Africa Market Volume (Units) Analysis by Product Type, 2019 to 2034

Figure 179: Middle East and Africa Market Value Share (%) and BPS Analysis by Product Type, 2024 to 2034

Figure 180: Middle East and Africa Market Y-o-Y Growth (%) Projections by Product Type, 2024 to 2034

Figure 181: Middle East and Africa Market Value (US$ million) Analysis by End Use, 2019 to 2034

Figure 182: Middle East and Africa Market Volume (Units) Analysis by End Use, 2019 to 2034

Figure 183: Middle East and Africa Market Value Share (%) and BPS Analysis by End Use, 2024 to 2034

Figure 184: Middle East and Africa Market Y-o-Y Growth (%) Projections by End Use, 2024 to 2034

Figure 185: Middle East and Africa Market Value (US$ million) Analysis by Distribution Channel, 2019 to 2034

Figure 186: Middle East and Africa Market Volume (Units) Analysis by Distribution Channel, 2019 to 2034

Figure 187: Middle East and Africa Market Value Share (%) and BPS Analysis by Distribution Channel, 2024 to 2034

Figure 188: Middle East and Africa Market Y-o-Y Growth (%) Projections by Distribution Channel, 2024 to 2034

Figure 189: Middle East and Africa Market Attractiveness by Product Type, 2024 to 2034

Figure 190: Middle East and Africa Market Attractiveness by End Use, 2024 to 2034

Figure 191: Middle East and Africa Market Attractiveness by Distribution Channel, 2024 to 2034

Figure 192: Middle East and Africa Market Attractiveness by Country, 2024 to 2034

Frequently Asked Questions

How big is the brake system market?

The market is set to reach USD 24.9 billion in 2024.

What is the forecast for the brake system market?

Demand for brake systems is slated to expand at a 5.4% CAGR by 2034.

What is the outlook for the brake system market?

The market is set to reach USD 42.3 billion by 2034.

Who are the key players in the brake system market?

AISIN SEIKI Co. Ltd, KNORR-BREMSE AG, and Nissin Kogyo Co. are the key players.

Which product type would lead the brake system market?

The disc brake segment is estimated to hold a significant market share in 2024.

Explore Similar Insights

Future Market Insights

Brake System Market