HVAC Control System Market Outlook for 2024 to 2034

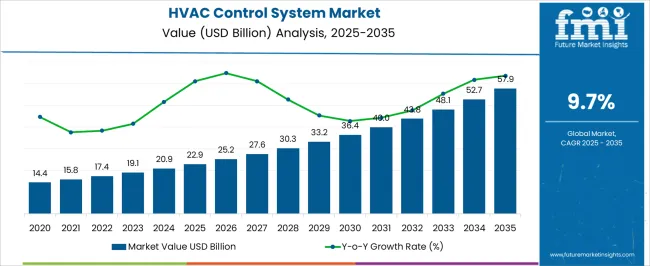
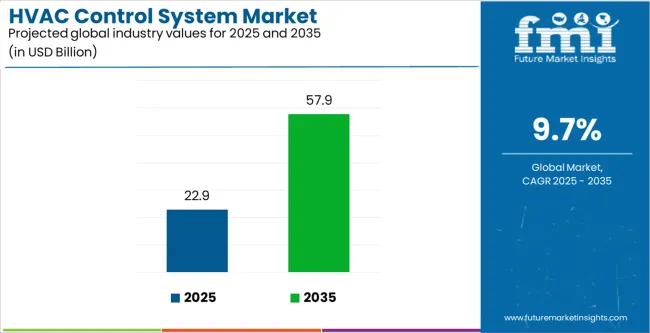
The HVAC control system market is projected to be worth approximately USD 20.9 billion by 2024. A vital component of contemporary building infrastructure, HVAC control systems are in high demand due to the need for comfort optimization, environmental consciousness, and technological innovation. HVAC control system sales are expected to register a moderate 9.7% CAGR between 2024 and 2034, with a global worth of USD 52.6 billion by 2034.

Attributes Details
HVAC Control System Market Value for 2024 USD 20.9 billion
HVAC Control System Market Value for 2034 USD 52.6 billion
HVAC Control System Market Forecast CAGR for 2024 to 2034 9.7%

Consumption Analysis of the HVAC Control System Sector

  • The HVAC industry has experienced a significant surge in demand due to increased spending in the construction sector, rapid urbanization, and rising disposable incomes across major economies.
  • The fundamental control systems of HVAC equipment fuel market expansion. Climate change drives global HVAC demand, making it a necessity rather than a luxury due to rising temperatures and unpredictable weather conditions.
  • The growing consumer demand for building automation systems and the technical advancements related to HVAC control units are driving the predicted expansion of the HVAC control system market.
  • The HVAC control systems market is expected to experience significant growth due to global government initiatives promoting green, clean, and sustainable environments, with financial incentives for energy-saving equipment used in residential and commercial spaces.
  • Additionally, as consumers' preferences for comfort increase, there is a growing need for remotely operated HVAC controls, which is expected to have a favorable impact on the HVAC control systems market.

Historical Performance and Future Growth of the HVAC Control System Market

This part offers a thorough examination of the industry during the previous five years, with an emphasis on anticipated changes in the heating, ventilation, and air conditioning (HVAC) control system sector. The market is gradually becoming more positive, with a 10.7% historical CAGR. Up to 2034, the industry is expected to grow consistently at a 9.7% CAGR.

Historical CAGR 10.7%

Numerous kinds of sensors and equipment are used in the heating, ventilation, and air conditioning (HVAC) systems to manage temperature, airflow, and other factors. Electrical problems can also be particularly sensitive to such a complicated arrangement. Because of their complexity, upgrading the current HVAC control systems is difficult, which is predicted to impede the market growth.

Crucial factors that are anticipated to influence the demand for HVAC control systems through 2034.

  • Adopting a heating, ventilation, and air conditioning (HVAC) control system is hindered by high initial investment costs, particularly for smaller enterprises or residential applications.
  • Customers and organizations must be aware of or comprehend the advantages and possibilities of HVAC control systems.
  • Opposition to switching from conventional HVAC systems is due to worries about implementation-related complications or disruptions in business as usual.
  • Concerns about further training or technical assistance and compatibility with the current HVAC infrastructure.
  • Building improvements and energy efficiency programs are sometimes postponed or scaled back in scope due to economic downturns or budgetary constraints.

Industry participants will want to be wise and flexible over the anticipated period, as these qualities position the industry for success in subsequent decades.

Key Trends Influencing the HVAC Control System Market

Integration of IoTs Develops Robust HVAC Control System

The demand for HVAC control systems has expanded dramatically due to their integration with IoT and smart technologies. Real-time HVAC performance monitoring is made possible by these systems, which enables facility managers and owners to spot problems and make well-informed decisions.

To minimize downtime and increase equipment longevity, they also employ machine learning algorithms and data analytics to forecast equipment breakdowns and maintenance requirements. The system's dependability, effectiveness, and maintenance cost are all optimized by this proactive strategy.

IoT-enabled HVAC control systems also enable precise control and optimization of energy consumption, adjusting settings based on occupancy patterns, weather conditions, and energy demand. Advanced energy management features, including demand response capabilities and load balancing algorithms, enable buildings to participate in energy-saving programs and optimize energy efficiency during peak demand periods.

These advancements contribute to cost savings, sustainability, and occupant comfort, making IoT-enabled HVAC control systems indispensable components of modern building management strategies.

Cloud-Based HVAC Solutions Scales up the Market Growth

The shift towards cloud-based HVAC control systems is a significant advancement in modern building management, enabling scalability, real-time data analytics, and enhanced connectivity across building systems. These systems provide unlimited storage and computing resources, enabling seamless integration of additional sensors, devices, and control points as buildings expand or undergo renovation.

This scalability enables HVAC systems to adapt to changing occupancy patterns, building usage, and environmental conditions while maintaining optimal performance and efficiency.

Real-time data analytics from cloud-based systems provide actionable insights into building performance, energy consumption, and occupant comfort. By aggregating data from sensors, meters, and other IoT devices, these systems can analyze trends, identify anomalies, and predict future outcomes, empowering stakeholders to make data-driven decisions that optimize HVAC operation and energy usage.

Improved communication between building systems makes it possible to monitor and regulate them centrally, facilitating efficient maintenance planning and thorough management of HVAC operations. Cloud-based HVAC control systems are becoming essential tools for building management in the digital era due to the trend toward cloud-based solutions.

Emphasis on Energy Efficiency and Sustainability Demands Eco-Friendly HVAC Solutions and Controls

The growing focus on energy efficiency and sustainability drives the demand for eco-friendly HVAC solutions and controls. Governments and regulatory bodies worldwide are implementing stringent energy efficiency regulations to reduce greenhouse gas emissions and promote sustainable building practices. The alteration has significant implications for HVAC systems, which account for a substantial portion of a building's energy consumption.

Eco-friendly HVAC solutions offer significant savings over traditional ones, with long-term benefits often outweighing the initial costs. Governments and utilities offer incentives, rebates, and financing programs to encourage the adoption of energy-efficient heating, ventilation, and air conditioning (HVAC) technologies.

Industries also recognize the importance of corporate social responsibility (CSR) and environmental stewardship in building brand reputation and maintaining competitiveness. Eco-friendly HVAC solutions improve indoor air quality, occupant comfort, and health outcomes.

Category-wise Insights

This section offers in-depth analyses of particular HVAC control system market sectors. The two main topics of the research are the segment with the temperature and humidity control type and the retrofit implementation type segment. Through a comprehensive examination, this section attempts to provide a fuller knowledge of these segments and their relevance in the larger context of the heating, ventilation, and air conditioning (HVAC) solution industry.

HVAC Control System Sector Swells Temperature and Humidity Control

Attributes Details
Top Type Temperature and Humidity Control
CAGR from 2024 to 2034 9.4%

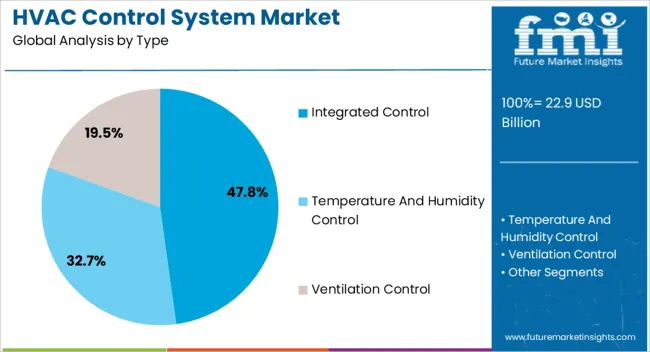
The market for HVAC control systems is driven by the requirement to maintain ideal conditions for ventilation and automation accuracy, which includes controlling temperature and humidity. Registering a promising CAGR of 9.4% from 2024 to 2034, the following drives display the growth of the segment:

  • The need for HVAC management systems that can precisely regulate temperature to maintain occupant comfort and safety is driven by an increase in the frequency of extreme weather events and climatic variability.
  • The need for HVAC controls that can efficiently regulate humidity levels to stop mold formation, lessen allergens, and provide a comfortable indoor environment is driven by growing awareness of the significance of indoor air quality in preserving health and well-being.
  • Globally, strict laws and guidelines about energy efficiency encourage using HVAC management systems that regulate temperature and humidity levels to reduce energy use and running expenses.
  • The need for next-generation systems that offer improved performance and economy is driven by ongoing improvements in HVAC control technology, such as integrating IoT sensors and smart algorithms, which enable more accurate and automatic temperature and humidity management.

Retrofit Implementation Shoot up in HVAC Control System Industry

Attributes Details
Top Implementation Retrofit
CAGR from 2024 to 2034 9.2%

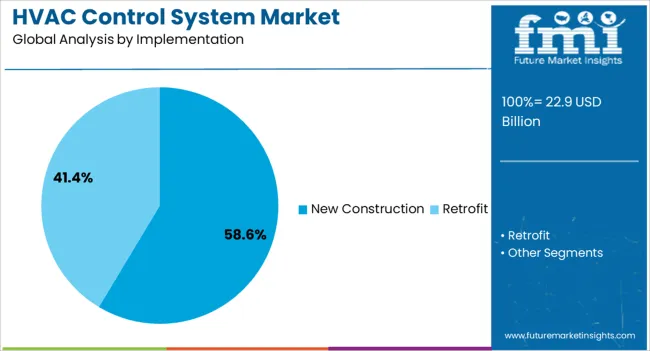
During the forecast period, the global HVAC solution and control system market is segmented into retrofit and new construction, with the retrofit segment accounting for a moderate CAGR of 9.2% from 2024 to 2034, the growth drivers are as follows:

  • The aging of existing HVAC systems and infrastructure necessitates retrofitting modern control systems to enhance energy efficiency, reliability, and performance.
  • Retrofitting HVAC controls offers significant cost savings compared to full system replacements, making it an attractive option for building owners and operators seeking system upgrades.
  • The global focus on energy efficiency and sustainability regulations is driving the adoption of retrofit HVAC controls to enhance energy consumption and decrease carbon emissions in existing buildings.
  • Advancements in HVAC control systems, including wireless connectivity, cloud-based solutions, and advanced algorithms, are making retrofits more affordable and feasible, increasing the demand for modernization.
  • Retrofitting HVAC controls improves occupant comfort, indoor air quality, and productivity by implementing precise temperature and humidity control, ventilation management, and air filtration systems.

Country-wise Insights

United States, China, Japan, South Korea, and the United Kingdom are some of the most predominant nations on the global stage, and this section is anticipated to gaze at their HVAC control system sectors. Examine the several aspects influencing these nations' need for, acceptance of, and interactions with HVAC management via a thorough investigation.

Countries CAGR from 2024 to 2034
United States 9.8%
United Kingdom 11.0%
China 10.6%
Japan 10.4%
South Korea 9.5%

United States Skyscrapers Shoots up the Demand for the HVAC Management

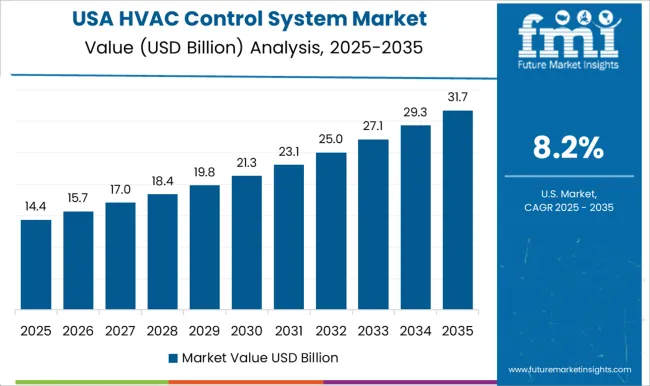
By 2034, the HVAC control system market in the United States brought in USD 9.4 billion in sales. In the upcoming years, the market is anticipated to increase at a compound annual growth rate (CAGR) of 9.8% from 2024 to 2034. These factors are propelling the industry's expansion:

  • United States skyscrapers, which house large numbers of occupants in small spaces, demand efficient HVAC systems to regulate indoor air quality and temperature across multiple floors.
  • Due to their intricate design and layout, skyscrapers in the United States require advanced HVAC management solutions for optimal performance and comfort, including ventilation, air distribution, and temperature control.
  • Stringent energy efficiency regulations and sustainability goals drive demand for advanced HVAC management systems in skyscrapers to minimize energy consumption, reduce operating costs, and achieve LEED or other green building certifications.
  • HVAC management is crucial for creating comfortable indoor building environments and ensuring health, productivity, and satisfaction through efficient temperature and humidity control, air filtration, and ventilation.

Demand for the HVAC Solutions upsurges in United Kingdom’s Automobile Infrastructure

The HVAC control system sector in the United Kingdom is expected to witness substantial growth in the coming years, with an estimated CAGR of 11.0% until 2034. The industry has already shown significant potential, with a CAGR of 14.9% between 2019 to 2023. The market is projected to be valued at USD 2.2 billion, indicating a vast potential for growth and investment in the automobile sector. Here are a few of the major trends:

  • The United Kingdom's automobile infrastructure is moving toward electric vehicles (EVs), which means sophisticated HVAC systems are needed to control cabin temperature and guarantee passenger comfort without depending on conventional engine heat.
  • The need for automobile HVAC systems that can efficiently filter allergens and pollutants from entering the air, enhancing cabin air quality and improving occupant health, is driven by growing concerns about air pollution and urban air quality.
  • Sophisticated HVAC systems that interface with car telematics systems to allow remote management, scheduling, and customizable climate settings for greater convenience and comfort are necessary to incorporate smart features and connectivity in modern automobiles.

Chinese HVAC Control System Industry Supports Technological Advancements

The HVAC control system market in China is expected to grow at a compound annual growth rate (CAGR) of 10.6%. By 2034, experts predict the industry will be valued at USD 8.7 billion. Between 2019 and 2023, the Chinese heating, ventilation, and air conditioning (HVAC) control market is anticipated to grow at a 12.4% CAGR. Some of the primary trends are:
  • Research and development are key drivers of technical breakthroughs in the Chinese HVAC control system sector, including smart sensors, predictive maintenance, and energy optimization algorithms.
  • Chinese producers of HVAC control systems work with tech firms, academic institutions, and research centers to bring cutting-edge solutions and speed up technological innovation.
  • Chinese HVAC control system makers to create intelligent, networked systems for real-time monitoring, analysis, and optimization that improve energy efficiency and performance are using IoT and AI technologies.
  • Through the development of automation platforms, cloud-based management systems, and energy-efficient solutions, the Chinese HVAC control system sector embraces sustainability and smart buildings.

Japanese HVAC Solutions and Control Market Witnesses Elevated Demand

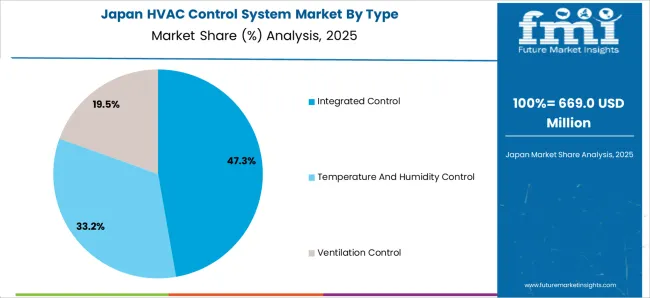
It is anticipated that the demand for HVAC control systems in Japan is likely to register a growth of 10.4% between 2024 to 2034. The construction sector's growing demand for HVAC control systems is expected to propel market growth in the next decade. The market is expected to develop a market valuation of USD 5.6 billion by 2034. Among the primary drivers are:

  • The Japanese HVAC market is experiencing increased demand due to its emphasis on energy efficiency and sustainability, leading to advanced systems and controls adoption.
  • Japan's urbanization and construction boom has heightened the demand for HVAC solutions in commercial, residential, and industrial buildings, requiring efficient temperature regulation and air quality management.
  • The Japanese market is experiencing a surge in demand for HVAC solutions and controls due to technological advancements and automation, enhancing performance, reliability, and convenience.

South Korea’s HVAC Control Solution Market Swells in Forthcoming Decade

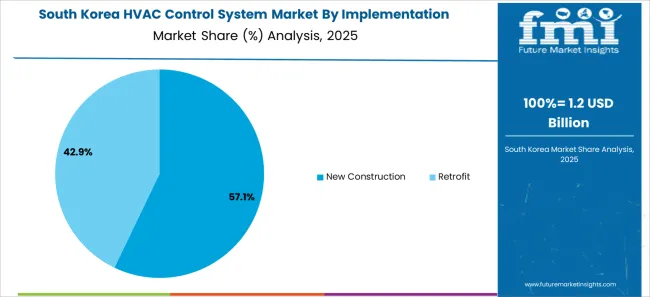
The heating, ventilation, and air conditioning (HVAC) controls market in South Korea is poised for significant growth in the years to come, owing to the rapid development of technical and construction sectors in the province. The demand for HVAC control system is expected to increase at a CAGR of approximately 9.5% from 2024 to 2034 with global valuation of USD 3.1 billion. Some of the primary trends are:

  • The South Korean government encourages environmental sustainability and energy efficiency through policies and programs, driving demand for sophisticated HVAC control systems.
  • South Korea is integrating IoT-enabled systems and smart sensors to create sophisticated HVAC management solutions emphasizing sustainability, energy efficiency, and comfort.
  • The need for HVAC control solutions in the residential, commercial, and industrial sectors is rising due to South Korea's fast infrastructure development and urbanization, emphasizing effective temperature regulation and air quality management.
  • The HVAC solution providers in South Korea are preparing for significant market expansion in the upcoming ten years by going global and partnering with foreign businesses to access new technology and take advantage of growing possibilities.

Market Players Shaping the Outlook of the HVAC Control System Industry

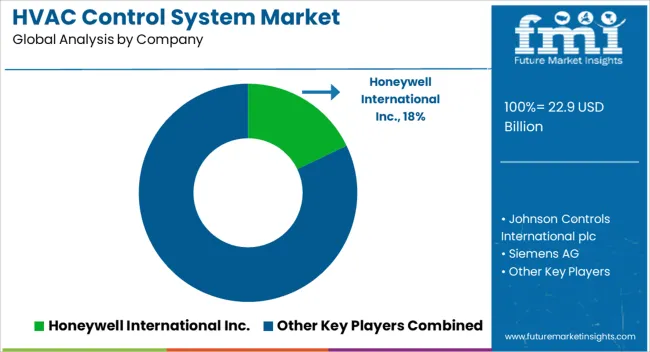
The global HVAC control system market is undergoing significant changes due to the involvement of market players. These enterprises are enhancing system performance, energy efficiency, and user experience through research and development, leading to advanced control algorithms, predictive maintenance solutions, and smart sensors. These advancements push the boundaries of HVAC technology, driving industry progress and differentiation.

Technological advancements like the Internet of Things (IoT), artificial intelligence (AI), and cloud computing are reshaping the HVAC control system landscape, enabling interconnected systems capable of collecting and analyzing data, predicting equipment failures, and optimizing energy usage. This integration enhances system reliability, efficiency, and sustainability, meeting customer needs and regulatory requirements.

Strategic partnerships are being formed with technology providers, building automation companies, and energy management firms to offer comprehensive heating, ventilation, and air conditioning (HVAC) control systems. These partnerships leverage each other's strengths and expertise to deliver value-added solutions that address diverse customer needs.

Stakeholder engagement is also crucial, as companies engage with building owners, contractors, and facility managers to understand their needs and develop customized solutions. This customer-centric approach enables companies to deliver tailored heating, ventilation, and air conditioning (HVAC) control systems that meet specific requirements and provide measurable energy savings, comfort, and indoor air quality benefits.

Recent Developments in the HVAC Control System Industry
  • In February 2024, Birmingham University developed a microwave-based thermochemical system for EV climate control, known as an e-Thermal bank, which could extend vehicle range by up to 70%. This system offloads HVAC duties from the battery, boosting range during extreme weather conditions.
  • In February 2024, Danfoss India showcased its Microchannel Heat Exchanger (MCHE) technology at ACREX India 2024, offering energy efficiency and reduced refrigerant consumption. The advanced Next Gen Evaporator reduces efficiency by 30% and optimizes refrigerant flow, reducing costs and installation times and aligning with the industry's ESG commitments.
  • In February 2024, Hira Group, a leading building product manufacturer, opened a new showroom in Fujairah to expand its product and service offerings and meet consumer expectations. The strategic location near manufacturing facilities in Ras Al Khaimah allows for convenient product and solution showcases.
  • In February 2024, Alat and Carrier Global Corporation partnered to establish a state-of-the-art manufacturing and R&D center in Saudi Arabia, focusing on advanced HVAC solutions for Giga projects and global distribution. The collaboration aims to leverage Alat's financial capabilities and Carrier's technological expertise.

Key Companies in the HVAC Control System Market

  • Honeywell International Inc.
  • Johnson Controls International plc
  • Siemens AG
  • Schneider Electric SE
  • Emerson Electric Co.
  • United Technologies Corporation
  • Delta Controls Inc.
  • Mitsubishi Electric Corporation
  • LG Electronics Inc.
  • Daikin Industries, Ltd.
  • Ingersoll Rand Inc.
  • Trane Technologies plc
  • Carrier Global Corporation
  • Bosch Thermotechnology Corp.
  • Lennox International Inc.
  • Climatronics Corporation
  • ABB Ltd.
  • Crestron Electronics, Inc.
  • Belimo Holding AG
  • TROX GmbH

Key Coverage in the HVAC Control System Market Report

  • HVAC Control System Market Graph Analysis
  • Advancements in the HVAC Software in the United States
  • Top 10 heating, ventilation, and air conditioning (HVAC) controls solutions
  • Sales Assessment of Automotive HVAC Ducts and Blowers products
  • Price Analysis of the HVAC Blower and Fan Systems Market in United States
  • Development of HVAC Insulation for construction
  • Distribution in Latin America for Automotive HVAC Market

Key Segments

By Type:

  • Temperature and Humidity Control
  • Ventilation Control
  • Integrated Control

By Implementation:

  • Retrofit
  • New Construction

By End-User:

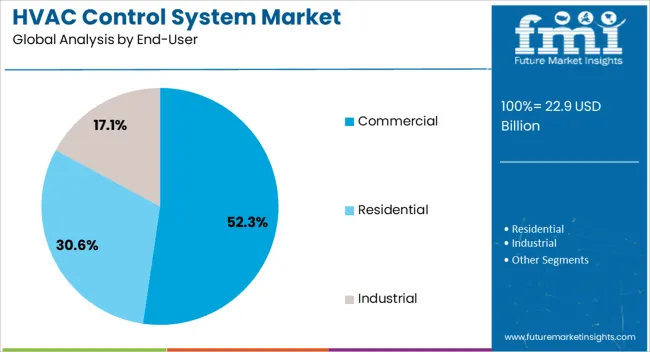
  • Commercial
  • Residential
  • Industrial

By Region:

  • North America
  • Latin America
  • Europe
  • East Asia
  • South Asia
  • Oceania
  • Middle East and Africa

Table of Content

  • 1. Executive Summary
  • 2. Market Overview
  • 3. Market Background
  • 4. Global Market Analysis 2019 to 2023 and Forecast, 2024 to 2034
  • 5. Global Market Analysis 2019 to 2023 and Forecast 2024 to 2034, By Type
    • 5.1. Temperature & Humidity Control
    • 5.2. Ventilation Control
    • 5.3. Integrated Control
  • 6. Global Market Analysis 2019 to 2023 and Forecast 2024 to 2034, By Implementation
    • 6.1. Retrofit
    • 6.2. New Construction
  • 7. Global Market Analysis 2019 to 2023 and Forecast 2024 to 2034, By End-User
    • 7.1. Commercial
    • 7.2. Residential
    • 7.3. Industrial
  • 8. Global Market Analysis 2019 to 2023 and Forecast 2024 to 2034, By Region
    • 8.1. North America
    • 8.2. Latin America
    • 8.3. Western Europe
    • 8.4. Eastern Europe
    • 8.5. South Asia and Pacific
    • 8.6. East Asia
    • 8.7. Middle East and Africa
  • 9. North America Market Analysis 2019 to 2023 and Forecast 2024 to 2034, By Country
  • 10. Latin America Market Analysis 2019 to 2023 and Forecast 2024 to 2034, By Country
  • 11. Western Europe Market Analysis 2019 to 2023 and Forecast 2024 to 2034, By Country
  • 12. Eastern Europe Market Analysis 2019 to 2023 and Forecast 2024 to 2034, By Country
  • 13. South Asia and Pacific Market Analysis 2019 to 2023 and Forecast 2024 to 2034, By Country
  • 14. East Asia Market Analysis 2019 to 2023 and Forecast 2024 to 2034, By Country
  • 15. Middle East and Africa Market Analysis 2019 to 2023 and Forecast 2024 to 2034, By Country
  • 16. Key Countries Market Analysis
  • 17. Market Structure Analysis
  • 18. Competition Analysis
    • 18.1. Honeywell International Inc
    • 18.2. Johnson Controls International PLC
    • 18.3. Siemens AG
    • 18.4. Carrier Global Corporation
    • 18.5. Emerson Electric Co
    • 18.6. Schneider Electric
    • 18.7. Trane Technologies PLC
    • 18.8. Daikin Industries, Ltd.
    • 18.9. Delta Controls
    • 18.10. Lennox International Inc
  • 19. Assumptions & Acronyms Used
  • 20. Research Methodology

List of Tables

Table 1: Global Market Value (US$ Million) Forecast by Region, 2019 to 2034

Table 2: Global Market Volume (Units) Forecast by Region, 2019 to 2034

Table 3: Global Market Value (US$ Million) Forecast by Type, 2019 to 2034

Table 4: Global Market Volume (Units) Forecast by Type, 2019 to 2034

Table 5: Global Market Value (US$ Million) Forecast by Implementation, 2019 to 2034

Table 6: Global Market Volume (Units) Forecast by Implementation, 2019 to 2034

Table 7: Global Market Value (US$ Million) Forecast by End-User, 2019 to 2034

Table 8: Global Market Volume (Units) Forecast by End-User, 2019 to 2034

Table 9: North America Market Value (US$ Million) Forecast by Country, 2019 to 2034

Table 10: North America Market Volume (Units) Forecast by Country, 2019 to 2034

Table 11: North America Market Value (US$ Million) Forecast by Type, 2019 to 2034

Table 12: North America Market Volume (Units) Forecast by Type, 2019 to 2034

Table 13: North America Market Value (US$ Million) Forecast by Implementation, 2019 to 2034

Table 14: North America Market Volume (Units) Forecast by Implementation, 2019 to 2034

Table 15: North America Market Value (US$ Million) Forecast by End-User, 2019 to 2034

Table 16: North America Market Volume (Units) Forecast by End-User, 2019 to 2034

Table 17: Latin America Market Value (US$ Million) Forecast by Country, 2019 to 2034

Table 18: Latin America Market Volume (Units) Forecast by Country, 2019 to 2034

Table 19: Latin America Market Value (US$ Million) Forecast by Type, 2019 to 2034

Table 20: Latin America Market Volume (Units) Forecast by Type, 2019 to 2034

Table 21: Latin America Market Value (US$ Million) Forecast by Implementation, 2019 to 2034

Table 22: Latin America Market Volume (Units) Forecast by Implementation, 2019 to 2034

Table 23: Latin America Market Value (US$ Million) Forecast by End-User, 2019 to 2034

Table 24: Latin America Market Volume (Units) Forecast by End-User, 2019 to 2034

Table 25: Western Europe Market Value (US$ Million) Forecast by Country, 2019 to 2034

Table 26: Western Europe Market Volume (Units) Forecast by Country, 2019 to 2034

Table 27: Western Europe Market Value (US$ Million) Forecast by Type, 2019 to 2034

Table 28: Western Europe Market Volume (Units) Forecast by Type, 2019 to 2034

Table 29: Western Europe Market Value (US$ Million) Forecast by Implementation, 2019 to 2034

Table 30: Western Europe Market Volume (Units) Forecast by Implementation, 2019 to 2034

Table 31: Western Europe Market Value (US$ Million) Forecast by End-User, 2019 to 2034

Table 32: Western Europe Market Volume (Units) Forecast by End-User, 2019 to 2034

Table 33: Eastern Europe Market Value (US$ Million) Forecast by Country, 2019 to 2034

Table 34: Eastern Europe Market Volume (Units) Forecast by Country, 2019 to 2034

Table 35: Eastern Europe Market Value (US$ Million) Forecast by Type, 2019 to 2034

Table 36: Eastern Europe Market Volume (Units) Forecast by Type, 2019 to 2034

Table 37: Eastern Europe Market Value (US$ Million) Forecast by Implementation, 2019 to 2034

Table 38: Eastern Europe Market Volume (Units) Forecast by Implementation, 2019 to 2034

Table 39: Eastern Europe Market Value (US$ Million) Forecast by End-User, 2019 to 2034

Table 40: Eastern Europe Market Volume (Units) Forecast by End-User, 2019 to 2034

Table 41: South Asia and Pacific Market Value (US$ Million) Forecast by Country, 2019 to 2034

Table 42: South Asia and Pacific Market Volume (Units) Forecast by Country, 2019 to 2034

Table 43: South Asia and Pacific Market Value (US$ Million) Forecast by Type, 2019 to 2034

Table 44: South Asia and Pacific Market Volume (Units) Forecast by Type, 2019 to 2034

Table 45: South Asia and Pacific Market Value (US$ Million) Forecast by Implementation, 2019 to 2034

Table 46: South Asia and Pacific Market Volume (Units) Forecast by Implementation, 2019 to 2034

Table 47: South Asia and Pacific Market Value (US$ Million) Forecast by End-User, 2019 to 2034

Table 48: South Asia and Pacific Market Volume (Units) Forecast by End-User, 2019 to 2034

Table 49: East Asia Market Value (US$ Million) Forecast by Country, 2019 to 2034

Table 50: East Asia Market Volume (Units) Forecast by Country, 2019 to 2034

Table 51: East Asia Market Value (US$ Million) Forecast by Type, 2019 to 2034

Table 52: East Asia Market Volume (Units) Forecast by Type, 2019 to 2034

Table 53: East Asia Market Value (US$ Million) Forecast by Implementation, 2019 to 2034

Table 54: East Asia Market Volume (Units) Forecast by Implementation, 2019 to 2034

Table 55: East Asia Market Value (US$ Million) Forecast by End-User, 2019 to 2034

Table 56: East Asia Market Volume (Units) Forecast by End-User, 2019 to 2034

Table 57: Middle East and Africa Market Value (US$ Million) Forecast by Country, 2019 to 2034

Table 58: Middle East and Africa Market Volume (Units) Forecast by Country, 2019 to 2034

Table 59: Middle East and Africa Market Value (US$ Million) Forecast by Type, 2019 to 2034

Table 60: Middle East and Africa Market Volume (Units) Forecast by Type, 2019 to 2034

Table 61: Middle East and Africa Market Value (US$ Million) Forecast by Implementation, 2019 to 2034

Table 62: Middle East and Africa Market Volume (Units) Forecast by Implementation, 2019 to 2034

Table 63: Middle East and Africa Market Value (US$ Million) Forecast by End-User, 2019 to 2034

Table 64: Middle East and Africa Market Volume (Units) Forecast by End-User, 2019 to 2034

List of Figures

Figure 1: Global Market Value (US$ Million) by Type, 2024 to 2034

Figure 2: Global Market Value (US$ Million) by Implementation, 2024 to 2034

Figure 3: Global Market Value (US$ Million) by End-User, 2024 to 2034

Figure 4: Global Market Value (US$ Million) by Region, 2024 to 2034

Figure 5: Global Market Value (US$ Million) Analysis by Region, 2019 to 2034

Figure 6: Global Market Volume (Units) Analysis by Region, 2019 to 2034

Figure 7: Global Market Value Share (%) and BPS Analysis by Region, 2024 to 2034

Figure 8: Global Market Y-o-Y Growth (%) Projections by Region, 2024 to 2034

Figure 9: Global Market Value (US$ Million) Analysis by Type, 2019 to 2034

Figure 10: Global Market Volume (Units) Analysis by Type, 2019 to 2034

Figure 11: Global Market Value Share (%) and BPS Analysis by Type, 2024 to 2034

Figure 12: Global Market Y-o-Y Growth (%) Projections by Type, 2024 to 2034

Figure 13: Global Market Value (US$ Million) Analysis by Implementation, 2019 to 2034

Figure 14: Global Market Volume (Units) Analysis by Implementation, 2019 to 2034

Figure 15: Global Market Value Share (%) and BPS Analysis by Implementation, 2024 to 2034

Figure 16: Global Market Y-o-Y Growth (%) Projections by Implementation, 2024 to 2034

Figure 17: Global Market Value (US$ Million) Analysis by End-User, 2019 to 2034

Figure 18: Global Market Volume (Units) Analysis by End-User, 2019 to 2034

Figure 19: Global Market Value Share (%) and BPS Analysis by End-User, 2024 to 2034

Figure 20: Global Market Y-o-Y Growth (%) Projections by End-User, 2024 to 2034

Figure 21: Global Market Attractiveness by Type, 2024 to 2034

Figure 22: Global Market Attractiveness by Implementation, 2024 to 2034

Figure 23: Global Market Attractiveness by End-User, 2024 to 2034

Figure 24: Global Market Attractiveness by Region, 2024 to 2034

Figure 25: North America Market Value (US$ Million) by Type, 2024 to 2034

Figure 26: North America Market Value (US$ Million) by Implementation, 2024 to 2034

Figure 27: North America Market Value (US$ Million) by End-User, 2024 to 2034

Figure 28: North America Market Value (US$ Million) by Country, 2024 to 2034

Figure 29: North America Market Value (US$ Million) Analysis by Country, 2019 to 2034

Figure 30: North America Market Volume (Units) Analysis by Country, 2019 to 2034

Figure 31: North America Market Value Share (%) and BPS Analysis by Country, 2024 to 2034

Figure 32: North America Market Y-o-Y Growth (%) Projections by Country, 2024 to 2034

Figure 33: North America Market Value (US$ Million) Analysis by Type, 2019 to 2034

Figure 34: North America Market Volume (Units) Analysis by Type, 2019 to 2034

Figure 35: North America Market Value Share (%) and BPS Analysis by Type, 2024 to 2034

Figure 36: North America Market Y-o-Y Growth (%) Projections by Type, 2024 to 2034

Figure 37: North America Market Value (US$ Million) Analysis by Implementation, 2019 to 2034

Figure 38: North America Market Volume (Units) Analysis by Implementation, 2019 to 2034

Figure 39: North America Market Value Share (%) and BPS Analysis by Implementation, 2024 to 2034

Figure 40: North America Market Y-o-Y Growth (%) Projections by Implementation, 2024 to 2034

Figure 41: North America Market Value (US$ Million) Analysis by End-User, 2019 to 2034

Figure 42: North America Market Volume (Units) Analysis by End-User, 2019 to 2034

Figure 43: North America Market Value Share (%) and BPS Analysis by End-User, 2024 to 2034

Figure 44: North America Market Y-o-Y Growth (%) Projections by End-User, 2024 to 2034

Figure 45: North America Market Attractiveness by Type, 2024 to 2034

Figure 46: North America Market Attractiveness by Implementation, 2024 to 2034

Figure 47: North America Market Attractiveness by End-User, 2024 to 2034

Figure 48: North America Market Attractiveness by Country, 2024 to 2034

Figure 49: Latin America Market Value (US$ Million) by Type, 2024 to 2034

Figure 50: Latin America Market Value (US$ Million) by Implementation, 2024 to 2034

Figure 51: Latin America Market Value (US$ Million) by End-User, 2024 to 2034

Figure 52: Latin America Market Value (US$ Million) by Country, 2024 to 2034

Figure 53: Latin America Market Value (US$ Million) Analysis by Country, 2019 to 2034

Figure 54: Latin America Market Volume (Units) Analysis by Country, 2019 to 2034

Figure 55: Latin America Market Value Share (%) and BPS Analysis by Country, 2024 to 2034

Figure 56: Latin America Market Y-o-Y Growth (%) Projections by Country, 2024 to 2034

Figure 57: Latin America Market Value (US$ Million) Analysis by Type, 2019 to 2034

Figure 58: Latin America Market Volume (Units) Analysis by Type, 2019 to 2034

Figure 59: Latin America Market Value Share (%) and BPS Analysis by Type, 2024 to 2034

Figure 60: Latin America Market Y-o-Y Growth (%) Projections by Type, 2024 to 2034

Figure 61: Latin America Market Value (US$ Million) Analysis by Implementation, 2019 to 2034

Figure 62: Latin America Market Volume (Units) Analysis by Implementation, 2019 to 2034

Figure 63: Latin America Market Value Share (%) and BPS Analysis by Implementation, 2024 to 2034

Figure 64: Latin America Market Y-o-Y Growth (%) Projections by Implementation, 2024 to 2034

Figure 65: Latin America Market Value (US$ Million) Analysis by End-User, 2019 to 2034

Figure 66: Latin America Market Volume (Units) Analysis by End-User, 2019 to 2034

Figure 67: Latin America Market Value Share (%) and BPS Analysis by End-User, 2024 to 2034

Figure 68: Latin America Market Y-o-Y Growth (%) Projections by End-User, 2024 to 2034

Figure 69: Latin America Market Attractiveness by Type, 2024 to 2034

Figure 70: Latin America Market Attractiveness by Implementation, 2024 to 2034

Figure 71: Latin America Market Attractiveness by End-User, 2024 to 2034

Figure 72: Latin America Market Attractiveness by Country, 2024 to 2034

Figure 73: Western Europe Market Value (US$ Million) by Type, 2024 to 2034

Figure 74: Western Europe Market Value (US$ Million) by Implementation, 2024 to 2034

Figure 75: Western Europe Market Value (US$ Million) by End-User, 2024 to 2034

Figure 76: Western Europe Market Value (US$ Million) by Country, 2024 to 2034

Figure 77: Western Europe Market Value (US$ Million) Analysis by Country, 2019 to 2034

Figure 78: Western Europe Market Volume (Units) Analysis by Country, 2019 to 2034

Figure 79: Western Europe Market Value Share (%) and BPS Analysis by Country, 2024 to 2034

Figure 80: Western Europe Market Y-o-Y Growth (%) Projections by Country, 2024 to 2034

Figure 81: Western Europe Market Value (US$ Million) Analysis by Type, 2019 to 2034

Figure 82: Western Europe Market Volume (Units) Analysis by Type, 2019 to 2034

Figure 83: Western Europe Market Value Share (%) and BPS Analysis by Type, 2024 to 2034

Figure 84: Western Europe Market Y-o-Y Growth (%) Projections by Type, 2024 to 2034

Figure 85: Western Europe Market Value (US$ Million) Analysis by Implementation, 2019 to 2034

Figure 86: Western Europe Market Volume (Units) Analysis by Implementation, 2019 to 2034

Figure 87: Western Europe Market Value Share (%) and BPS Analysis by Implementation, 2024 to 2034

Figure 88: Western Europe Market Y-o-Y Growth (%) Projections by Implementation, 2024 to 2034

Figure 89: Western Europe Market Value (US$ Million) Analysis by End-User, 2019 to 2034

Figure 90: Western Europe Market Volume (Units) Analysis by End-User, 2019 to 2034

Figure 91: Western Europe Market Value Share (%) and BPS Analysis by End-User, 2024 to 2034

Figure 92: Western Europe Market Y-o-Y Growth (%) Projections by End-User, 2024 to 2034

Figure 93: Western Europe Market Attractiveness by Type, 2024 to 2034

Figure 94: Western Europe Market Attractiveness by Implementation, 2024 to 2034

Figure 95: Western Europe Market Attractiveness by End-User, 2024 to 2034

Figure 96: Western Europe Market Attractiveness by Country, 2024 to 2034

Figure 97: Eastern Europe Market Value (US$ Million) by Type, 2024 to 2034

Figure 98: Eastern Europe Market Value (US$ Million) by Implementation, 2024 to 2034

Figure 99: Eastern Europe Market Value (US$ Million) by End-User, 2024 to 2034

Figure 100: Eastern Europe Market Value (US$ Million) by Country, 2024 to 2034

Figure 101: Eastern Europe Market Value (US$ Million) Analysis by Country, 2019 to 2034

Figure 102: Eastern Europe Market Volume (Units) Analysis by Country, 2019 to 2034

Figure 103: Eastern Europe Market Value Share (%) and BPS Analysis by Country, 2024 to 2034

Figure 104: Eastern Europe Market Y-o-Y Growth (%) Projections by Country, 2024 to 2034

Figure 105: Eastern Europe Market Value (US$ Million) Analysis by Type, 2019 to 2034

Figure 106: Eastern Europe Market Volume (Units) Analysis by Type, 2019 to 2034

Figure 107: Eastern Europe Market Value Share (%) and BPS Analysis by Type, 2024 to 2034

Figure 108: Eastern Europe Market Y-o-Y Growth (%) Projections by Type, 2024 to 2034

Figure 109: Eastern Europe Market Value (US$ Million) Analysis by Implementation, 2019 to 2034

Figure 110: Eastern Europe Market Volume (Units) Analysis by Implementation, 2019 to 2034

Figure 111: Eastern Europe Market Value Share (%) and BPS Analysis by Implementation, 2024 to 2034

Figure 112: Eastern Europe Market Y-o-Y Growth (%) Projections by Implementation, 2024 to 2034

Figure 113: Eastern Europe Market Value (US$ Million) Analysis by End-User, 2019 to 2034

Figure 114: Eastern Europe Market Volume (Units) Analysis by End-User, 2019 to 2034

Figure 115: Eastern Europe Market Value Share (%) and BPS Analysis by End-User, 2024 to 2034

Figure 116: Eastern Europe Market Y-o-Y Growth (%) Projections by End-User, 2024 to 2034

Figure 117: Eastern Europe Market Attractiveness by Type, 2024 to 2034

Figure 118: Eastern Europe Market Attractiveness by Implementation, 2024 to 2034

Figure 119: Eastern Europe Market Attractiveness by End-User, 2024 to 2034

Figure 120: Eastern Europe Market Attractiveness by Country, 2024 to 2034

Figure 121: South Asia and Pacific Market Value (US$ Million) by Type, 2024 to 2034

Figure 122: South Asia and Pacific Market Value (US$ Million) by Implementation, 2024 to 2034

Figure 123: South Asia and Pacific Market Value (US$ Million) by End-User, 2024 to 2034

Figure 124: South Asia and Pacific Market Value (US$ Million) by Country, 2024 to 2034

Figure 125: South Asia and Pacific Market Value (US$ Million) Analysis by Country, 2019 to 2034

Figure 126: South Asia and Pacific Market Volume (Units) Analysis by Country, 2019 to 2034

Figure 127: South Asia and Pacific Market Value Share (%) and BPS Analysis by Country, 2024 to 2034

Figure 128: South Asia and Pacific Market Y-o-Y Growth (%) Projections by Country, 2024 to 2034

Figure 129: South Asia and Pacific Market Value (US$ Million) Analysis by Type, 2019 to 2034

Figure 130: South Asia and Pacific Market Volume (Units) Analysis by Type, 2019 to 2034

Figure 131: South Asia and Pacific Market Value Share (%) and BPS Analysis by Type, 2024 to 2034

Figure 132: South Asia and Pacific Market Y-o-Y Growth (%) Projections by Type, 2024 to 2034

Figure 133: South Asia and Pacific Market Value (US$ Million) Analysis by Implementation, 2019 to 2034

Figure 134: South Asia and Pacific Market Volume (Units) Analysis by Implementation, 2019 to 2034

Figure 135: South Asia and Pacific Market Value Share (%) and BPS Analysis by Implementation, 2024 to 2034

Figure 136: South Asia and Pacific Market Y-o-Y Growth (%) Projections by Implementation, 2024 to 2034

Figure 137: South Asia and Pacific Market Value (US$ Million) Analysis by End-User, 2019 to 2034

Figure 138: South Asia and Pacific Market Volume (Units) Analysis by End-User, 2019 to 2034

Figure 139: South Asia and Pacific Market Value Share (%) and BPS Analysis by End-User, 2024 to 2034

Figure 140: South Asia and Pacific Market Y-o-Y Growth (%) Projections by End-User, 2024 to 2034

Figure 141: South Asia and Pacific Market Attractiveness by Type, 2024 to 2034

Figure 142: South Asia and Pacific Market Attractiveness by Implementation, 2024 to 2034

Figure 143: South Asia and Pacific Market Attractiveness by End-User, 2024 to 2034

Figure 144: South Asia and Pacific Market Attractiveness by Country, 2024 to 2034

Figure 145: East Asia Market Value (US$ Million) by Type, 2024 to 2034

Figure 146: East Asia Market Value (US$ Million) by Implementation, 2024 to 2034

Figure 147: East Asia Market Value (US$ Million) by End-User, 2024 to 2034

Figure 148: East Asia Market Value (US$ Million) by Country, 2024 to 2034

Figure 149: East Asia Market Value (US$ Million) Analysis by Country, 2019 to 2034

Figure 150: East Asia Market Volume (Units) Analysis by Country, 2019 to 2034

Figure 151: East Asia Market Value Share (%) and BPS Analysis by Country, 2024 to 2034

Figure 152: East Asia Market Y-o-Y Growth (%) Projections by Country, 2024 to 2034

Figure 153: East Asia Market Value (US$ Million) Analysis by Type, 2019 to 2034

Figure 154: East Asia Market Volume (Units) Analysis by Type, 2019 to 2034

Figure 155: East Asia Market Value Share (%) and BPS Analysis by Type, 2024 to 2034

Figure 156: East Asia Market Y-o-Y Growth (%) Projections by Type, 2024 to 2034

Figure 157: East Asia Market Value (US$ Million) Analysis by Implementation, 2019 to 2034

Figure 158: East Asia Market Volume (Units) Analysis by Implementation, 2019 to 2034

Figure 159: East Asia Market Value Share (%) and BPS Analysis by Implementation, 2024 to 2034

Figure 160: East Asia Market Y-o-Y Growth (%) Projections by Implementation, 2024 to 2034

Figure 161: East Asia Market Value (US$ Million) Analysis by End-User, 2019 to 2034

Figure 162: East Asia Market Volume (Units) Analysis by End-User, 2019 to 2034

Figure 163: East Asia Market Value Share (%) and BPS Analysis by End-User, 2024 to 2034

Figure 164: East Asia Market Y-o-Y Growth (%) Projections by End-User, 2024 to 2034

Figure 165: East Asia Market Attractiveness by Type, 2024 to 2034

Figure 166: East Asia Market Attractiveness by Implementation, 2024 to 2034

Figure 167: East Asia Market Attractiveness by End-User, 2024 to 2034

Figure 168: East Asia Market Attractiveness by Country, 2024 to 2034

Figure 169: Middle East and Africa Market Value (US$ Million) by Type, 2024 to 2034

Figure 170: Middle East and Africa Market Value (US$ Million) by Implementation, 2024 to 2034

Figure 171: Middle East and Africa Market Value (US$ Million) by End-User, 2024 to 2034

Figure 172: Middle East and Africa Market Value (US$ Million) by Country, 2024 to 2034

Figure 173: Middle East and Africa Market Value (US$ Million) Analysis by Country, 2019 to 2034

Figure 174: Middle East and Africa Market Volume (Units) Analysis by Country, 2019 to 2034

Figure 175: Middle East and Africa Market Value Share (%) and BPS Analysis by Country, 2024 to 2034

Figure 176: Middle East and Africa Market Y-o-Y Growth (%) Projections by Country, 2024 to 2034

Figure 177: Middle East and Africa Market Value (US$ Million) Analysis by Type, 2019 to 2034

Figure 178: Middle East and Africa Market Volume (Units) Analysis by Type, 2019 to 2034

Figure 179: Middle East and Africa Market Value Share (%) and BPS Analysis by Type, 2024 to 2034

Figure 180: Middle East and Africa Market Y-o-Y Growth (%) Projections by Type, 2024 to 2034

Figure 181: Middle East and Africa Market Value (US$ Million) Analysis by Implementation, 2019 to 2034

Figure 182: Middle East and Africa Market Volume (Units) Analysis by Implementation, 2019 to 2034

Figure 183: Middle East and Africa Market Value Share (%) and BPS Analysis by Implementation, 2024 to 2034

Figure 184: Middle East and Africa Market Y-o-Y Growth (%) Projections by Implementation, 2024 to 2034

Figure 185: Middle East and Africa Market Value (US$ Million) Analysis by End-User, 2019 to 2034

Figure 186: Middle East and Africa Market Volume (Units) Analysis by End-User, 2019 to 2034

Figure 187: Middle East and Africa Market Value Share (%) and BPS Analysis by End-User, 2024 to 2034

Figure 188: Middle East and Africa Market Y-o-Y Growth (%) Projections by End-User, 2024 to 2034

Figure 189: Middle East and Africa Market Attractiveness by Type, 2024 to 2034

Figure 190: Middle East and Africa Market Attractiveness by Implementation, 2024 to 2034

Figure 191: Middle East and Africa Market Attractiveness by End-User, 2024 to 2034

Figure 192: Middle East and Africa Market Attractiveness by Country, 2024 to 2034

Frequently Asked Questions

What was the global HVAC Control System market size in 2024?

The HVAC control system market was valued at USD 20.9 billion in 2024.

What would be the HVAC Control System market outlook by 2034?

By 2034, the global HVAC control system market was valued at USD 52.6 billion.

What CAGR did the HVAC Control System market exhibit over the last five years?

The HVAC control system market exhibited a 10.7% CAGR over the last five years.

What is the Growth Potential of the Global HVAC Control System Market?

The market is anticipated to expand at a CAGR of 9.7% from 2024 to 2034.

Which type dominates the HVAC Control System market?

The temperature and humidity control type dominates the market with a CAGR of 9.4%.

Explore Similar Insights

Future Market Insights

HVAC Control System Market