The global building automation system market is projected to reach USD 114 billion by 2035, recording an absolute increase of USD 57.2 billion over the forecast period. The market is valued at USD 56.9 billion in 2025 and is projected to grow at a CAGR of 7.2% during the forecast period. The overall market size is expected to grow by 2.0 times during the same period, supported by increasing demand for smart infrastructure integration worldwide, driving demand for efficient building management solutions and increasing investments in energy optimization and digital transformation projects globally. However, high capital investment requirements and complex system integration challenges may pose challenges to market expansion.
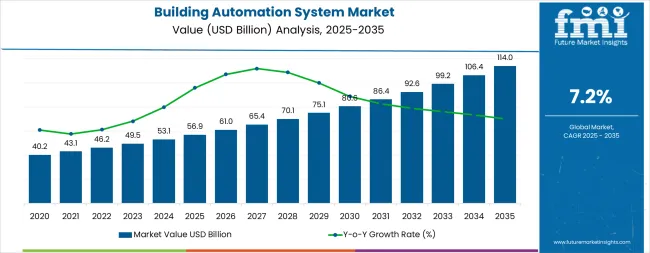
Between 2025 and 2030, the building automation system market is projected to expand from USD 56.9 billion to USD 82.7 billion, resulting in a value increase of USD 25.8 billion, which represents 45.1% of the total forecast growth for the decade. This phase of development will be shaped by rising demand for energy-efficient building solutions and smart infrastructure applications, product innovation in cloud-based platforms and AI-powered diagnostics, as well as expanding integration with environmental compliance and digital transformation initiatives. Companies are establishing competitive positions through investment in advanced software platforms, integrated control solutions, and strategic market expansion across commercial, residential, and government applications.
From 2030 to 2035, the market is forecast to grow from USD 82.7 billion to USD 114 billion, adding another USD 31.4 billion, which constitutes 54.9% of the overall ten-year expansion. This period is expected to be characterized by the expansion of specialized automation systems, including advanced AI-driven formulations and integrated application solutions tailored for specific building requirements, strategic collaborations between technology providers and end-user industries, and an enhanced focus on operational efficiency and environmental performance optimization. The growing emphasis on smart city development and energy management optimization will drive demand for advanced, high-performance building automation solutions across diverse commercial and residential applications.
| Metric | Value |
|---|---|
| Market Value (2025) | USD 56.9 billion |
| Market Forecast Value (2035) | USD 114 billion |
| Forecast CAGR (2025-2035) | 7.2% |
The building automation system market grows by enabling property owners to achieve superior operational efficiency and energy cost reduction in building facilities, ranging from small-scale commercial properties to mega infrastructure complexes. Building operators face mounting pressure to improve energy performance and environmental compliance, with building automation solutions typically providing 30-50% improvement in energy efficiency compared to conventional systems, making advanced automation essential for competitive facility management operations. The commercial real estate industry's need for maximum operational efficiency creates demand for advanced automation solutions that can minimize waste, enhance comfort, and ensure consistent performance across diverse building environments. Government initiatives promoting energy efficiency and smart city development drive adoption in commercial, residential, and government applications, where operational performance has a direct impact on energy costs and environmental compliance. However, high initial investment costs and the complexity of achieving consistent performance across different building environments may limit adoption rates among cost-sensitive developers and regions with limited technical expertise.
The market is segmented by product type, application, system type, and region. By product type, the market is divided into hardware, software, and services. Based on application, the market is categorized into commercial, residential, government, and others. By system type, the market is classified into security & surveillance, HVAC, lighting solutions, BEMS, and others. Regionally, the market is divided into North America, Latin America, Western Europe, Eastern Europe, East Asia, South Asia Pacific, and Middle East & Africa.
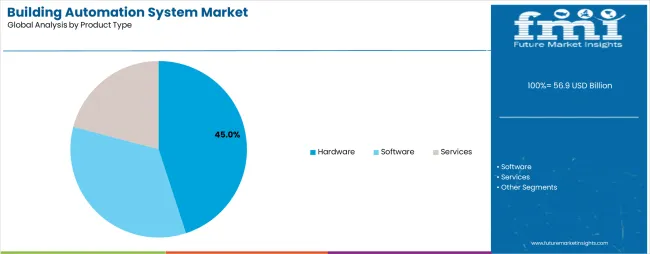
The software segment represents the fastest-growing force in the building automation system market, projected to expand at a CAGR of 7.9% through 2035. This advanced product category encompasses formulations featuring centralized dashboard capabilities, including digital twin integration and AI-powered diagnostic systems that enable superior operational management and enhanced performance optimization across diverse building environments. The software segment's rapid growth stems from its exceptional performance capabilities in real-time monitoring and control applications, with platforms capable of managing complex building systems while maintaining consistent performance and data analytics across diverse operational conditions.
The hardware segment maintains substantial market presence, serving building owners who require physical infrastructure for automation system deployment and control applications. These components offer reliable performance for general-purpose building automation while providing sufficient functionality to meet basic operational requirements in commercial and residential applications.
Key technological advantages driving the software segment include:
Commercial applications dominate the building automation system market with approximately 50.0% market share in 2025, reflecting the critical role of office buildings, retail centers, and industrial facilities in driving automation demand and supporting advanced building management initiatives. The commercial segment's market leadership is reinforced by increasing energy efficiency requirements, standardized system implementations, and rising demand for cost-effective operational optimization that directly correlates with facility performance and tenant satisfaction.
The residential segment represents the fastest-growing application category, capturing significant market momentum through specialized requirements for smart home systems, energy management solutions, and integrated comfort control operations. This segment benefits from growing demand for connected home technologies that meet efficiency, convenience, and security requirements in modern living applications.
The government segment accounts for substantial market share, serving public sector facilities requiring reliable automation solutions. The others segment captures market share through specialized applications including healthcare, educational, and industrial facilities.
Key market dynamics supporting application growth include:
Building Energy Management Systems (BEMS) demonstrate the strongest growth trajectory in the building automation system market with a projected CAGR of 7.8% through 2035, driven by increasing focus on energy optimization and centralized building performance management. The BEMS segment's rapid expansion reflects the critical importance of integrated energy monitoring, real-time performance analytics, and automated optimization systems in meeting operational efficiency and environmental compliance requirements across commercial and institutional facilities.
HVAC systems maintain the largest market share due to their fundamental role in building comfort and energy consumption management, serving as the primary automation application in most building types. This segment benefits from continuous technological advancement in smart controls, occupancy sensing, and environmental optimization systems.
The lighting solutions segment shows steady growth through LED integration, daylight harvesting, and automated control systems that provide significant energy savings. Security & surveillance systems represent essential building automation components, while others category including fire safety, access control, and energy metering systems continue expanding through integrated platform development.
Key factors supporting BEMS growth include:
The market is driven by three concrete demand factors tied to energy efficiency and operational optimization outcomes. First, global energy efficiency regulations and smart infrastructure development create increasing demand for high-performance building automation solutions, with global urbanization projected to reach 68% by 2050, requiring advanced technology solutions for maximum operational efficiency. Second, modernization of legacy building systems and environmental compliance drive the adoption of intelligent automation technologies, with building operators seeking 30-50% improvement in energy performance and regulatory compliance enhancement. Third, technological advancements in IoT integration and AI-powered analytics enable more effective and responsive building management solutions that reduce operational costs while improving long-term performance and occupant satisfaction.
Market restraints include high initial capital investment that can impact project feasibility and return on investment calculations, particularly during periods of economic uncertainty or budget constraints affecting key technology adoption. System integration complexity poses another significant challenge, as achieving seamless operation across different building systems and legacy infrastructure requires specialized expertise and comprehensive planning systems, potentially causing project delays and increased implementation costs. Technical expertise shortage in automation system design and maintenance creates additional challenges for building owners, demanding ongoing investment in training capabilities and compliance with varying regional building standards.
Key trends indicate accelerated adoption in emerging markets, particularly China, India, and Brazil, where rapid urbanization and infrastructure development drive comprehensive building automation system deployment. Technology advancement trends toward AI integration with enhanced predictive analytics, energy optimization algorithms, and multi-system integration capabilities enable next-generation product development that addresses multiple performance requirements simultaneously. However, the market could face disruption if alternative building management technologies or significant changes in energy infrastructure minimize reliance on traditional automation system solutions.
| Country | CAGR (2025-2035) |
|---|---|
| United States | 7.3% |
| Germany | 6.9% |
| Japan | 7.0% |
| United Kingdom | 6.8% |
| France | 6.7% |
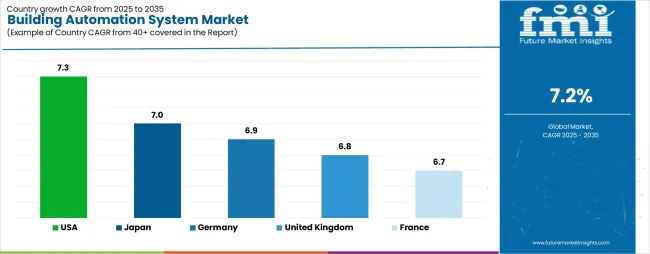
The building automation system market is gaining momentum worldwide, with the United States taking the lead thanks to comprehensive energy efficiency policies and advanced smart building initiatives. Close behind, Germany benefits from robust industrial infrastructure and environmental compliance requirements, positioning itself as a strategic growth hub in the European region. Japan shows steady advancement, where integration of advanced building technologies strengthens its role in the Asian smart infrastructure development. The United Kingdom is focusing on net-zero building targets and modernization programs, signaling an ambition to capitalize on growing opportunities in European green building markets. Meanwhile, France stands out for its advanced regulatory frameworks and building efficiency requirements, recording consistent progress in automated building management. Together, the United States and Germany anchor the global expansion story, while the rest build stability and diversity into the market's growth path.
The report covers an in-depth analysis of 40+ countries, the top-performing countries are highlighted below.
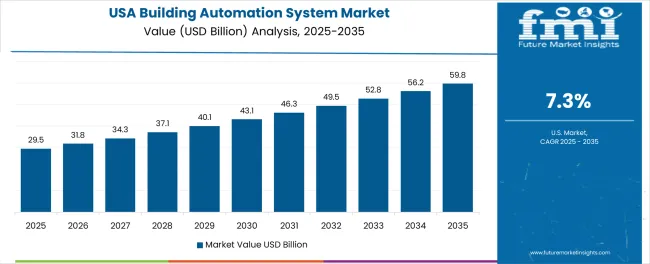
The United States demonstrates the strongest growth potential in the Building Automation System Market with a CAGR of 7.3% through 2035. The country's leadership position stems from comprehensive energy efficiency legislation, government-backed infrastructure modernization programs, and aggressive smart city development targets, driving the adoption of high-performance building automation systems. Growth is concentrated in major metropolitan regions, including California, Texas, New York, and Florida, where commercial developers and government agencies are implementing advanced automation solutions for enhanced energy performance and operational competitiveness. Distribution channels through established technology integrators and direct manufacturer relationships expand deployment across commercial buildings, government facilities, and residential developments. The country's technology leadership strategy provides policy support for advanced building system development, including high-performance automation platform adoption.
Key market factors:
In Berlin, Munich, Hamburg, and Frankfurt, the adoption of building automation systems is accelerating across commercial facilities and government buildings, driven by energy efficiency targets and comprehensive environmental compliance initiatives. The market demonstrates strong growth momentum with a CAGR of 6.9% through 2035, linked to comprehensive building modernization programs and increasing focus on operational efficiency solutions. German building owners are implementing advanced automation systems and energy management platforms to enhance operational performance while meeting stringent environmental requirements in domestic and European markets. The country's industrial excellence programs create demand for high-performance building solutions, while increasing emphasis on energy optimization drives adoption of advanced control systems and monitoring technologies.
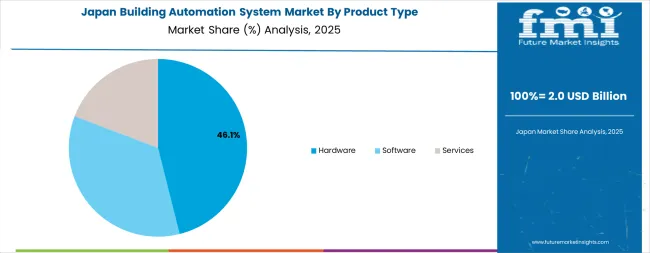
Japan's advanced building industry demonstrates sophisticated implementation of automation systems, with documented case studies showing efficiency improvements in commercial applications through optimized building management solutions. The country's technology infrastructure in major urban centers, including Tokyo, Osaka, Nagoya, and Yokohama, showcases integration of advanced automation technologies with existing building systems, leveraging expertise in precision engineering and smart technology development. Japanese building owners emphasize quality standards and seismic resilience, creating demand for high-performance automation solutions that support safety initiatives and regulatory requirements. The market maintains steady growth through focus on technological innovation and operational efficiency, with a CAGR of 7.0% through 2035.
Key development areas:
The United Kingdom's market expansion is driven by diverse building applications, including commercial automation in London and Manchester regions, residential development in Birmingham and Leeds, and comprehensive infrastructure modernization across multiple urban areas. The country demonstrates promising growth potential with a CAGR of 6.8% through 2035, supported by national net-zero programs and regional building efficiency initiatives. British building developers face implementation challenges related to retrofitting existing infrastructure and achieving performance standards, requiring system upgrade approaches and technology integration support. However, growing environmental targets and operational efficiency requirements create compelling business cases for building automation system adoption, particularly in commercial and government sectors where performance optimization has a direct impact on operational competitiveness.
Market characteristics:
France's market leads in advanced building integration based on comprehensive regulatory frameworks and sophisticated energy management applications for enhanced operational characteristics. The country shows solid potential with a CAGR of 6.7% through 2035, driven by building modernization programs and advanced environmental initiatives across major urban regions, including Île-de-France, Auvergne-Rhône-Alpes, Provence-Alpes-Côte d'Azur, and Nouvelle-Aquitaine. French building owners are adopting advanced automation systems for operational optimization and regulatory compliance, particularly in regions with environmental mandates and advanced building facilities requiring superior performance differentiation. Technology deployment channels through established system integrators and direct technology relationships expand coverage across commercial buildings and government facilities.
Leading market segments:
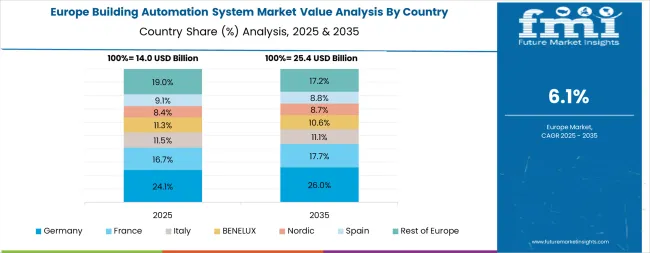
The building automation system market in Europe is projected to grow from USD 16.2 billion in 2025 to USD 26.8 billion by 2035, registering a CAGR of 5.1% over the forecast period. Germany is expected to maintain its leadership position with a 32.5% market share in 2025, declining slightly to 31.8% by 2035, supported by its extensive industrial infrastructure and major commercial centers, including Bavaria, North Rhine-Westphalia, and Baden-Württemberg technology hubs.
France follows with a 18.7% share in 2025, projected to reach 19.2% by 2035, driven by comprehensive building efficiency programs and advanced regulatory initiatives implementing automation technologies. The United Kingdom holds a 16.4% share in 2025, expected to maintain 16.1% by 2035 through ongoing building modernization and energy performance development. Italy commands a 12.3% share, while Spain accounts for 8.9% in 2025. The Rest of Europe region is anticipated to gain momentum, expanding its collective share from 11.2% to 12.6% by 2035, attributed to increasing building automation adoption in Nordic countries and emerging Eastern European markets implementing advanced building management programs.
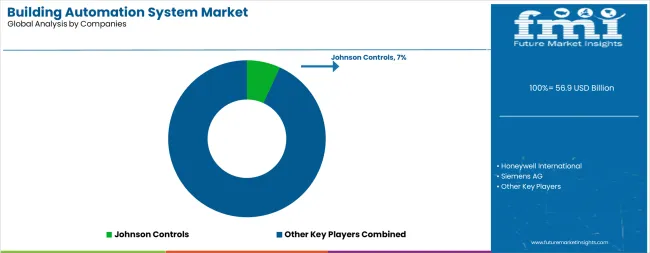
The building automation system market features approximately 15-20 meaningful players with moderate concentration, where the top three companies control roughly 40-45% of global market share through established technology platforms and extensive system integration relationships. Competition centers on technological innovation, system reliability, and comprehensive service offerings rather than price competition alone.
Market leaders include Johnson Controls, Honeywell International, and Siemens AG, which maintain competitive advantages through comprehensive automation solution portfolios, global service networks, and deep expertise in the building technology and energy management sectors, creating high switching costs for customers. These companies leverage research and development capabilities and ongoing technical support relationships to defend market positions while expanding into adjacent smart building and IoT applications.
Challengers encompass Schneider Electric and ABB, which compete through specialized automation solutions and strong regional presence in key commercial markets. Technology specialists, including General Electric, Legrand, and Control4 Corporation, focus on specific system applications or vertical markets, offering differentiated capabilities in energy management, lighting control, and residential automation systems.
Regional players and emerging technology providers create competitive pressure through innovative solutions and rapid customization capabilities, particularly in high-growth markets including China, India, and Brazil, where local presence provides advantages in customer service and regulatory compliance. Market dynamics favor companies that combine advanced automation technologies with comprehensive service offerings that address the complete system lifecycle from design development through ongoing performance optimization.
Building automation systems represent advanced technology solutions that enable building owners to achieve 30-50% improvement in energy efficiency compared to conventional systems, delivering superior operational performance and cost reduction with enhanced control capabilities in demanding commercial and residential applications. With the market projected to grow from USD 56.9 billion in 2025 to USD 114.1 billion by 2035 at a 7.2% CAGR, these technology systems offer compelling advantages - enhanced energy efficiency, customizable system configurations, and operational intelligence - making them essential for commercial facilities, residential developments, and government buildings seeking alternatives to inefficient manual systems that compromise performance through excessive energy consumption. Scaling market adoption and technological advancement requires coordinated action across building codes, energy standards development, technology manufacturers, real estate industries, and smart infrastructure investment capital.
How Governments Could Spur Local Production and Adoption?
How Industry Bodies Could Support Market Development?
How OEMs and Technology Players Could Strengthen the Ecosystem?
How Suppliers Could Navigate the Shift?
How Investors and Financial Enablers Could Unlock Value?
| Items | Values |
|---|---|
| Quantitative Units | USD 56.9 billion |
| Product Type | Hardware, Software, Services |
| Application | Commercial, Residential, Government, Others |
| System Type | Security & Surveillance, HVAC, Lighting Solutions, BEMS, Others |
| Regions Covered | North America, Latin America, Western Europe, Eastern Europe, East Asia, South Asia Pacific, Middle East & Africa |
| Country Covered | United States, Germany, Japan, United Kingdom, France, and 40+ countries |
| Key Companies Profiled | Johnson Controls, Honeywell International, Siemens AG, Schneider Electric, ABB, General Electric, Legrand, Control4 Corporation |
| Additional Attributes | Dollar sales by product type, application, and system type categories, regional adoption trends across North America, Western Europe, and East Asia, competitive landscape with technology providers and system integrators, building facility requirements and specifications, integration with energy efficiency initiatives and smart building systems, innovations in automation technology and control systems, and development of specialized configurations with performance and reliability capabilities. |
The global building automation system market is estimated to be valued at USD 56.9 billion in 2025.
The market size for the building automation system market is projected to reach USD 114.0 billion by 2035.
The building automation system market is expected to grow at a 7.2% CAGR between 2025 and 2035.
The key product types in building automation system market are hardware, software and services.
In terms of application, commercial segment to command 45.0% share in the building automation system market in 2025.


Full Research Suite comprises of:
Market outlook & trends analysis
Interviews & case studies
Strategic recommendations
Vendor profiles & capabilities analysis
5-year forecasts
8 regions and 60+ country-level data splits
Market segment data splits
12 months of continuous data updates
DELIVERED AS:
PDF EXCEL ONLINE
Building Automation System Industry Analysis in Korea Analysis - Size, Share, and Forecast Outlook 2025 to 2035
Leading Providers & Market Share in Building Automation System
Japan Building Automation System Market Analysis & Forecast by System, Application, and Region Through 2035
Western Europe Building Automation System Market by System, Application and Region - Forecast for 2025 to 2035
Building Information Modeling Market Size and Share Forecast Outlook 2025 to 2035
Building Envelope Market Size and Share Forecast Outlook 2025 to 2035
Building Access Control Security Market Size and Share Forecast Outlook 2025 to 2035
Building Materials Market Size and Share Forecast Outlook 2025 to 2035
Building Maintenance Unit (BMU) Market Size and Share Forecast Outlook 2025 to 2035
Building Energy Management Solutions Market Size and Share Forecast Outlook 2025 to 2035
Building Thermal Insulation Market Growth - Trends & Forecast 2025 to 2035
Building Integrated Photovoltaics Market - Solar & Architecture
Building Information Management (BIM) Market Analysis – Trends & Forecast 2024-2034
In-building Wireless Market Forecast and Outlook 2025 to 2035
Smart Building Delivery Robot Market Size and Share Forecast Outlook 2025 to 2035
Smart Building Solutions Market Size and Share Forecast Outlook 2025 to 2035
Smart Building Market Size and Share Forecast Outlook 2025 to 2035
Green Building Materials Market Analysis by Type, Application, End-user and Region: Forecast for 2025 and 2035
PCR Tire Building Machine Market Size and Share Forecast Outlook 2025 to 2035
Bio-Based Building Materials Market Size and Share Forecast Outlook 2025 to 2035

Thank you!
You will receive an email from our Business Development Manager. Please be sure to check your SPAM/JUNK folder too.
Chat With
MaRIA