Reports

- Global Locations -

Headquarters

Future Market Insights, Inc.

Christiana Corporate, 200
Continental Drive, Suite 401,
Newark, Delaware - 19713,
United States

T: +1-845-579-5705

Americas

Future Market Insights, Inc.

616 Corporate Way, Suite 2-9018,
Valley Cottage, NY 10989, United States

T: +1-347-918-3531

MEA

Future Market Insights

1602-6 Jumeirah Bay X2 Tower, Plot No: JLT-PH2-X2A,
Jumeirah Lakes Towers, Dubai,
United Arab Emirates

Europe

Future Market Insights

3rd Floor, 207 Regent Street,
W1B 3HH London
United Kingdom

T: + 44 (0) 20 8123 9659
D: +44 (0) 20 3287 4268

Asia Pacific

Future Market Insights

Office No. 401-A, 4th Floor,
VANTAGE 9, S.No. 36/1/1,
Baner, Pune 411045, India

In-Building Wireless Market

In-Building Wireless Market Snapshot (2022-2032)

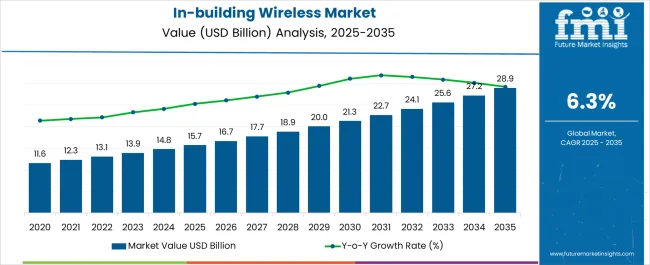
[303 Pages Report] The global in-building wireless market was worth $12,550 million in 2022 and is expected to be worth $23,450.5 million by 2032, growing at a CAGR of 6.5% over the forecast period.

  • The demand for better connectivity and enhanced network services has increased significantly as a result of bandwidth-intensive applications.
  • In-building wireless solutions have come a long way thanks to the integration of high-speed connectivity with novel technologies, and the ever-evolving technology ensures that the market will continue to grow.
  • The growing Bring Your Own Device (BYOD) trend among enterprises is attributed to market growth.
  • Increased data traffic, as well as increased smartphone penetration, will support market demand.

In light of the COVID-19 pandemic, smartphone penetration is increasing, as is data consumption, propelling the growth of in-building wireless systems. Technological advances are expected to drive the growth of in-building wireless systems in the coming years.

Data Points Key Statistics
In-building Wireless Market Value (2022) US$ 12,550 Million
In-building Wireless Market Forecast Value (2032) US$ 23,450.5 Million
In-building Wireless Market CAGR (2022 to 2032) 6.5% CAGR

Don't pay for what you don't need

Customize your report by selecting specific countries or regions and save 30%!

Keys To success of the In-Building Wireless Market

Rising data consumption is propelling the growth of in-building wireless systems.

The increasing consumption of data via smartphones is emerging as a lucrative trend, compelling market players to reconsider their traditional growth strategies. While many organisations focus on deploying LTE or 5G networks, players offering in-building wireless networks are focusing on mobile consumers.

On the other hand, rising network congestion and stringent government regulatory policies are encouraging the use of in-building wireless solutions.

Changing work culture dynamics are accelerating the expansion of in-building wireless systems.

Similarly, the growing trend of project-oriented work culture and 'carry your own devices' culture in many organisations will contribute to market growth. Growing government and private sector spending to improve connectivity in public places such as airports, train stations, and stadiums is also expected to provide lucrative opportunities for market growth.

The Internet's Widespread Penetration is Creating Investment Opportunity for In-Building Wireless Systems in North America

In-building networks provide high-speed connectivity, accelerating growth.

North America is expected to be the leading regional market, owing to widespread internet penetration and high demand among businesses for high-speed connectivity. According to the World Bank, nearly 55% of the US population has access to the internet, and the figure is growing every year.

This provides market players with a significant revenue opportunity to expand their services. In the in-building wireless market, North America is expected to hold 38.5% of the market.

Sudip Saha
Sudip Saha

Principal Consultant

Talk to Analyst

Find your sweet spots for generating winning opportunities in this market.

In Europe, Stand to Gain from In-Building Wireless Systems

Businesses that augment the deployment of wireless systems to increase Workflow Productivity

Network integration services are assisting enterprises in the region in upgrading, consolidating, and constructing a dynamic in-building wireless network infrastructure. The provision of design, deployment, integration testing, and customised solutions to enterprises is accelerating the growth of in-building wireless.

These services assist enterprises in maintaining resiliency, high performance, and high availability with a secure, always-on, scalable, and multi-technology network across businesses. Europe is expected to have a 22.1% market share in the in-building wireless market.

New Releases and Takeovers - Paramount Approaches Adopted by the Key Players

To stay ahead of the competition, important stakeholders are concentrating on developing new products and services and making investments significantly in research and development. Furthermore, strategic alliances, mergers, and acquisitions will continue to dominate the in-building wireless market's competitive landscape.

Alcatel Lucent and Jay Kay Systems Consulting Inc. will collaborate in September 2022 to provide expert IT solutions to Canadian businesses. By providing wireless products and network management solutions, the company focuses on providing innovative and cost-effective IT solutions.

AT & T announced in August 2022 that it is expanding its 5G network on FirstNet by building and improving connectivity for America's public with FirstNet as a wireless backup.

In-building wireless alludes to communication services that offer connectivity to the interiors of a building where signals from core infrastructure cannot be received. Due to bandwidth-intensive applications, the demand for better connectivity and enhanced network services has increased significantly over the years.

Along similar lines, with the integration of high-speed connectivity with novel technologies, in-building wireless solutions have come a long way in terms of efficiency and the ever-evolving technology is ensuring that the market will progress on a positive growth trajectory.

Get the data you need at a Fraction of the cost

Personalize your report by choosing insights you need
and save 40%!

In-Building Wireless Demand Analysis (2016 to 2021) Vs Market Outlook (2022 to 2032)

The global demand for in-building wireless market is projected to increase at a CAGR of 6.5% during the forecast period between 2022 and 2032, reaching a total of US$ 23,450.5 Million in 2032, according to a report from Future Market Insights (FMI). From 2016 to 2021, sales witnessed significant growth, registering a CAGR of 5.5%.

The COVID-19 pandemic changed the working model for workspaces on a large scale. In addition, the penetration of smartphones along with increasing consumption of data usage is propelling the growth of in-building wireless systems. In the upcoming years, technological advancements are expected to drive the growth of in-building wireless systems.

Which are Some Prominent Drivers of In-Building Wireless Market?

Increasing Data Consumption driving growth of In-Building Wireless Systems

Increasing consumption of data through smartphones is emerging as a lucrative trend and is asserting market players to rethink their conventional growth strategies. As several organizations focus on deploying LTE or 5G networks, players providing in-building wireless networks are focusing on directing their effort to mobile consumers.

On the other hand, rising congestion in the networks and strict government regulatory policies are also bolstering the adoption of in-building wireless solutions.

Changing dynamics of work culture bolstering growth of in-building wireless systems

Likewise, the growing trend of project-oriented work culture and ‘carry your own devices’ culture in numerous organizations will also complement the growth of the market. Backed by growing expenditure by government and private organizations to improve connectivity in public places, such as airports, train stations, and stadiums is also expected to bestow remunerative opportunities to market growth.

What are the Challenges Faced by the In-Building Wireless Market?

Issues related to installation restraining market growth of in-building wireless systems

There are several issues faced by in-building wireless service providers in the process of setting up the solutions. Furthermore, issues pertaining to the installation, designing, compatibility, and physical and signal interference are posing a major challenge to the overall growth of the market. In certain cases, customization of in-building wireless systems is proving to be difficult. This, in turn, is creating obstacles for the integration of the same.

Region-Wise Insights

Wide-Spread Penetration of Internet Creating Lucrative Opportunities for In-Building Wireless Systems in North America?

High-speed Connectivity provided by in-building networks accelerating growth

North America is expected to prevail as the leading regional market, on the back of wide-spread penetration of the internet and high demand among enterprises to offer high-speed connectivity. According to the World Bank, nearly 55% of the population of the US has access to the internet with the number growing annually.

This bestows a huge revenue opportunity to market players to expand their services. Thus, North America is expected to possess 38.5% market share for in-building wireless market in 2022.

Enterprises Benefitting from In-Building Wireless Systems in Europe?

Businesses maximizing the use of wireless systems for increasing Workflow Productivity

Network integration services are helping enterprises upgrade, consolidate, and build a dynamic in-building wireless network infrastructure in the region. The design, deployment, integration testing services, and customized solutions to enterprises is further accelerating the growth of in-building wireless.

These services are helping enterprises in maintaining resiliency, high-performance, and high availability with a secure, always-on, scalable, and multi-technology network across businesses. Thus, Europe is expected to hold 22.1% market share for in-building wireless market in 2022.

Category-Wise Insights

Dependency on Internet Boosting Usage of In-Building Wireless Solutions?

Commercialization of IT sectors driving growth of in-building wireless solutions

Numerous buildings are now pre-equipped to install in-building wireless solutions. As several enterprises are now highly reliant on the internet for their day-to-day operations, they are seeking solutions to increase productivity. Furthermore, commercialization of IT sectors along with penetration of 5G networks is positively influencing the demand for in-building wireless solutions.

On this premise, in-building wireless solutions are gaining remarkable traction among enterprises and is expected to possess 50% market share for in building wireless systems.

Start-up for Build-In Wireless Market

Key start-up players in build-in wireless market are Cambium Networks, Mimosa, Siklu, Tarana and H3C

  • H3C, a Chinese start-up provides high speed WIFI 6 routers. The company is focusing on advancing the use of WIFI to enhance the use of wireless technology to support the function of IoT devices.
  • Cambium Networks, a key player in the build-in wireless market is focusing on offering wireless fabric portfolio management and connectivity management to small, medium and large scale enterprises.

Market Competition

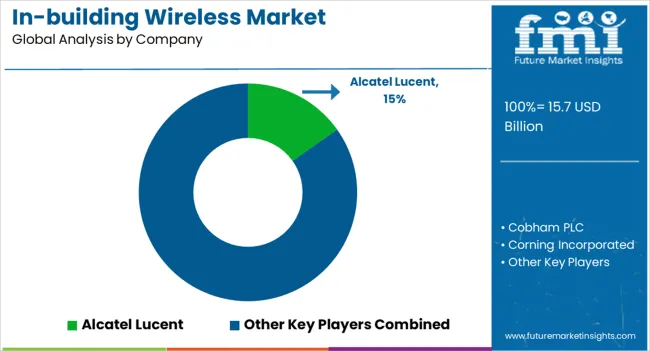
Key players in the in-building wireless market are Alcatel Lucent, Cobham PLC, Corning Incorporated, Smiths Group PLC, Verizon Communication, Inc., AT&T, Inc., Anixter Inc., Commscope, Inc., Ericsson, TE Connectivity, Ethertronics, Lord and Company Technologies, Betacom Incorporated, Lemko Corporation, Oberon Inc and Telecommunication Systems, Inc.

Key players are focusing on innovating novel services and hence significantly investing in research and development activities to cut through the competition. Furthermore, strategic partnerships, mergers, and acquisitions will continue to shape the competitive landscape of the in-building wireless market.

  • In September 2022, Alcatel Lucent and Jay Kay Systems Consulting Inc. have partnered to deliver expert IT solutions to Canada businesses. The company is focusing on offering innovation and cost-effective IT solutions by providing wireless products and network management solutions.
  • In August 2022, AT & T announced that the company is expanding its 5G network on FirstNet by building and enhancing connectivity for America’s public with FirstNet as a wireless backup.

Report Scope

Report Attributes Details
Market Value in 2022 US$ 12,550 Million
Market Value in 2032 US$ 23,450.5 Million
Growth Rate CAGR of 6.5% from 2022 to 2032
Base Year for Estimation 2021
Historical Data 2016 to 2021
Forecast Period 2022 to 2032
Quantitative Units Revenue in USD Million and CAGR from 2022-2032
Report Coverage Revenue Forecast, Volume Forecast, Company Ranking, Competitive Landscape, Growth Factors, Trends and Pricing Analysis
Segments Covered
  • Solutions
  • System Components
  • Business Models
  • End Users
  • Business Type
  • Building Size
  • Region
Regions Covered
  • North America
  • Latin America
  • Europe
  • East Asia
  • South Asia
  • Oceania
  • Middle East and Africa
Key Countries Profiled
  • U.S
  • Canada
  • Brazil
  • Argentina
  • Germany
  • U.K
  • France
  • Spain
  • Italy
  • Nordics
  • BENELUX
  • Australia & New Zealand
  • China
  • India
  • ASEAN
  • GCC
  • South Africa
Key Companies Profiled
  • Alcatel Lucent
  • Cobham PLC
  • Corning Incorporated
  • Smiths Group PLC
  • Verizon Communication, Inc.
  • AT&T, Inc., Anixter Inc.
  • Commscope, Inc.
  • Ericsson
  • TE Connectivity
  • Ethertronics
  • Lord and Company Technologies
  • Betacom Incorporated
  • Lemko Corporation
  • Oberon Inc.
  • Telecommunication Systems, Inc.
Customization Available Upon Request

Key Segments Profiled in the In-building Wireless Industry Survey

In-Building Wireless by Solutions:

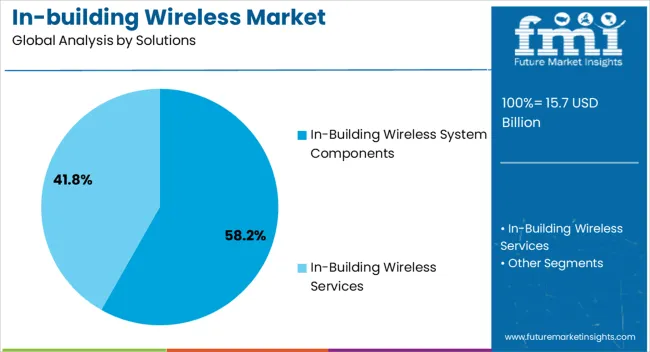
  • In-Building Wireless System Components
  • In-Building Wireless Services

In-Building Wireless by System Components:

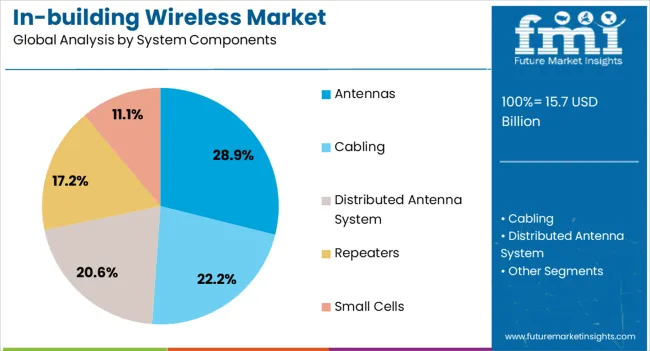
  • In-Building Wireless Antennas
  • In-Building Wireless Cabling
  • In-Building Wireless Distributed Antenna System
  • In-Building Wireless Repeaters
  • In-Building Wireless Small Cells

In-Building Wireless by Business Models:

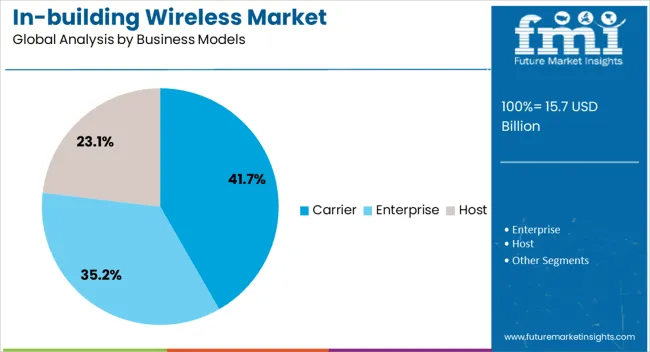
  • In-Building Wireless Carrier
  • In-Building Wireless Enterprise
  • In-Building Wireless Host

In-Building Wireless by End Users:

  • In-Building Wireless for Commercials
  • In-Building Wireless for Government
  • In-Building Wireless for Hospitals
  • In-Building Wireless for Industrial Uses
  • In-Building Wireless for Institutions
  • In-Building Wireless for Retail

In-Building Wireless by Business Type:

  • Existing In-Building Wireless Businesses
  • New In-Building Wireless Businesses

In-Building Wireless by Building Size:

  • In-Building Wireless for Large and Medium Buildings
  • In-Building Wireless for Small Buildings

In-Building Wireless by Region:

  • North America In-Building Wireless Market
  • Latin America In-Building Wireless Market
  • Europe In-Building Wireless Market
  • South Asia In-Building Wireless Market
  • East Asia In-Building Wireless Market
  • Oceania In-Building Wireless Market
  • Middle East & Africa In-Building Wireless Market

Frequently Asked Questions

FMI projects the global in-building wireless market to expand at a 6.5% value CAGR by 2032

North America is expected to possess 38.5% market share for in-building wireless market in 2022.

Alcatel Lucent, Cobham PLC, Corning Incorporated, Smiths Group PLC, Verizon Communication, Inc., AT&T, Inc., Anixter Inc., Commscope, Inc., Ericsson, TE Connectivity, Ethertronics, Lord and Company Technologies, Betacom Incorporated, Lemko Corporation, Oberon Inc and Telecommunication Systems, Inc are some prominent in-building wireless manufacturers.

Table of Content

1. Executive Summary

    1.1. Global Market Outlook

    1.2. Demand-side Trends

    1.3. Supply-side Trends

    1.4. Technology Roadmap Analysis

    1.5. Analysis and Recommendations

2. Market Overview

    2.1. Market Coverage / Taxonomy

    2.2. Market Definition / Scope / Limitations

3. Market Background

    3.1. Market Dynamics

        3.1.1. Drivers

        3.1.2. Restraints

        3.1.3. Opportunity

        3.1.4. Trends

    3.2. Scenario Forecast

        3.2.1. Demand in Optimistic Scenario

        3.2.2. Demand in Likely Scenario

        3.2.3. Demand in Conservative Scenario

    3.3. Opportunity Map Analysis

    3.4. Investment Feasibility Matrix

    3.5. PESTLE and Porter’s Analysis

    3.6. Regulatory Landscape

        3.6.1. By Key Regions

        3.6.2. By Key Countries

    3.7. Regional Parent Market Outlook

4. Global Market Analysis 2016-2021 and Forecast, 2022-2032

    4.1. Historical Market Size Value (US$ Mn) Analysis, 2016-2021

    4.2. Current and Future Market Size Value (US$ Mn) Projections, 2022-2032

        4.2.1. Y-o-Y Growth Trend Analysis

        4.2.2. Absolute $ Opportunity Analysis

5. Global Market Analysis 2016-2021 and Forecast 2022-2032, By Solutions

    5.1. Introduction / Key Findings

    5.2. Historical Market Size Value (US$ Mn) Analysis By Solutions, 2016-2021

    5.3. Current and Future Market Size Value (US$ Mn) Analysis and Forecast By Solutions, 2022-2032

        5.3.1. System Components

        5.3.2. Services

    5.4. Y-o-Y Growth Trend Analysis By Solutions, 2016-2021

    5.5. Absolute $ Opportunity Analysis By Solutions, 2022-2032

6. Global Market Analysis 2016-2021 and Forecast 2022-2032, By System Components

    6.1. Introduction / Key Findings

    6.2. Historical Market Size Value (US$ Mn) Analysis By System Components, 2016-2021

    6.3. Current and Future Market Size Value (US$ Mn) Analysis and Forecast By System Components, 2022-2032

        6.3.1. Antennas

        6.3.2. Cabling

        6.3.3. Distributed Antenna System

        6.3.4. Repeaters

        6.3.5. Small Cells

    6.4. Y-o-Y Growth Trend Analysis By System Components, 2016-2021

    6.5. Absolute $ Opportunity Analysis By System Components, 2022-2032

7. Global Market Analysis 2016-2021 and Forecast 2022-2032, By Business Models

    7.1. Introduction / Key Findings

    7.2. Historical Market Size Value (US$ Mn) Analysis By Business Models , 2016-2021

    7.3. Current and Future Market Size Value (US$ Mn) Analysis and Forecast By Business Models , 2022-2032

        7.3.1. Carrier

        7.3.2. Enterprise

        7.3.3. Host

    7.4. Y-o-Y Growth Trend Analysis By Business Models , 2016-2021

    7.5. Absolute $ Opportunity Analysis By Business Models , 2022-2032

8. Global Market Analysis 2016-2021 and Forecast 2022-2032, By End Users

    8.1. Introduction / Key Findings

    8.2. Historical Market Size Value (US$ Mn) Analysis By End Users, 2016-2021

    8.3. Current and Future Market Size Value (US$ Mn) Analysis and Forecast By End Users, 2022-2032

        8.3.1. Commercials

        8.3.2. Government

        8.3.3. Hospitals

        8.3.4. Industrial

        8.3.5. Institutions

        8.3.6. Retail

    8.4. Y-o-Y Growth Trend Analysis By End Users, 2016-2021

    8.5. Absolute $ Opportunity Analysis By End Users, 2022-2032

9. Global Market Analysis 2016-2021 and Forecast 2022-2032, By Business Type

    9.1. Introduction / Key Findings

    9.2. Historical Market Size Value (US$ Mn) Analysis By Business Type, 2016-2021

    9.3. Current and Future Market Size Value (US$ Mn) Analysis and Forecast By Business Type, 2022-2032

        9.3.1. Existing

        9.3.2. New

    9.4. Y-o-Y Growth Trend Analysis By Business Type, 2016-2021

    9.5. Absolute $ Opportunity Analysis By Business Type, 2022-2032

10. Global Market Analysis 2016-2021 and Forecast 2022-2032, By Building Size

    10.1. Introduction / Key Findings

    10.2. Historical Market Size Value (US$ Mn) Analysis By Building Size, 2016-2021

    10.3. Current and Future Market Size Value (US$ Mn) Analysis and Forecast By Building Size, 2022-2032

        10.3.1. Large and medium

        10.3.2. Small

    10.4. Y-o-Y Growth Trend Analysis By Building Size, 2016-2021

    10.5. Absolute $ Opportunity Analysis By Building Size, 2022-2032

11. Global Market Analysis 2016-2021 and Forecast 2022-2032, By Region

    11.1. Introduction

    11.2. Historical Market Size Value (US$ Mn) Analysis By Region, 2016-2021

    11.3. Current Market Size Value (US$ Mn) Analysis and Forecast By Region, 2022-2032

        11.3.1. North America

        11.3.2. Latin America

        11.3.3. Europe

        11.3.4. South Asia

        11.3.5. East Asia

        11.3.6. Oceania

        11.3.7. MEA

    11.4. Market Attractiveness Analysis By Region

12. North America Market Analysis 2016-2021 and Forecast 2022-2032, By Country

    12.1. Historical Market Size Value (US$ Mn) Trend Analysis By Market Taxonomy, 2016-2021

    12.2. Market Size Value (US$ Mn) Forecast By Market Taxonomy, 2022-2032

        12.2.1. By Country

            12.2.1.1. U.S.

            12.2.1.2. Canada

        12.2.2. By Solutions

        12.2.3. By System Components

        12.2.4. By Business Models

        12.2.5. By End Users

        12.2.6. By Business Type

        12.2.7. By Building Size

    12.3. Market Attractiveness Analysis

        12.3.1. By Country

        12.3.2. By Solutions

        12.3.3. By System Components

        12.3.4. By Business Models

        12.3.5. By End Users

        12.3.6. By Business Type

        12.3.7. By Building Size

    12.4. Key Takeaways

13. Latin America Market Analysis 2016-2021 and Forecast 2022-2032, By Country

    13.1. Historical Market Size Value (US$ Mn) Trend Analysis By Market Taxonomy, 2016-2021

    13.2. Market Size Value (US$ Mn) Forecast By Market Taxonomy, 2022-2032

        13.2.1. By Country

            13.2.1.1. Brazil

            13.2.1.2. Mexico

            13.2.1.3. Rest of Latin America

        13.2.2. By Solutions

        13.2.3. By System Components

        13.2.4. By Business Models

        13.2.5. By End Users

        13.2.6. By Business Type

        13.2.7. By Building Size

    13.3. Market Attractiveness Analysis

        13.3.1. By Country

        13.3.2. By Solutions

        13.3.3. By System Components

        13.3.4. By Business Models

        13.3.5. By End Users

        13.3.6. By Business Type

        13.3.7. By Building Size

    13.4. Key Takeaways

14. Europe Market Analysis 2016-2021 and Forecast 2022-2032, By Country

    14.1. Historical Market Size Value (US$ Mn) Trend Analysis By Market Taxonomy, 2016-2021

    14.2. Market Size Value (US$ Mn) Forecast By Market Taxonomy, 2022-2032

        14.2.1. By Country

            14.2.1.1. Germany

            14.2.1.2. U.K.

            14.2.1.3. France

            14.2.1.4. Spain

            14.2.1.5. Italy

            14.2.1.6. Rest of Europe

        14.2.2. By Solutions

        14.2.3. By System Components

        14.2.4. By Business Models

        14.2.5. By End Users

        14.2.6. By Business Type

        14.2.7. By Building Size

    14.3. Market Attractiveness Analysis

        14.3.1. By Country

        14.3.2. By Solutions

        14.3.3. By System Components

        14.3.4. By Business Models

        14.3.5. By End Users

        14.3.6. By Business Type

        14.3.7. By Building Size

    14.4. Key Takeaways

15. South Asia Market Analysis 2016-2021 and Forecast 2022-2032, By Country

    15.1. Historical Market Size Value (US$ Mn) Trend Analysis By Market Taxonomy, 2016-2021

    15.2. Market Size Value (US$ Mn) Forecast By Market Taxonomy, 2022-2032

        15.2.1. By Country

            15.2.1.1. India

            15.2.1.2. Malaysia

            15.2.1.3. Singapore

            15.2.1.4. Thailand

            15.2.1.5. Rest of South Asia

        15.2.2. By Solutions

        15.2.3. By System Components

        15.2.4. By Business Models

        15.2.5. By End Users

        15.2.6. By Business Type

        15.2.7. By Building Size

    15.3. Market Attractiveness Analysis

        15.3.1. By Country

        15.3.2. By Solutions

        15.3.3. By System Components

        15.3.4. By Business Models

        15.3.5. By End Users

        15.3.6. By Business Type

        15.3.7. By Building Size

    15.4. Key Takeaways

16. East Asia Market Analysis 2016-2021 and Forecast 2022-2032, By Country

    16.1. Historical Market Size Value (US$ Mn) Trend Analysis By Market Taxonomy, 2016-2021

    16.2. Market Size Value (US$ Mn) Forecast By Market Taxonomy, 2022-2032

        16.2.1. By Country

            16.2.1.1. China

            16.2.1.2. Japan

            16.2.1.3. South Korea

        16.2.2. By Solutions

        16.2.3. By System Components

        16.2.4. By Business Models

        16.2.5. By End Users

        16.2.6. By Business Type

        16.2.7. By Building Size

    16.3. Market Attractiveness Analysis

        16.3.1. By Country

        16.3.2. By Solutions

        16.3.3. By System Components

        16.3.4. By Business Models

        16.3.5. By End Users

        16.3.6. By Business Type

        16.3.7. By Building Size

    16.4. Key Takeaways

17. Oceania Market Analysis 2016-2021 and Forecast 2022-2032, By Country

    17.1. Historical Market Size Value (US$ Mn) Trend Analysis By Market Taxonomy, 2016-2021

    17.2. Market Size Value (US$ Mn) Forecast By Market Taxonomy, 2022-2032

        17.2.1. By Country

            17.2.1.1. Australia

            17.2.1.2. New Zealand

        17.2.2. By Solutions

        17.2.3. By System Components

        17.2.4. By Business Models

        17.2.5. By End Users

        17.2.6. By Business Type

        17.2.7. By Building Size

    17.3. Market Attractiveness Analysis

        17.3.1. By Country

        17.3.2. By Solutions

        17.3.3. By System Components

        17.3.4. By Business Models

        17.3.5. By End Users

        17.3.6. By Business Type

        17.3.7. By Building Size

    17.4. Key Takeaways

18. MEA Market Analysis 2016-2021 and Forecast 2022-2032, By Country

    18.1. Historical Market Size Value (US$ Mn) Trend Analysis By Market Taxonomy, 2016-2021

    18.2. Market Size Value (US$ Mn) Forecast By Market Taxonomy, 2022-2032

        18.2.1. By Country

            18.2.1.1. GCC Countries

            18.2.1.2. South Africa

            18.2.1.3. Israel

            18.2.1.4. Rest of MEA

        18.2.2. By Solutions

        18.2.3. By System Components

        18.2.4. By Business Models

        18.2.5. By End Users

        18.2.6. By Business Type

        18.2.7. By Building Size

    18.3. Market Attractiveness Analysis

        18.3.1. By Country

        18.3.2. By Solutions

        18.3.3. By System Components

        18.3.4. By Business Models

        18.3.5. By End Users

        18.3.6. By Business Type

        18.3.7. By Building Size

    18.4. Key Takeaways

19. Key Countries Market Analysis

    19.1. U.S.

        19.1.1. Pricing Analysis

        19.1.2. Market Share Analysis, 2021

            19.1.2.1. By Solutions

            19.1.2.2. By System Components

            19.1.2.3. By Business Models

            19.1.2.4. By End Users

            19.1.2.5. By Business Type

            19.1.2.6. By Building Size

    19.2. Canada

        19.2.1. Pricing Analysis

        19.2.2. Market Share Analysis, 2021

            19.2.2.1. By Solutions

            19.2.2.2. By System Components

            19.2.2.3. By Business Models

            19.2.2.4. By End Users

            19.2.2.5. By Business Type

            19.2.2.6. By Building Size

    19.3. Brazil

        19.3.1. Pricing Analysis

        19.3.2. Market Share Analysis, 2021

            19.3.2.1. By Solutions

            19.3.2.2. By System Components

            19.3.2.3. By Business Models

            19.3.2.4. By End Users

            19.3.2.5. By Business Type

            19.3.2.6. By Building Size

    19.4. Mexico

        19.4.1. Pricing Analysis

        19.4.2. Market Share Analysis, 2021

            19.4.2.1. By Solutions

            19.4.2.2. By System Components

            19.4.2.3. By Business Models

            19.4.2.4. By End Users

            19.4.2.5. By Business Type

            19.4.2.6. By Building Size

    19.5. Germany

        19.5.1. Pricing Analysis

        19.5.2. Market Share Analysis, 2021

            19.5.2.1. By Solutions

            19.5.2.2. By System Components

            19.5.2.3. By Business Models

            19.5.2.4. By End Users

            19.5.2.5. By Business Type

            19.5.2.6. By Building Size

    19.6. U.K.

        19.6.1. Pricing Analysis

        19.6.2. Market Share Analysis, 2021

            19.6.2.1. By Solutions

            19.6.2.2. By System Components

            19.6.2.3. By Business Models

            19.6.2.4. By End Users

            19.6.2.5. By Business Type

            19.6.2.6. By Building Size

    19.7. France

        19.7.1. Pricing Analysis

        19.7.2. Market Share Analysis, 2021

            19.7.2.1. By Solutions

            19.7.2.2. By System Components

            19.7.2.3. By Business Models

            19.7.2.4. By End Users

            19.7.2.5. By Business Type

            19.7.2.6. By Building Size

    19.8. Spain

        19.8.1. Pricing Analysis

        19.8.2. Market Share Analysis, 2021

            19.8.2.1. By Solutions

            19.8.2.2. By System Components

            19.8.2.3. By Business Models

            19.8.2.4. By End Users

            19.8.2.5. By Business Type

            19.8.2.6. By Building Size

    19.9. Italy

        19.9.1. Pricing Analysis

        19.9.2. Market Share Analysis, 2021

            19.9.2.1. By Solutions

            19.9.2.2. By System Components

            19.9.2.3. By Business Models

            19.9.2.4. By End Users

            19.9.2.5. By Business Type

            19.9.2.6. By Building Size

    19.10. India

        19.10.1. Pricing Analysis

        19.10.2. Market Share Analysis, 2021

            19.10.2.1. By Solutions

            19.10.2.2. By System Components

            19.10.2.3. By Business Models

            19.10.2.4. By End Users

            19.10.2.5. By Business Type

            19.10.2.6. By Building Size

    19.11. Malaysia

        19.11.1. Pricing Analysis

        19.11.2. Market Share Analysis, 2021

            19.11.2.1. By Solutions

            19.11.2.2. By System Components

            19.11.2.3. By Business Models

            19.11.2.4. By End Users

            19.11.2.5. By Business Type

            19.11.2.6. By Building Size

    19.12. Singapore

        19.12.1. Pricing Analysis

        19.12.2. Market Share Analysis, 2021

            19.12.2.1. By Solutions

            19.12.2.2. By System Components

            19.12.2.3. By Business Models

            19.12.2.4. By End Users

            19.12.2.5. By Business Type

            19.12.2.6. By Building Size

    19.13. Thailand

        19.13.1. Pricing Analysis

        19.13.2. Market Share Analysis, 2021

            19.13.2.1. By Solutions

            19.13.2.2. By System Components

            19.13.2.3. By Business Models

            19.13.2.4. By End Users

            19.13.2.5. By Business Type

            19.13.2.6. By Building Size

    19.14. China

        19.14.1. Pricing Analysis

        19.14.2. Market Share Analysis, 2021

            19.14.2.1. By Solutions

            19.14.2.2. By System Components

            19.14.2.3. By Business Models

            19.14.2.4. By End Users

            19.14.2.5. By Business Type

            19.14.2.6. By Building Size

    19.15. Japan

        19.15.1. Pricing Analysis

        19.15.2. Market Share Analysis, 2021

            19.15.2.1. By Solutions

            19.15.2.2. By System Components

            19.15.2.3. By Business Models

            19.15.2.4. By End Users

            19.15.2.5. By Business Type

            19.15.2.6. By Building Size

    19.16. South Korea

        19.16.1. Pricing Analysis

        19.16.2. Market Share Analysis, 2021

            19.16.2.1. By Solutions

            19.16.2.2. By System Components

            19.16.2.3. By Business Models

            19.16.2.4. By End Users

            19.16.2.5. By Business Type

            19.16.2.6. By Building Size

    19.17. Australia

        19.17.1. Pricing Analysis

        19.17.2. Market Share Analysis, 2021

            19.17.2.1. By Solutions

            19.17.2.2. By System Components

            19.17.2.3. By Business Models

            19.17.2.4. By End Users

            19.17.2.5. By Business Type

            19.17.2.6. By Building Size

    19.18. New Zealand

        19.18.1. Pricing Analysis

        19.18.2. Market Share Analysis, 2021

            19.18.2.1. By Solutions

            19.18.2.2. By System Components

            19.18.2.3. By Business Models

            19.18.2.4. By End Users

            19.18.2.5. By Business Type

            19.18.2.6. By Building Size

    19.19. GCC Countries

        19.19.1. Pricing Analysis

        19.19.2. Market Share Analysis, 2021

            19.19.2.1. By Solutions

            19.19.2.2. By System Components

            19.19.2.3. By Business Models

            19.19.2.4. By End Users

            19.19.2.5. By Business Type

            19.19.2.6. By Building Size

    19.20. South Africa

        19.20.1. Pricing Analysis

        19.20.2. Market Share Analysis, 2021

            19.20.2.1. By Solutions

            19.20.2.2. By System Components

            19.20.2.3. By Business Models

            19.20.2.4. By End Users

            19.20.2.5. By Business Type

            19.20.2.6. By Building Size

    19.21. Israel

        19.21.1. Pricing Analysis

        19.21.2. Market Share Analysis, 2021

            19.21.2.1. By Solutions

            19.21.2.2. By System Components

            19.21.2.3. By Business Models

            19.21.2.4. By End Users

            19.21.2.5. By Business Type

            19.21.2.6. By Building Size

20. Market Structure Analysis

    20.1. Competition Dashboard

    20.2. Competition Benchmarking

    20.3. Market Share Analysis of Top Players

        20.3.1. By Regional

        20.3.2. By Solutions

        20.3.3. By System Components

        20.3.4. By Business Models

        20.3.5. By End Users

        20.3.6. By Business Type

        20.3.7. By Building Size

21. Competition Analysis

    21.1. Competition Deep Dive

        21.1.1. Alcatel Lucent

            21.1.1.1. Overview

            21.1.1.2. Product Portfolio

            21.1.1.3. Profitability by Market Segments

            21.1.1.4. Sales Footprint

            21.1.1.5. Strategy Overview

                21.1.1.5.1. Marketing Strategy

        21.1.2. Cobham PLC

            21.1.2.1. Overview

            21.1.2.2. Product Portfolio

            21.1.2.3. Profitability by Market Segments

            21.1.2.4. Sales Footprint

            21.1.2.5. Strategy Overview

                21.1.2.5.1. Marketing Strategy

        21.1.3. Corning Incorporated

            21.1.3.1. Overview

            21.1.3.2. Product Portfolio

            21.1.3.3. Profitability by Market Segments

            21.1.3.4. Sales Footprint

            21.1.3.5. Strategy Overview

                21.1.3.5.1. Marketing Strategy

        21.1.4. Smiths Group PLC

            21.1.4.1. Overview

            21.1.4.2. Product Portfolio

            21.1.4.3. Profitability by Market Segments

            21.1.4.4. Sales Footprint

            21.1.4.5. Strategy Overview

                21.1.4.5.1. Marketing Strategy

        21.1.5. Verizon Communication, Inc.

            21.1.5.1. Overview

            21.1.5.2. Product Portfolio

            21.1.5.3. Profitability by Market Segments

            21.1.5.4. Sales Footprint

            21.1.5.5. Strategy Overview

                21.1.5.5.1. Marketing Strategy

        21.1.6. AT&T, Inc., Anixter Inc.

            21.1.6.1. Overview

            21.1.6.2. Product Portfolio

            21.1.6.3. Profitability by Market Segments

            21.1.6.4. Sales Footprint

            21.1.6.5. Strategy Overview

                21.1.6.5.1. Marketing Strategy

        21.1.7. Commscope, Inc.

            21.1.7.1. Overview

            21.1.7.2. Product Portfolio

            21.1.7.3. Profitability by Market Segments

            21.1.7.4. Sales Footprint

            21.1.7.5. Strategy Overview

                21.1.7.5.1. Marketing Strategy

        21.1.8. Ericsson

            21.1.8.1. Overview

            21.1.8.2. Product Portfolio

            21.1.8.3. Profitability by Market Segments

            21.1.8.4. Sales Footprint

            21.1.8.5. Strategy Overview

                21.1.8.5.1. Marketing Strategy

        21.1.9. TE Connectivity

            21.1.9.1. Overview

            21.1.9.2. Product Portfolio

            21.1.9.3. Profitability by Market Segments

            21.1.9.4. Sales Footprint

            21.1.9.5. Strategy Overview

                21.1.9.5.1. Marketing Strategy

        21.1.10. Ethertronics

            21.1.10.1. Overview

            21.1.10.2. Product Portfolio

            21.1.10.3. Profitability by Market Segments

            21.1.10.4. Sales Footprint

            21.1.10.5. Strategy Overview

                21.1.10.5.1. Marketing Strategy

        21.1.11. Lord and Company Technologies

            21.1.11.1. Overview

            21.1.11.2. Product Portfolio

            21.1.11.3. Profitability by Market Segments

            21.1.11.4. Sales Footprint

            21.1.11.5. Strategy Overview

                21.1.11.5.1. Marketing Strategy

        21.1.12. Betacom Incorporated

            21.1.12.1. Overview

            21.1.12.2. Product Portfolio

            21.1.12.3. Profitability by Market Segments

            21.1.12.4. Sales Footprint

            21.1.12.5. Strategy Overview

                21.1.12.5.1. Marketing Strategy

        21.1.13. Lemko Corporation

            21.1.13.1. Overview

            21.1.13.2. Product Portfolio

            21.1.13.3. Profitability by Market Segments

            21.1.13.4. Sales Footprint

            21.1.13.5. Strategy Overview

                21.1.13.5.1. Marketing Strategy

        21.1.14. Oberon Inc.

            21.1.14.1. Overview

            21.1.14.2. Product Portfolio

            21.1.14.3. Profitability by Market Segments

            21.1.14.4. Sales Footprint

            21.1.14.5. Strategy Overview

                21.1.14.5.1. Marketing Strategy

        21.1.15. Telecommunication Systems, Inc.

            21.1.15.1. Overview

            21.1.15.2. Product Portfolio

            21.1.15.3. Profitability by Market Segments

            21.1.15.4. Sales Footprint

            21.1.15.5. Strategy Overview

                21.1.15.5.1. Marketing Strategy

22. Assumptions & Acronyms Used

23. Research Methodology

Don't pay for what you don't need

Customize your report by selecting specific countries or regions and save 30%!

List of Tables

Table 1: Global Market Value (US$ Mn) Forecast by Region, 2016-2032

Table 2: Global Market Value (US$ Mn) Forecast by Solutions, 2016-2032

Table 3: Global Market Value (US$ Mn) Forecast by System Components, 2016-2032

Table 4: Global Market Value (US$ Mn) Forecast by Business Models , 2016-2032

Table 5: Global Market Value (US$ Mn) Forecast by End Users, 2016-2032

Table 6: Global Market Value (US$ Mn) Forecast by Business Type, 2016-2032

Table 7: Global Market Value (US$ Mn) Forecast by Building Size, 2016-2032

Table 8: North America Market Value (US$ Mn) Forecast by Country, 2016-2032

Table 9: North America Market Value (US$ Mn) Forecast by Solutions, 2016-2032

Table 10: North America Market Value (US$ Mn) Forecast by System Components, 2016-2032

Table 11: North America Market Value (US$ Mn) Forecast by Business Models , 2016-2032

Table 12: North America Market Value (US$ Mn) Forecast by End Users, 2016-2032

Table 13: North America Market Value (US$ Mn) Forecast by Business Type, 2016-2032

Table 14: North America Market Value (US$ Mn) Forecast by Building Size, 2016-2032

Table 15: Latin America Market Value (US$ Mn) Forecast by Country, 2016-2032

Table 16: Latin America Market Value (US$ Mn) Forecast by Solutions, 2016-2032

Table 17: Latin America Market Value (US$ Mn) Forecast by System Components, 2016-2032

Table 18: Latin America Market Value (US$ Mn) Forecast by Business Models , 2016-2032

Table 19: Latin America Market Value (US$ Mn) Forecast by End Users, 2016-2032

Table 20: Latin America Market Value (US$ Mn) Forecast by Business Type, 2016-2032

Table 21: Latin America Market Value (US$ Mn) Forecast by Building Size, 2016-2032

Table 22: Europe Market Value (US$ Mn) Forecast by Country, 2016-2032

Table 23: Europe Market Value (US$ Mn) Forecast by Solutions, 2016-2032

Table 24: Europe Market Value (US$ Mn) Forecast by System Components, 2016-2032

Table 25: Europe Market Value (US$ Mn) Forecast by Business Models , 2016-2032

Table 26: Europe Market Value (US$ Mn) Forecast by End Users, 2016-2032

Table 27: Europe Market Value (US$ Mn) Forecast by Business Type, 2016-2032

Table 28: Europe Market Value (US$ Mn) Forecast by Building Size, 2016-2032

Table 29: South Asia Market Value (US$ Mn) Forecast by Country, 2016-2032

Table 30: South Asia Market Value (US$ Mn) Forecast by Solutions, 2016-2032

Table 31: South Asia Market Value (US$ Mn) Forecast by System Components, 2016-2032

Table 32: South Asia Market Value (US$ Mn) Forecast by Business Models , 2016-2032

Table 33: South Asia Market Value (US$ Mn) Forecast by End Users, 2016-2032

Table 34: South Asia Market Value (US$ Mn) Forecast by Business Type, 2016-2032

Table 35: South Asia Market Value (US$ Mn) Forecast by Building Size, 2016-2032

Table 36: East Asia Market Value (US$ Mn) Forecast by Country, 2016-2032

Table 37: East Asia Market Value (US$ Mn) Forecast by Solutions, 2016-2032

Table 38: East Asia Market Value (US$ Mn) Forecast by System Components, 2016-2032

Table 39: East Asia Market Value (US$ Mn) Forecast by Business Models , 2016-2032

Table 40: East Asia Market Value (US$ Mn) Forecast by End Users, 2016-2032

Table 41: East Asia Market Value (US$ Mn) Forecast by Business Type, 2016-2032

Table 42: East Asia Market Value (US$ Mn) Forecast by Building Size, 2016-2032

Table 43: Oceania Market Value (US$ Mn) Forecast by Country, 2016-2032

Table 44: Oceania Market Value (US$ Mn) Forecast by Solutions, 2016-2032

Table 45: Oceania Market Value (US$ Mn) Forecast by System Components, 2016-2032

Table 46: Oceania Market Value (US$ Mn) Forecast by Business Models , 2016-2032

Table 47: Oceania Market Value (US$ Mn) Forecast by End Users, 2016-2032

Table 48: Oceania Market Value (US$ Mn) Forecast by Business Type, 2016-2032

Table 49: Oceania Market Value (US$ Mn) Forecast by Building Size, 2016-2032

Table 50: MEA Market Value (US$ Mn) Forecast by Country, 2016-2032

Table 51: MEA Market Value (US$ Mn) Forecast by Solutions, 2016-2032

Table 52: MEA Market Value (US$ Mn) Forecast by System Components, 2016-2032

Table 53: MEA Market Value (US$ Mn) Forecast by Business Models , 2016-2032

Table 54: MEA Market Value (US$ Mn) Forecast by End Users, 2016-2032

Table 55: MEA Market Value (US$ Mn) Forecast by Business Type, 2016-2032

Table 56: MEA Market Value (US$ Mn) Forecast by Building Size, 2016-2032
Sudip Saha
Sudip Saha

Principal Consultant

Talk to Analyst

Find your sweet spots for generating winning opportunities in this market.

List of Charts

Figure 1: Global Market Value (US$ Mn) by Solutions, 2022-2032

Figure 2: Global Market Value (US$ Mn) by System Components, 2022-2032

Figure 3: Global Market Value (US$ Mn) by Business Models , 2022-2032

Figure 4: Global Market Value (US$ Mn) by End Users, 2022-2032

Figure 5: Global Market Value (US$ Mn) by Business Type, 2022-2032

Figure 6: Global Market Value (US$ Mn) by Building Size, 2022-2032

Figure 7: Global Market Value (US$ Mn) by Region, 2022-2032

Figure 8: Global Market Value (US$ Mn) Analysis by Region, 2016-2032

Figure 9: Global Market Value Share (%) and BPS Analysis by Region, 2022-2032

Figure 10: Global Market Y-o-Y Growth (%) Projections by Region, 2022-2032

Figure 11: Global Market Value (US$ Mn) Analysis by Solutions, 2016-2032

Figure 12: Global Market Value Share (%) and BPS Analysis by Solutions, 2022-2032

Figure 13: Global Market Y-o-Y Growth (%) Projections by Solutions, 2022-2032

Figure 14: Global Market Value (US$ Mn) Analysis by System Components, 2016-2032

Figure 15: Global Market Value Share (%) and BPS Analysis by System Components, 2022-2032

Figure 16: Global Market Y-o-Y Growth (%) Projections by System Components, 2022-2032

Figure 17: Global Market Value (US$ Mn) Analysis by Business Models , 2016-2032

Figure 18: Global Market Value Share (%) and BPS Analysis by Business Models , 2022-2032

Figure 19: Global Market Y-o-Y Growth (%) Projections by Business Models , 2022-2032

Figure 20: Global Market Value (US$ Mn) Analysis by End Users, 2016-2032

Figure 21: Global Market Value Share (%) and BPS Analysis by End Users, 2022-2032

Figure 22: Global Market Y-o-Y Growth (%) Projections by End Users, 2022-2032

Figure 23: Global Market Value (US$ Mn) Analysis by Business Type, 2016-2032

Figure 24: Global Market Value Share (%) and BPS Analysis by Business Type, 2022-2032

Figure 25: Global Market Y-o-Y Growth (%) Projections by Business Type, 2022-2032

Figure 26: Global Market Value (US$ Mn) Analysis by Building Size, 2016-2032

Figure 27: Global Market Value Share (%) and BPS Analysis by Building Size, 2022-2032

Figure 28: Global Market Y-o-Y Growth (%) Projections by Building Size, 2022-2032

Figure 29: Global Market Attractiveness by Solutions, 2022-2032

Figure 30: Global Market Attractiveness by System Components, 2022-2032

Figure 31: Global Market Attractiveness by Business Models , 2022-2032

Figure 32: Global Market Attractiveness by End Users, 2022-2032

Figure 33: Global Market Attractiveness by Business Type, 2022-2032

Figure 34: Global Market Attractiveness by Building Size, 2022-2032

Figure 35: Global Market Attractiveness by Region, 2022-2032

Figure 36: North America Market Value (US$ Mn) by Solutions, 2022-2032

Figure 37: North America Market Value (US$ Mn) by System Components, 2022-2032

Figure 38: North America Market Value (US$ Mn) by Business Models , 2022-2032

Figure 39: North America Market Value (US$ Mn) by End Users, 2022-2032

Figure 40: North America Market Value (US$ Mn) by Business Type, 2022-2032

Figure 41: North America Market Value (US$ Mn) by Building Size, 2022-2032

Figure 42: North America Market Value (US$ Mn) by Country, 2022-2032

Figure 43: North America Market Value (US$ Mn) Analysis by Country, 2016-2032

Figure 44: North America Market Value Share (%) and BPS Analysis by Country, 2022-2032

Figure 45: North America Market Y-o-Y Growth (%) Projections by Country, 2022-2032

Figure 46: North America Market Value (US$ Mn) Analysis by Solutions, 2016-2032

Figure 47: North America Market Value Share (%) and BPS Analysis by Solutions, 2022-2032

Figure 48: North America Market Y-o-Y Growth (%) Projections by Solutions, 2022-2032

Figure 49: North America Market Value (US$ Mn) Analysis by System Components, 2016-2032

Figure 50: North America Market Value Share (%) and BPS Analysis by System Components, 2022-2032

Figure 51: North America Market Y-o-Y Growth (%) Projections by System Components, 2022-2032

Figure 52: North America Market Value (US$ Mn) Analysis by Business Models , 2016-2032

Figure 53: North America Market Value Share (%) and BPS Analysis by Business Models , 2022-2032

Figure 54: North America Market Y-o-Y Growth (%) Projections by Business Models , 2022-2032

Figure 55: North America Market Value (US$ Mn) Analysis by End Users, 2016-2032

Figure 56: North America Market Value Share (%) and BPS Analysis by End Users, 2022-2032

Figure 57: North America Market Y-o-Y Growth (%) Projections by End Users, 2022-2032

Figure 58: North America Market Value (US$ Mn) Analysis by Business Type, 2016-2032

Figure 59: North America Market Value Share (%) and BPS Analysis by Business Type, 2022-2032

Figure 60: North America Market Y-o-Y Growth (%) Projections by Business Type, 2022-2032

Figure 61: North America Market Value (US$ Mn) Analysis by Building Size, 2016-2032

Figure 62: North America Market Value Share (%) and BPS Analysis by Building Size, 2022-2032

Figure 63: North America Market Y-o-Y Growth (%) Projections by Building Size, 2022-2032

Figure 64: North America Market Attractiveness by Solutions, 2022-2032

Figure 65: North America Market Attractiveness by System Components, 2022-2032

Figure 66: North America Market Attractiveness by Business Models , 2022-2032

Figure 67: North America Market Attractiveness by End Users, 2022-2032

Figure 68: North America Market Attractiveness by Business Type, 2022-2032

Figure 69: North America Market Attractiveness by Building Size, 2022-2032

Figure 70: North America Market Attractiveness by Country, 2022-2032

Figure 71: Latin America Market Value (US$ Mn) by Solutions, 2022-2032

Figure 72: Latin America Market Value (US$ Mn) by System Components, 2022-2032

Figure 73: Latin America Market Value (US$ Mn) by Business Models , 2022-2032

Figure 74: Latin America Market Value (US$ Mn) by End Users, 2022-2032

Figure 75: Latin America Market Value (US$ Mn) by Business Type, 2022-2032

Figure 76: Latin America Market Value (US$ Mn) by Building Size, 2022-2032

Figure 77: Latin America Market Value (US$ Mn) by Country, 2022-2032

Figure 78: Latin America Market Value (US$ Mn) Analysis by Country, 2016-2032

Figure 79: Latin America Market Value Share (%) and BPS Analysis by Country, 2022-2032

Figure 80: Latin America Market Y-o-Y Growth (%) Projections by Country, 2022-2032

Figure 81: Latin America Market Value (US$ Mn) Analysis by Solutions, 2016-2032

Figure 82: Latin America Market Value Share (%) and BPS Analysis by Solutions, 2022-2032

Figure 83: Latin America Market Y-o-Y Growth (%) Projections by Solutions, 2022-2032

Figure 84: Latin America Market Value (US$ Mn) Analysis by System Components, 2016-2032

Figure 85: Latin America Market Value Share (%) and BPS Analysis by System Components, 2022-2032

Figure 86: Latin America Market Y-o-Y Growth (%) Projections by System Components, 2022-2032

Figure 87: Latin America Market Value (US$ Mn) Analysis by Business Models , 2016-2032

Figure 88: Latin America Market Value Share (%) and BPS Analysis by Business Models , 2022-2032

Figure 89: Latin America Market Y-o-Y Growth (%) Projections by Business Models , 2022-2032

Figure 90: Latin America Market Value (US$ Mn) Analysis by End Users, 2016-2032

Figure 91: Latin America Market Value Share (%) and BPS Analysis by End Users, 2022-2032

Figure 92: Latin America Market Y-o-Y Growth (%) Projections by End Users, 2022-2032

Figure 93: Latin America Market Value (US$ Mn) Analysis by Business Type, 2016-2032

Figure 94: Latin America Market Value Share (%) and BPS Analysis by Business Type, 2022-2032

Figure 95: Latin America Market Y-o-Y Growth (%) Projections by Business Type, 2022-2032

Figure 96: Latin America Market Value (US$ Mn) Analysis by Building Size, 2016-2032

Figure 97: Latin America Market Value Share (%) and BPS Analysis by Building Size, 2022-2032

Figure 98: Latin America Market Y-o-Y Growth (%) Projections by Building Size, 2022-2032

Figure 99: Latin America Market Attractiveness by Solutions, 2022-2032

Figure 100: Latin America Market Attractiveness by System Components, 2022-2032

Figure 101: Latin America Market Attractiveness by Business Models , 2022-2032

Figure 102: Latin America Market Attractiveness by End Users, 2022-2032

Figure 103: Latin America Market Attractiveness by Business Type, 2022-2032

Figure 104: Latin America Market Attractiveness by Building Size, 2022-2032

Figure 105: Latin America Market Attractiveness by Country, 2022-2032

Figure 106: Europe Market Value (US$ Mn) by Solutions, 2022-2032

Figure 107: Europe Market Value (US$ Mn) by System Components, 2022-2032

Figure 108: Europe Market Value (US$ Mn) by Business Models , 2022-2032

Figure 109: Europe Market Value (US$ Mn) by End Users, 2022-2032

Figure 110: Europe Market Value (US$ Mn) by Business Type, 2022-2032

Figure 111: Europe Market Value (US$ Mn) by Building Size, 2022-2032

Figure 112: Europe Market Value (US$ Mn) by Country, 2022-2032

Figure 113: Europe Market Value (US$ Mn) Analysis by Country, 2016-2032

Figure 114: Europe Market Value Share (%) and BPS Analysis by Country, 2022-2032

Figure 115: Europe Market Y-o-Y Growth (%) Projections by Country, 2022-2032

Figure 116: Europe Market Value (US$ Mn) Analysis by Solutions, 2016-2032

Figure 117: Europe Market Value Share (%) and BPS Analysis by Solutions, 2022-2032

Figure 118: Europe Market Y-o-Y Growth (%) Projections by Solutions, 2022-2032

Figure 119: Europe Market Value (US$ Mn) Analysis by System Components, 2016-2032

Figure 120: Europe Market Value Share (%) and BPS Analysis by System Components, 2022-2032

Figure 121: Europe Market Y-o-Y Growth (%) Projections by System Components, 2022-2032

Figure 122: Europe Market Value (US$ Mn) Analysis by Business Models , 2016-2032

Figure 123: Europe Market Value Share (%) and BPS Analysis by Business Models , 2022-2032

Figure 124: Europe Market Y-o-Y Growth (%) Projections by Business Models , 2022-2032

Figure 125: Europe Market Value (US$ Mn) Analysis by End Users, 2016-2032

Figure 126: Europe Market Value Share (%) and BPS Analysis by End Users, 2022-2032

Figure 127: Europe Market Y-o-Y Growth (%) Projections by End Users, 2022-2032

Figure 128: Europe Market Value (US$ Mn) Analysis by Business Type, 2016-2032

Figure 129: Europe Market Value Share (%) and BPS Analysis by Business Type, 2022-2032

Figure 130: Europe Market Y-o-Y Growth (%) Projections by Business Type, 2022-2032

Figure 131: Europe Market Value (US$ Mn) Analysis by Building Size, 2016-2032

Figure 132: Europe Market Value Share (%) and BPS Analysis by Building Size, 2022-2032

Figure 133: Europe Market Y-o-Y Growth (%) Projections by Building Size, 2022-2032

Figure 134: Europe Market Attractiveness by Solutions, 2022-2032

Figure 135: Europe Market Attractiveness by System Components, 2022-2032

Figure 136: Europe Market Attractiveness by Business Models , 2022-2032

Figure 137: Europe Market Attractiveness by End Users, 2022-2032

Figure 138: Europe Market Attractiveness by Business Type, 2022-2032

Figure 139: Europe Market Attractiveness by Building Size, 2022-2032

Figure 140: Europe Market Attractiveness by Country, 2022-2032

Figure 141: South Asia Market Value (US$ Mn) by Solutions, 2022-2032

Figure 142: South Asia Market Value (US$ Mn) by System Components, 2022-2032

Figure 143: South Asia Market Value (US$ Mn) by Business Models , 2022-2032

Figure 144: South Asia Market Value (US$ Mn) by End Users, 2022-2032

Figure 145: South Asia Market Value (US$ Mn) by Business Type, 2022-2032

Figure 146: South Asia Market Value (US$ Mn) by Building Size, 2022-2032

Figure 147: South Asia Market Value (US$ Mn) by Country, 2022-2032

Figure 148: South Asia Market Value (US$ Mn) Analysis by Country, 2016-2032

Figure 149: South Asia Market Value Share (%) and BPS Analysis by Country, 2022-2032

Figure 150: South Asia Market Y-o-Y Growth (%) Projections by Country, 2022-2032

Figure 151: South Asia Market Value (US$ Mn) Analysis by Solutions, 2016-2032

Figure 152: South Asia Market Value Share (%) and BPS Analysis by Solutions, 2022-2032

Figure 153: South Asia Market Y-o-Y Growth (%) Projections by Solutions, 2022-2032

Figure 154: South Asia Market Value (US$ Mn) Analysis by System Components, 2016-2032

Figure 155: South Asia Market Value Share (%) and BPS Analysis by System Components, 2022-2032

Figure 156: South Asia Market Y-o-Y Growth (%) Projections by System Components, 2022-2032

Figure 157: South Asia Market Value (US$ Mn) Analysis by Business Models , 2016-2032

Figure 158: South Asia Market Value Share (%) and BPS Analysis by Business Models , 2022-2032

Figure 159: South Asia Market Y-o-Y Growth (%) Projections by Business Models , 2022-2032

Figure 160: South Asia Market Value (US$ Mn) Analysis by End Users, 2016-2032

Figure 161: South Asia Market Value Share (%) and BPS Analysis by End Users, 2022-2032

Figure 162: South Asia Market Y-o-Y Growth (%) Projections by End Users, 2022-2032

Figure 163: South Asia Market Value (US$ Mn) Analysis by Business Type, 2016-2032

Figure 164: South Asia Market Value Share (%) and BPS Analysis by Business Type, 2022-2032

Figure 165: South Asia Market Y-o-Y Growth (%) Projections by Business Type, 2022-2032

Figure 166: South Asia Market Value (US$ Mn) Analysis by Building Size, 2016-2032

Figure 167: South Asia Market Value Share (%) and BPS Analysis by Building Size, 2022-2032

Figure 168: South Asia Market Y-o-Y Growth (%) Projections by Building Size, 2022-2032

Figure 169: South Asia Market Attractiveness by Solutions, 2022-2032

Figure 170: South Asia Market Attractiveness by System Components, 2022-2032

Figure 171: South Asia Market Attractiveness by Business Models , 2022-2032

Figure 172: South Asia Market Attractiveness by End Users, 2022-2032

Figure 173: South Asia Market Attractiveness by Business Type, 2022-2032

Figure 174: South Asia Market Attractiveness by Building Size, 2022-2032

Figure 175: South Asia Market Attractiveness by Country, 2022-2032

Figure 176: East Asia Market Value (US$ Mn) by Solutions, 2022-2032

Figure 177: East Asia Market Value (US$ Mn) by System Components, 2022-2032

Figure 178: East Asia Market Value (US$ Mn) by Business Models , 2022-2032

Figure 179: East Asia Market Value (US$ Mn) by End Users, 2022-2032

Figure 180: East Asia Market Value (US$ Mn) by Business Type, 2022-2032

Figure 181: East Asia Market Value (US$ Mn) by Building Size, 2022-2032

Figure 182: East Asia Market Value (US$ Mn) by Country, 2022-2032

Figure 183: East Asia Market Value (US$ Mn) Analysis by Country, 2016-2032

Figure 184: East Asia Market Value Share (%) and BPS Analysis by Country, 2022-2032

Figure 185: East Asia Market Y-o-Y Growth (%) Projections by Country, 2022-2032

Figure 186: East Asia Market Value (US$ Mn) Analysis by Solutions, 2016-2032

Figure 187: East Asia Market Value Share (%) and BPS Analysis by Solutions, 2022-2032

Figure 188: East Asia Market Y-o-Y Growth (%) Projections by Solutions, 2022-2032

Figure 189: East Asia Market Value (US$ Mn) Analysis by System Components, 2016-2032

Figure 190: East Asia Market Value Share (%) and BPS Analysis by System Components, 2022-2032

Figure 191: East Asia Market Y-o-Y Growth (%) Projections by System Components, 2022-2032

Figure 192: East Asia Market Value (US$ Mn) Analysis by Business Models , 2016-2032

Figure 193: East Asia Market Value Share (%) and BPS Analysis by Business Models , 2022-2032

Figure 194: East Asia Market Y-o-Y Growth (%) Projections by Business Models , 2022-2032

Figure 195: East Asia Market Value (US$ Mn) Analysis by End Users, 2016-2032

Figure 196: East Asia Market Value Share (%) and BPS Analysis by End Users, 2022-2032

Figure 197: East Asia Market Y-o-Y Growth (%) Projections by End Users, 2022-2032

Figure 198: East Asia Market Value (US$ Mn) Analysis by Business Type, 2016-2032

Figure 199: East Asia Market Value Share (%) and BPS Analysis by Business Type, 2022-2032

Figure 200: East Asia Market Y-o-Y Growth (%) Projections by Business Type, 2022-2032

Figure 201: East Asia Market Value (US$ Mn) Analysis by Building Size, 2016-2032

Figure 202: East Asia Market Value Share (%) and BPS Analysis by Building Size, 2022-2032

Figure 203: East Asia Market Y-o-Y Growth (%) Projections by Building Size, 2022-2032

Figure 204: East Asia Market Attractiveness by Solutions, 2022-2032

Figure 205: East Asia Market Attractiveness by System Components, 2022-2032

Figure 206: East Asia Market Attractiveness by Business Models , 2022-2032

Figure 207: East Asia Market Attractiveness by End Users, 2022-2032

Figure 208: East Asia Market Attractiveness by Business Type, 2022-2032

Figure 209: East Asia Market Attractiveness by Building Size, 2022-2032

Figure 210: East Asia Market Attractiveness by Country, 2022-2032

Figure 211: Oceania Market Value (US$ Mn) by Solutions, 2022-2032

Figure 212: Oceania Market Value (US$ Mn) by System Components, 2022-2032

Figure 213: Oceania Market Value (US$ Mn) by Business Models , 2022-2032

Figure 214: Oceania Market Value (US$ Mn) by End Users, 2022-2032

Figure 215: Oceania Market Value (US$ Mn) by Business Type, 2022-2032

Figure 216: Oceania Market Value (US$ Mn) by Building Size, 2022-2032

Figure 217: Oceania Market Value (US$ Mn) by Country, 2022-2032

Figure 218: Oceania Market Value (US$ Mn) Analysis by Country, 2016-2032

Figure 219: Oceania Market Value Share (%) and BPS Analysis by Country, 2022-2032

Figure 220: Oceania Market Y-o-Y Growth (%) Projections by Country, 2022-2032

Figure 221: Oceania Market Value (US$ Mn) Analysis by Solutions, 2016-2032

Figure 222: Oceania Market Value Share (%) and BPS Analysis by Solutions, 2022-2032

Figure 223: Oceania Market Y-o-Y Growth (%) Projections by Solutions, 2022-2032

Figure 224: Oceania Market Value (US$ Mn) Analysis by System Components, 2016-2032

Figure 225: Oceania Market Value Share (%) and BPS Analysis by System Components, 2022-2032

Figure 226: Oceania Market Y-o-Y Growth (%) Projections by System Components, 2022-2032

Figure 227: Oceania Market Value (US$ Mn) Analysis by Business Models , 2016-2032

Figure 228: Oceania Market Value Share (%) and BPS Analysis by Business Models , 2022-2032

Figure 229: Oceania Market Y-o-Y Growth (%) Projections by Business Models , 2022-2032

Figure 230: Oceania Market Value (US$ Mn) Analysis by End Users, 2016-2032

Figure 231: Oceania Market Value Share (%) and BPS Analysis by End Users, 2022-2032

Figure 232: Oceania Market Y-o-Y Growth (%) Projections by End Users, 2022-2032

Figure 233: Oceania Market Value (US$ Mn) Analysis by Business Type, 2016-2032

Figure 234: Oceania Market Value Share (%) and BPS Analysis by Business Type, 2022-2032

Figure 235: Oceania Market Y-o-Y Growth (%) Projections by Business Type, 2022-2032

Figure 236: Oceania Market Value (US$ Mn) Analysis by Building Size, 2016-2032

Figure 237: Oceania Market Value Share (%) and BPS Analysis by Building Size, 2022-2032

Figure 238: Oceania Market Y-o-Y Growth (%) Projections by Building Size, 2022-2032

Figure 239: Oceania Market Attractiveness by Solutions, 2022-2032

Figure 240: Oceania Market Attractiveness by System Components, 2022-2032

Figure 241: Oceania Market Attractiveness by Business Models , 2022-2032

Figure 242: Oceania Market Attractiveness by End Users, 2022-2032

Figure 243: Oceania Market Attractiveness by Business Type, 2022-2032

Figure 244: Oceania Market Attractiveness by Building Size, 2022-2032

Figure 245: Oceania Market Attractiveness by Country, 2022-2032

Figure 246: MEA Market Value (US$ Mn) by Solutions, 2022-2032

Figure 247: MEA Market Value (US$ Mn) by System Components, 2022-2032

Figure 248: MEA Market Value (US$ Mn) by Business Models , 2022-2032

Figure 249: MEA Market Value (US$ Mn) by End Users, 2022-2032

Figure 250: MEA Market Value (US$ Mn) by Business Type, 2022-2032

Figure 251: MEA Market Value (US$ Mn) by Building Size, 2022-2032

Figure 252: MEA Market Value (US$ Mn) by Country, 2022-2032

Figure 253: MEA Market Value (US$ Mn) Analysis by Country, 2016-2032

Figure 254: MEA Market Value Share (%) and BPS Analysis by Country, 2022-2032

Figure 255: MEA Market Y-o-Y Growth (%) Projections by Country, 2022-2032

Figure 256: MEA Market Value (US$ Mn) Analysis by Solutions, 2016-2032

Figure 257: MEA Market Value Share (%) and BPS Analysis by Solutions, 2022-2032

Figure 258: MEA Market Y-o-Y Growth (%) Projections by Solutions, 2022-2032

Figure 259: MEA Market Value (US$ Mn) Analysis by System Components, 2016-2032

Figure 260: MEA Market Value Share (%) and BPS Analysis by System Components, 2022-2032

Figure 261: MEA Market Y-o-Y Growth (%) Projections by System Components, 2022-2032

Figure 262: MEA Market Value (US$ Mn) Analysis by Business Models , 2016-2032

Figure 263: MEA Market Value Share (%) and BPS Analysis by Business Models , 2022-2032

Figure 264: MEA Market Y-o-Y Growth (%) Projections by Business Models , 2022-2032

Figure 265: MEA Market Value (US$ Mn) Analysis by End Users, 2016-2032

Figure 266: MEA Market Value Share (%) and BPS Analysis by End Users, 2022-2032

Figure 267: MEA Market Y-o-Y Growth (%) Projections by End Users, 2022-2032

Figure 268: MEA Market Value (US$ Mn) Analysis by Business Type, 2016-2032

Figure 269: MEA Market Value Share (%) and BPS Analysis by Business Type, 2022-2032

Figure 270: MEA Market Y-o-Y Growth (%) Projections by Business Type, 2022-2032

Figure 271: MEA Market Value (US$ Mn) Analysis by Building Size, 2016-2032

Figure 272: MEA Market Value Share (%) and BPS Analysis by Building Size, 2022-2032

Figure 273: MEA Market Y-o-Y Growth (%) Projections by Building Size, 2022-2032

Figure 274: MEA Market Attractiveness by Solutions, 2022-2032

Figure 275: MEA Market Attractiveness by System Components, 2022-2032

Figure 276: MEA Market Attractiveness by Business Models , 2022-2032

Figure 277: MEA Market Attractiveness by End Users, 2022-2032

Figure 278: MEA Market Attractiveness by Business Type, 2022-2032

Figure 279: MEA Market Attractiveness by Building Size, 2022-2032

Figure 280: MEA Market Attractiveness by Country, 2022-2032

Recommendations

Technology

5G Fixed Wireless Access Market

Published : March 2023

Technology

Telecom Wireless Data Market

Published : November 2022

Technology

Next Generation Wireless Network Market

Published : July 2022

Technology

Wireless Connectivity Market

Published : June 2022

Explore Technology Insights

View Reports