The Wireless Lighting Market is estimated to be valued at USD 146.2 billion in 2025 and is projected to reach USD 205.8 billion by 2035, registering a compound annual growth rate (CAGR) of 3.5% over the forecast period.
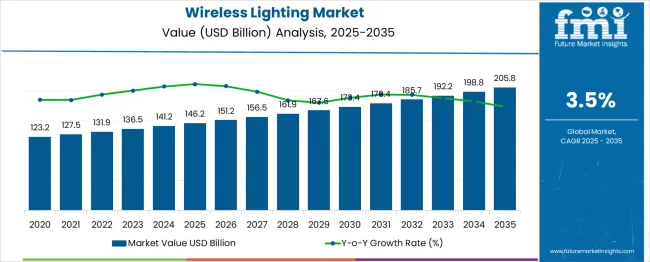
The wireless lighting market is undergoing steady transformation as industries, homes, and cities shift toward automation, energy efficiency, and connected infrastructure. Increasing demand for smart environments, supported by the rapid expansion of IoT devices and affordable connectivity modules, has contributed to the proliferation of wireless lighting systems.
Governments and utilities are promoting smart lighting through incentive schemes and smart grid integration initiatives, creating demand across both new installations and retrofit projects. Advancements in wireless protocols, battery life, and sensor integration are improving product reliability and control, enhancing consumer adoption.
Continued growth is expected as smart homes and intelligent buildings become mainstream, and manufacturers invest in scalable, interoperable solutions aligned with global energy efficiency standards.
The market is segmented by Product and Application and region. By Product, the market is divided into Wi-Fi, Z-Wave, ZigBee, Bluetooth, and Enocean. In terms of Application, the market is classified into Residential, Commercial Buildings, Government offices and building, Street Lighting, and Others. Regionally, the market is classified into North America, Latin America, Western Europe, Eastern Europe, Balkan & Baltic Countries, Russia & Belarus, Central Asia, East Asia, South Asia & Pacific, and the Middle East & Africa.
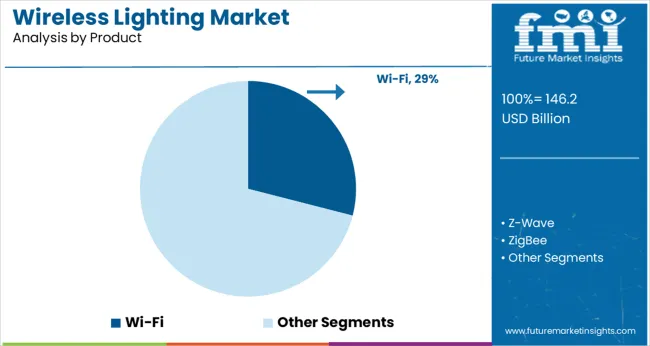
Wi-Fi-enabled lighting products are projected to account for 29.0% of the total market share in 2025, positioning this as the leading wireless technology segment. This leadership is attributed to the widespread availability of Wi-Fi infrastructure in residential and commercial spaces, which eliminates the need for proprietary gateways or hubs.
The ability to integrate seamlessly with smartphones, smart speakers, and home automation platforms has supported rapid adoption among consumers seeking flexibility and ease of use. Additionally, advancements in low-power Wi-Fi modules have improved device efficiency and responsiveness, encouraging inclusion in both ambient and task lighting systems.
The growing ecosystem of app-based lighting control, remote scheduling, and integration with other smart home devices has further cemented Wi-Fi's position in the market.
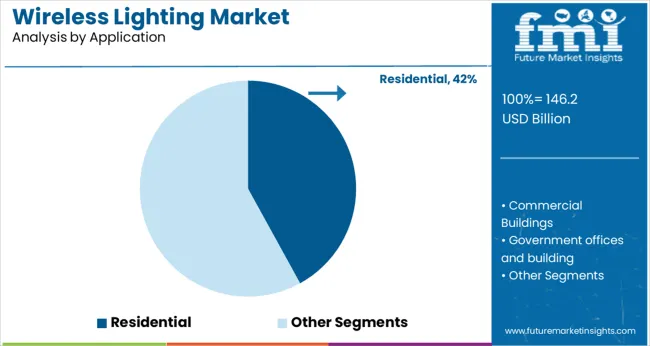
The residential segment is expected to lead the wireless lighting market with a 42.0% revenue share in 2025. This dominance is being fueled by growing consumer demand for smart, customizable lighting solutions that enhance lifestyle convenience, security, and energy efficiency.
The popularity of home automation platforms, coupled with increased awareness of lighting’s impact on mood and health, has encouraged wider adoption in living spaces. Wireless lighting allows homeowners to implement scene-based lighting, automate routines, and reduce power consumption through adaptive brightness and occupancy sensing.
Increased construction of smart homes, rising urbanization, and decreasing costs of wireless modules have further reinforced residential uptake. As consumer electronics brands continue to introduce lighting solutions with enhanced aesthetics and integration capabilities, residential adoption is expected to remain a core growth driver for the wireless lighting market.
North America currently dominates the wireless lighting market, which is attributed to the presence of leading manufacturers in the USA In addition, there is a high demand for smart lighting across schools, colleges, universities and work spaces.
The USA hosts numerous concerts, public events and conferences, which increases the demand for wireless lighting and drives product innovations. Likewise, these lighting systems are being increasingly deployed for shooting advertisement commercials, music videos and photoshoots.
The introduction of Li-Fi, which is essentially lighting equipped with a Wi-Fi connection, is becoming progressively popular. Additionally, rising interest in media and film communities and a high influx of tourists in Canada are further anticipated to drive global market growth.
Europe holds the second-largest market share of wireless lighting owing to the rising focus on implementing safety protocols and uniform performance standards for indoor and commercial lighting systems.
Smart lamps and lighting systems for entertainment rooms, garages, art studios, and indoor theatres are being preferred by consumers in Germany, France, and Italy. Moreover, the replacement of traditional systems through the high adoption of wireless lighting in residential sectors in this region.
A major contributor to greenhouse emissions and environmental deterioration is the rising consumption of non-renewable power, which is becoming a growing concern amongst consumers and enterprises.
Therefore, carbon emissions can be limited by conserving the energy utilized for lighting and ultimately improving environmental health. Several policymakers and governments are implementing sustainable policies to promote energy-saving lighting products owing to rising pressure to make energy-efficient changes.
Manufacturers are offering smart LED street lighting fixtures that consume about half of what HBS fixtures do, but presently, spot LED lighting systems are being deployed as they can be controlled via network communications and reduces energy consumption.
Either a PC or a smartphone can be used to facilitate the control of these lighting fixtures, as well as manage them as social assets. These streetlights conserve a lot of energy by reducing unnecessary lighting and simply illuminating the target area to only the degree required.
There has been a recent launch in the wireless lighting market share with the introduction of “Wi-Fi enabled LED Bulb.” This 9W smart LED bulb comes with multi-color lighting options, as well as automated scheduling functions. Key manufacturers claim that the multi-color options offer nearly 16 Million shades.
The lighting settings can be adjusted according to the needs of the user, which range from dinner, family gatherings, and parties to kids playing areas and recreational rooms. Moreover, the bulb comes equipped with a pre-set feature that allows the user to auto-schedule the switching on and off of the lights. These innovations are anticipated to spark creativity in manufacturers, which may eventually expand the global market size.
High demand for energy-efficient and wireless lighting systems across smart city projects in various countries is a chief trend driving the adoption of wireless lighting. Rising preference for wireless lighting can be attributed to the widespread awareness of reducing energy consumption across homes and offices.
The introduction of integrated lighting control systems, decreasing costs of LEDs, along with rising demand for lighting devices with smartphone connectivity will augment the wireless lighting market size.
In addition to this, the popularity of human-centric lighting solutions across countries such as India, Germany, China, and Brazil is gaining traction. These systems detect individuals' moods and behavior and adjust the lighting in a particular room accordingly. The adoption of these lighting systems in the healthcare sector is rising, which, in turn, will fuel the demand for wireless lighting.
Further, government initiatives to promote the use of green energy, along with high demand for PoE-based lighting solutions in residential, commercial, and healthcare sectors will continue pushing the adoption of wireless lighting.
To reduce energy consumption across the industrial and residential sectors, government bodies across various countries have introduced a standard protocol for lighting control systems. A standard protocol defines and analyses the methods used for data representation, authentication, signaling, and error detection in wireless lighting systems.
A standard protocol ensures the stability of connection in these systems, streamlines communication, and enables data transfer between computing units and control endpoints. Digital protocols are either one-way or two-way, in which two-way (bilateral) protocol enables fast and effective communication between luminaires and connected devices.
Currently, ZigBee and DALI are the most commonly installed protocols in smart and wireless lighting solutions. Besides these two, the adoption of protocols such as KNX has improved the overall efficiency of wireless lighting systems, which is driving sales in the market.
Standard protocols also facilitate better understanding and compatibility among connected devices and simplify the overall installation process, thereby making the adoption of smart lighting more convenient and effective.
In wireless lighting systems, wireless networks are used to connect network components to perform the required functions. These lighting systems comprise an array of built-in sensors, cameras, and LED fixtures to a wireless network.
The data is stored in the cloud to enable remote access to wireless lighting systems. As these systems are connected through the Internet, they are susceptible to exploitation by hackers. For instance, a hacker can gain access to the controlled lighting system installed in a residential space and turn the cameras and lighting off for malicious intent.
Intruders can also turn off lights and security alarm systems at hospitals and public places, which might result in severe consequences. Privacy and security remain key challenges in wireless lighting systems, which are expected to influence the wireless lighting market demand analysis.
Besides this, inadequate network connectivity in remote locations might disrupt the functioning of wireless lighting systems, causing hindrances and delays in operations.
When a large number of wireless components are deployed in wireless lighting systems, unlicensed systems might breach the connectivity and hamper the efficacy of lighting systems. Such factors are expected to limit sales of wireless lighting across remote locations over the forecast period.
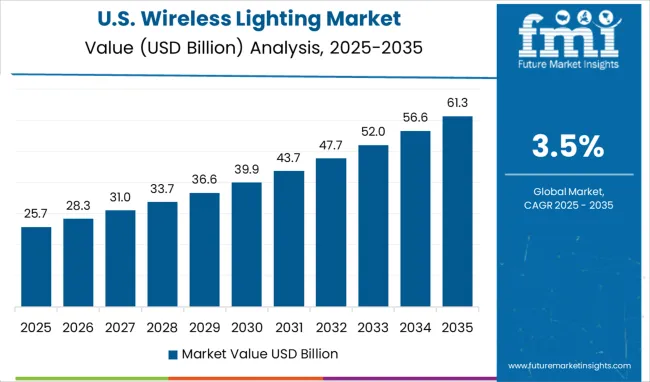
In 2025, the North America wireless lighting market is expected to hold 25% of the total wireless lighting market share. Growth in the market can be attributed to government initiatives to minimize energy consumption across various states in the USA
The presence of leading manufacturers of wireless lighting in the USA is expected to create opportunities for growth in the market. In addition to this, high demand for smart lighting across universities, schools, colleges, and offices will boost sales of wireless lighting systems.
Further, rising demand for wireless event lighting for concerts, public events, and conferences is driving product innovations in the market. Wireless lighting systems are increasingly being adopted for shooting advertisement commercials, music videos, and photoshoots.
Citing this trend, Astera, a hardware and software manufacturing specialist, collaborated with cinematographers to launch portable heavy lighting systems for the media industry. In 2020, the company developed a wireless lighting system known as Titan Tube, which includes a DMX protocol, indoor and outdoor compatibility, an AC-powered battery, unlimited usage range, and connectivity with the AsteraApp for remote access.
Demand for event wireless lighting in Canada is also gaining traction amid high influx of international tourists and rising interest in media and film communities. Backed by the aforementioned factors, sales of wireless lighting across North America will remain high.
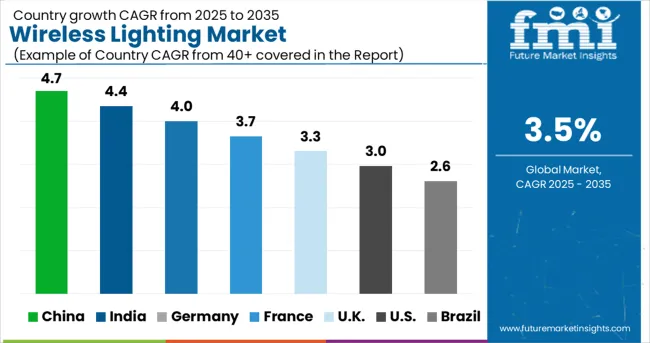
As per the report, demand for wireless lighting and smart lighting systems across Europe is expected to account for 31% of the total wireless lighting market valuation over the forecast period.
Increasing focus on implementing uniform performance standards and safety protocols for indoor and commercial lighting systems is expected to shape the wireless lighting market outlook in Europe.
Consumers in Germany, France, and Italy are preferring smart lamps and lighting systems in garages, indoor theatres, entertainment rooms, and art studios. High adoption of LED luminaires, along with the replacement of traditional systems with smart lamps in the residential sector are some of the emerging wireless lighting market trends in Europe
Numerous small smart lighting manufacturers are entering the market in Europe, while established players are constantly evolving their product portfolios by adding specific lighting solutions for applications such as landscape lighting, task lighting, downlighting, and ambient illumination.
In March 2025, one of the global leaders in wireless lighting solutions, Zumtobel Group AG presented its latest outdoor lighting solution for outdoor applications at the Data Centre World 2025 exhibition held in the UK. Such developments are expected to augment the Europe wireless lighting market size over the upcoming decade.
Amid ongoing technological advancements in residential and commercial lighting, various emerging players and startups are offering a wide range of innovative smart lighting systems, which is expected to bode well for the growth in the market.
The integration of the Internet of Things (IoT) is one of the key wireless lighting market trends, resulting in product innovations in smart cities and homes. Human-centric lighting is gaining popularity among consumers worldwide.
Taking cues, USA-based startup Aurea Lighting launched human-centric wireless lighting for commercial spaces, schools, universities, offices, and homes. These systems use a dye film that converts blue light to natural and soft lighting based on the mood. The company’s HCL solution aims to increase alertness in students and employees during work hours.
Similarly, Heliohex develops IoT-enabled LED lighting for horticulture, paving way for sustainable agriculture practices such as indoor farming. LED lighting enables farms to improve the yield and productivity in indoor farming practices as it simulates the effect of natural light using automation.
Heliox’s lighting system adjusts the color and wavelength of light to suit the photoreceptors in plants. The system also simulates the cycle of the sun from sunrise to sunset and even produces changes that occur due to seasonal variations for better crop growth.
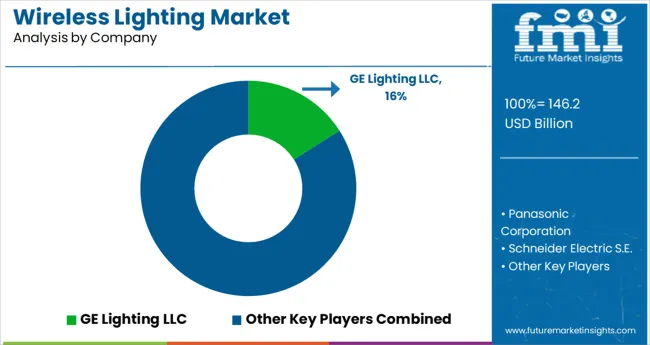
Leading wireless lighting manufacturers are investing in research and development to launch IoT-enabled wireless lighting systems for smart cities and homes. They are also launching application-specific wireless lighting for industries such as media and entertainment, agriculture and horticulture, and healthcare.
Some of the prominent players operating in the wireless lighting market include Panasonic Corporation, Schneider Electric S.E., Eaton Corporation, and Hubble Lighting Inc. Recent developments in the market include:
In March 2024, Hubble launched a new and improved NX Distributed Intelligence Lighting Control Panel (NXP2) Series. It centralizes connection points in an enclosure and reduces the time required to deploy compliant lighting control systems.
| Report Attribute | Details |
|---|---|
| Expected Market Value (2025) | USD 146.2 billion |
| Market Anticipated Forecast Value (2035) | USD 205.8 billion |
| Growth Rate | CAGR of 3.48% from 2025 to 2035 |
| Base Year for Estimation | 2024 |
| Historical Data | 2020 to 2024 |
| Forecast Period | 2025 to 2035 |
| Quantitative Units | Revenue in million and CAGR from 2025 to 2035 |
| Report Coverage | Revenue Forecast, Volume Forecast, Company Ranking, Competitive Landscape, Growth Factors, Trends, and Pricing Analysis |
| Segments Covered | Product, Application, Region |
| Regions Covered | North America; Latin America; Western Europe; Eastern Europe; APEJ; Japan; Middle East and Africa |
| Key Countries Profiled | USA, Canada, Brazil, Argentina, Germany, UK, France, Spain, Italy, Nordics, BENELUX, Australia & New Zealand, China, India, ASEAN, GCC, South Africa |
| Key Companies Profiled | Panasonic Corporation; GE Lighting LLC; Schneider Electric S.E; Acuity Brands Lighting, Inc.; Hubbell Lighting, Inc.; Honeywell International; OSRAM Licht AG; Eaton Corporation; CREE Inc.; Royal Philips NV; Leviton Manufacturing Co., Inc.; Lutron Electronics Co., Inc.; Glamox lighting; Lifi Labs Inc.; Switchmate Home LLC.; IKEA; Disano Illuminazione S.p.A; EGLO Leuchten GmbH. |
| Customization | Available Upon Request |
The global wireless lighting market is estimated to be valued at USD 146.2 billion in 2025.
It is projected to reach USD 205.8 billion by 2035.
The market is expected to grow at a 3.5% CAGR between 2025 and 2035.
The key product types are wi-fi, z-wave, zigbee, bluetooth and enocean.
residential segment is expected to dominate with a 42.0% industry share in 2025.


Our Research Products

The "Full Research Suite" delivers actionable market intel, deep dives on markets or technologies, so clients act faster, cut risk, and unlock growth.

The Leaderboard benchmarks and ranks top vendors, classifying them as Established Leaders, Leading Challengers, or Disruptors & Challengers.

Locates where complements amplify value and substitutes erode it, forecasting net impact by horizon

We deliver granular, decision-grade intel: market sizing, 5-year forecasts, pricing, adoption, usage, revenue, and operational KPIs—plus competitor tracking, regulation, and value chains—across 60 countries broadly.

Spot the shifts before they hit your P&L. We track inflection points, adoption curves, pricing moves, and ecosystem plays to show where demand is heading, why it is changing, and what to do next across high-growth markets and disruptive tech

Real-time reads of user behavior. We track shifting priorities, perceptions of today’s and next-gen services, and provider experience, then pace how fast tech moves from trial to adoption, blending buyer, consumer, and channel inputs with social signals (#WhySwitch, #UX).

Partner with our analyst team to build a custom report designed around your business priorities. From analysing market trends to assessing competitors or crafting bespoke datasets, we tailor insights to your needs.
Supplier Intelligence
Discovery & Profiling
Capacity & Footprint
Performance & Risk
Compliance & Governance
Commercial Readiness
Who Supplies Whom
Scorecards & Shortlists
Playbooks & Docs
Category Intelligence
Definition & Scope
Demand & Use Cases
Cost Drivers
Market Structure
Supply Chain Map
Trade & Policy
Operating Norms
Deliverables
Buyer Intelligence
Account Basics
Spend & Scope
Procurement Model
Vendor Requirements
Terms & Policies
Entry Strategy
Pain Points & Triggers
Outputs
Pricing Analysis
Benchmarks
Trends
Should-Cost
Indexation
Landed Cost
Commercial Terms
Deliverables
Brand Analysis
Positioning & Value Prop
Share & Presence
Customer Evidence
Go-to-Market
Digital & Reputation
Compliance & Trust
KPIs & Gaps
Outputs
Full Research Suite comprises of:
Market outlook & trends analysis
Interviews & case studies
Strategic recommendations
Vendor profiles & capabilities analysis
5-year forecasts
8 regions and 60+ country-level data splits
Market segment data splits
12 months of continuous data updates
DELIVERED AS:
PDF EXCEL ONLINE
Wireless EEG Monitoring System Market Size and Share Forecast Outlook 2025 to 2035
Wireless Refrigerant Charging Scale Market Size and Share Forecast Outlook 2025 to 2035
Wireless Hydrometer Market Size and Share Forecast Outlook 2025 to 2035
Wireless HDMI Transmitter and Receiver Market Size and Share Forecast Outlook 2025 to 2035
Wireless Access Point Market Size and Share Forecast Outlook 2025 to 2035
Wireless Video - 2.4/5GHz Market Size and Share Forecast Outlook 2025 to 2035
Wireless Polysomnography Market Size and Share Forecast Outlook 2025 to 2035
Wireless Audio Devices Market Size and Share Forecast Outlook 2025 to 2035
Wireless Communication Technologies In Healthcare Market Size and Share Forecast Outlook 2025 to 2035
Wireless Mesh Network Market Size and Share Forecast Outlook 2025 to 2035
Wireless Sensor Tags Market Size and Share Forecast Outlook 2025 to 2035
Wireless Sensor Network Market Size and Share Forecast Outlook 2025 to 2035
Wireless Power Transmission Market Size and Share Forecast Outlook 2025 to 2035
Wireless Home Security Camera Market Size and Share Forecast Outlook 2025 to 2035
Wireless Testing Market Size and Share Forecast Outlook 2025 to 2035
Wireless Power Bank Market Size and Share Forecast Outlook 2025 to 2035
Wireless Battery Monitoring System Market Size and Share Forecast Outlook 2025 to 2035
Wireless Printer Market Size and Share Forecast Outlook 2025 to 2035
Wireless Headphones Market Size and Share Forecast Outlook 2025 to 2035
Wireless Sensors Market Size and Share Forecast Outlook 2025 to 2035

Thank you!
You will receive an email from our Business Development Manager. Please be sure to check your SPAM/JUNK folder too.
Chat With
MaRIA