The Wireless Surgical Cameras Market is estimated to be valued at USD 93.0 million in 2025 and is projected to reach USD 190.0 million by 2035, registering a compound annual growth rate (CAGR) of 7.4% over the forecast period.
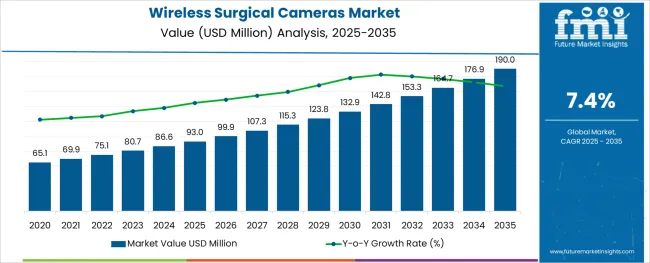
The wireless surgical cameras market is expanding steadily due to the growing emphasis on enhancing surgical precision and reducing procedure times. Advances in wireless technology have enabled the development of compact and highly maneuverable cameras that provide surgeons with clear, real-time visuals without the constraints of cables.
Healthcare facilities are increasingly adopting these devices to improve operating room efficiency and reduce infection risks associated with wired equipment. The rise in minimally invasive surgeries and the need for better visualization in complex procedures have further fueled market growth.
Additionally, hospitals are investing in modern surgical imaging solutions to improve patient outcomes and support surgical training programs. The market outlook remains positive as ongoing technological innovations and increased healthcare infrastructure spending continue to drive demand. Segmental growth is expected to be led by Surgical Light Mounted Wireless Surgical Cameras due to their integrated design and convenience, with hospitals being the primary end users reflecting the clinical adoption trends.
The market is segmented by Product and End User and region. By Product, the market is divided into Surgical Light Mounted Wireless Surgical Cameras, Head Mount Wireless Surgical Cameras, and Endoscopic wireless surgical Cameras. In terms of End User, the market is classified into Hospitals, Speciality Clinics, and Ambulatory Surgical Centers. Regionally, the market is classified into North America, Latin America, Western Europe, Eastern Europe, Balkan & Baltic Countries, Russia & Belarus, Central Asia, East Asia, South Asia & Pacific, and the Middle East & Africa.
The market is segmented by Product and End User and region. By Product, the market is divided into Surgical Light Mounted Wireless Surgical Cameras, Head Mount Wireless Surgical Cameras, and Endoscopic wireless surgical Cameras. In terms of End User, the market is classified into Hospitals, Speciality Clinics, and Ambulatory Surgical Centers. Regionally, the market is classified into North America, Latin America, Western Europe, Eastern Europe, Balkan & Baltic Countries, Russia & Belarus, Central Asia, East Asia, South Asia & Pacific, and the Middle East & Africa.
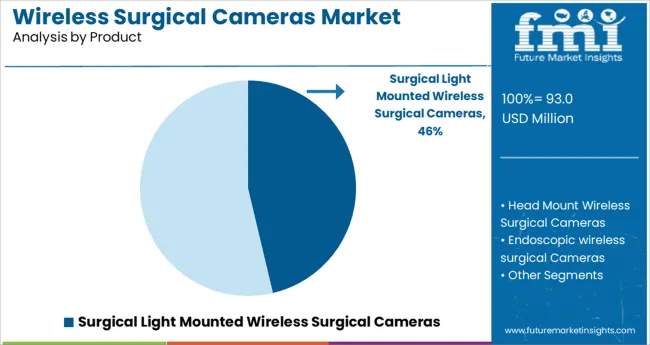
The Surgical Light Mounted Wireless Surgical Cameras segment is projected to hold 46.3% of the market revenue in 2025, making it the dominant product type. This segment has grown because these cameras offer seamless integration with existing surgical lighting, minimizing clutter and improving workflow. The wireless feature provides enhanced mobility and flexibility for surgeons during procedures.
Their compact design and ease of installation have contributed to widespread adoption in operating rooms. Additionally, the image quality and real-time video streaming capabilities support precise surgical interventions.
These factors have driven preference for surgical light mounted models over standalone units, consolidating their market leadership.
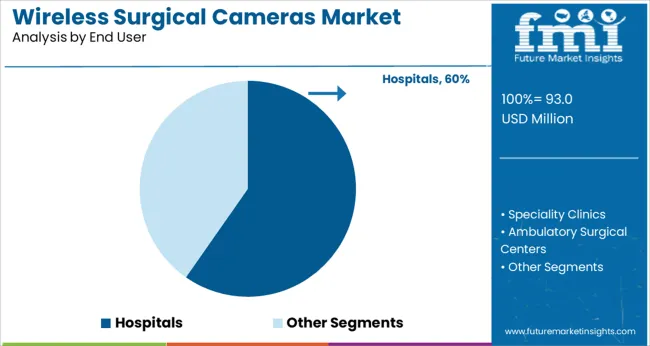
The Hospitals segment is expected to account for 59.7% of the wireless surgical cameras market revenue in 2025, maintaining its position as the largest end user. Hospitals have prioritized these advanced imaging solutions to enhance surgical accuracy and patient safety. The demand is driven by the high volume of surgeries performed in hospital settings and the need for improved intraoperative visualization tools.
Hospitals have also increased their investments in minimally invasive and robotic-assisted surgeries, where wireless cameras play a critical role.
Furthermore, the capability to integrate these devices with hospital information systems and training platforms supports their expanding use. As surgical departments continue to modernize, the hospital segment is anticipated to sustain its market dominance.
The market value for wireless surgical cameras was approximately 2.4% of the overall USD 86.6 Billion of the global medical cameras market in 2024.
There are many surgical recording cameras on the market, and the one utilized in surgery the most is the one that is integrated into a headlight. Livestreaming surgery could replicate the active learning that occurs in operating rooms (OR) if it is made available in training facilities. Some facilities already have ORs with video cameras set up to broadcast over the internet to authorized remote viewers.
Additionally, the development of capsule endoscopy (CE) in 2000 offered a brand-new non-invasive method of imaging the small bowel, which was previously challenging to access. As peristalsis moves a swallowable pill camera through the gastrointestinal (GI) tract, images are recorded and later converted to video on a computer. It is now recognized as the first-line investigation for disorders of the small boweless energy than a wired system, resulting in procedures that are both environmentally friendly and economically advantageous.
Thus, owing to the aforementioned factors, demand in the global wireless surgical cameras market is expected to grow at a CAGR of 7.4% during the forecast period from 2025 to 2035.
The market for wireless surgical cameras is likely to witness propulsion in terms of demand and adoption, owing to the development of single-incision laparoscopic surgery (SILS), which was introduced to reduce the number of incisions made during a laparoscopic surgical procedure.
This approach is less invasive, and the adoption of these technologies has gradually gained ground. Patients who undergo SILS as opposed to conventional multi-port laparoscopic surgery experience less discomfort, less postoperative pain, a quicker recovery, and better scarring results.
The concept of a laparoscopic camera that may be fully inserted and operated remotely inside the human abdominal cavity has recently been the driving force behind the development of next-generation laparoscopes. From cable tethering, mechanical anchoring, and motorized actuation, related work has advanced in two directions: tether-less access, and non-contact actuation.
For operating the actuator, a lightweight collaborative robotic arm that can sense force and detect collisions is used, which not only offers robotic help but also safely engages with surgeons. When a collision event or an overload is detected, this robotic arm stops in milliseconds.
This robot arm works together and communicates with surgeons simultaneously, unlike teleoperated slave robots. In the event of an incident, surgeons can take control of the actuator intraoperatively and move it swiftly to a desired safe position to prevent further injuries by physically moving the collaborating arm. This innovation will create a wide range of potential applications for wireless surgical cameras, which in turn will boost sales in the market.
Modern wireless endoscopic cameras have an edge over traditional surgery in terms of illumination and magnification of the laparoscope. Endoscopy, however, has not taken off as swiftly as was anticipated, particularly in underdeveloped nations.
High expenditures, equipment complexity, and a dearth of specialist training facilities are the factors of these delays. High-income economies currently develop and produce most of the technology utilized in surgical endoscopy today. Technology transfer to locations with limited resources is challenging due to the cost of this equipment.
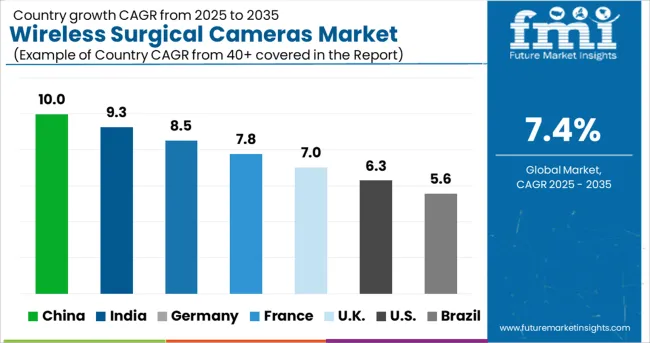
High Investments in the Healthcare Sector Will Boost Sales of Wireless Surgical Cameras in the USA
The USA dominated the North America wireless surgical cameras market in 2024, holding about 87.2% of the total market share. As per FMI, the trend is expected to continue over the forecast period.
Increasing need for minimally invasive procedures, rapid adoption of technologically-advanced medical equipment, and the presence of enhanced healthcare infrastructure are expected to bode well for the market over the forecast period.
High Demand for Advanced Wireless Surgical Cameras in Japan and China Will Fuel Growth
Japan held approximately 33.2%, and China accounted for nearly 47.8% of the East Asia market share in 2024. The market for Ultra High Definition (UHD) surgical display wireless surgical cameras, which quadruple the 4k resolution ones, has been expanding in Japan for the past few years as a result of the recent wave of technological automation.
In Japan, 4K surgical displays are accessible but less popular than UHD models. There is still a sizable HD installed base in both Japan and China, despite a growing percentage of facilities switching to UHD and 4K. The rise in the number of units sold in the market will be fuelled by the conversion of this installed base.
Rising Influx of Medical Tourists in Germany Will Drive Demand for Wireless Surgical Cameras
Germany accounted for nearly 27.5% of the Europe wireless surgical cameras market in 2024. The growth in the market is primarily propelled by greater volumes of medical tourists into the country.
With the rising rates of medical procedures, including cosmetic dentistry, the adoption of intraoral cameras, as well as wireless surgical cameras has gained importance. This factor is expected to boost the sales of wireless surgical cameras over the forecast period.
The Adoption of Head Mount Wireless Surgical Cameras is Gaining Momentum
Based on product type, sales of head mount wireless surgical cameras are expected to increase at a 7% CAGR over the assessment period. Head mount wireless surgical cameras provide advantages such as tether-free approach of a cordless system, as well as the availability of enhanced integrated imaging resolution.
Essentially, endoscopic wireless surgical cameras also aid with a minimally invasive surgical procedure and thus promote a positive patient recovery rate with reduced time and reduced length of hospital stay.
Sales of Wireless Surgical Cameras Across Hospitals to Remain High
In terms of end user, hospitals accounted for 53.5% of the total market share in 2024. Growing prevalence of chronic and infectious diseases, as well as the associated volumes of surgical procedures will continue driving sales in this segment.
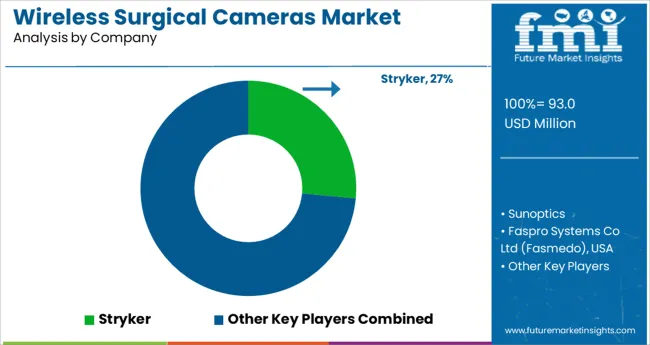
By combining their products in cost-effective packages, manufacturers compete on pricing. The dynamics of the market have changed as a result of new competitors. By making significant investments in businesses that make endoscopic devices and video-based systems, manufacturers of OR equipment are starting to compete in other markets. HD wireless surgical cameras have become the current industry standard. For instance:
| Attribute | Details |
|---|---|
| Estimated Market Size (2025) | USD 75.1 million |
| Projected Market Valuation (2035) | USD 153.3 million |
| Value-based CAGR (2025-2035) | 7.4% |
| Forecast Period | 2020 to 2024 |
| Historical Data Available for | 2025 to 2035 |
| Market Analysis | million for Value |
| Key Regions Covered | North America, Latin America, Europe, South Asia, East Asia, Oceania, and Middle East & Africa |
| Key Countries Covered | The USA, Canada, Brazil, Mexico, Argentina, the UK, Germany, Italy, Russia, Spain, France, BENELUX, India, Thailand, Indonesia, Malaysia, Japan, China, South Korea, Australia, New Zealand, Turkey, GCC, and South Africa |
| Key Market Segments Covered | Product, End User, and Region |
| Key Companies Profiled | Sunoptics; Faspro Systems Co Ltd(fasmedo), USA; Stryker; Firefly Global; Surgiris; North Southern Electronics Limited, China; Xenosys USA; Precision Surgical Ltd; Steris PLC; Hill-Rom Services, Inc |
The global wireless surgical cameras market is estimated to be valued at USD 93.0 million in 2025.
It is projected to reach USD 190.0 million by 2035.
The market is expected to grow at a 7.4% CAGR between 2025 and 2035.
The key product types are surgical light mounted wireless surgical cameras, head mount wireless surgical cameras and endoscopic wireless surgical cameras.
hospitals segment is expected to dominate with a 59.7% industry share in 2025.


Our Research Products

The "Full Research Suite" delivers actionable market intel, deep dives on markets or technologies, so clients act faster, cut risk, and unlock growth.

The Leaderboard benchmarks and ranks top vendors, classifying them as Established Leaders, Leading Challengers, or Disruptors & Challengers.

Locates where complements amplify value and substitutes erode it, forecasting net impact by horizon

We deliver granular, decision-grade intel: market sizing, 5-year forecasts, pricing, adoption, usage, revenue, and operational KPIs—plus competitor tracking, regulation, and value chains—across 60 countries broadly.

Spot the shifts before they hit your P&L. We track inflection points, adoption curves, pricing moves, and ecosystem plays to show where demand is heading, why it is changing, and what to do next across high-growth markets and disruptive tech

Real-time reads of user behavior. We track shifting priorities, perceptions of today’s and next-gen services, and provider experience, then pace how fast tech moves from trial to adoption, blending buyer, consumer, and channel inputs with social signals (#WhySwitch, #UX).

Partner with our analyst team to build a custom report designed around your business priorities. From analysing market trends to assessing competitors or crafting bespoke datasets, we tailor insights to your needs.
Supplier Intelligence
Discovery & Profiling
Capacity & Footprint
Performance & Risk
Compliance & Governance
Commercial Readiness
Who Supplies Whom
Scorecards & Shortlists
Playbooks & Docs
Category Intelligence
Definition & Scope
Demand & Use Cases
Cost Drivers
Market Structure
Supply Chain Map
Trade & Policy
Operating Norms
Deliverables
Buyer Intelligence
Account Basics
Spend & Scope
Procurement Model
Vendor Requirements
Terms & Policies
Entry Strategy
Pain Points & Triggers
Outputs
Pricing Analysis
Benchmarks
Trends
Should-Cost
Indexation
Landed Cost
Commercial Terms
Deliverables
Brand Analysis
Positioning & Value Prop
Share & Presence
Customer Evidence
Go-to-Market
Digital & Reputation
Compliance & Trust
KPIs & Gaps
Outputs
Full Research Suite comprises of:
Market outlook & trends analysis
Interviews & case studies
Strategic recommendations
Vendor profiles & capabilities analysis
5-year forecasts
8 regions and 60+ country-level data splits
Market segment data splits
12 months of continuous data updates
DELIVERED AS:
PDF EXCEL ONLINE
Wireless EEG Monitoring System Market Size and Share Forecast Outlook 2025 to 2035
Wireless Refrigerant Charging Scale Market Size and Share Forecast Outlook 2025 to 2035
Wireless Hydrometer Market Size and Share Forecast Outlook 2025 to 2035
Wireless HDMI Transmitter and Receiver Market Size and Share Forecast Outlook 2025 to 2035
Surgical Tourniquet Market Size and Share Forecast Outlook 2025 to 2035
Surgical Operating Microscope Market Forecast and Outlook 2025 to 2035
Wireless Access Point Market Size and Share Forecast Outlook 2025 to 2035
Surgical Heart Valves Market Size and Share Forecast Outlook 2025 to 2035
Wireless Video - 2.4/5GHz Market Size and Share Forecast Outlook 2025 to 2035
Wireless Polysomnography Market Size and Share Forecast Outlook 2025 to 2035
Surgical Aspirators Market Size and Share Forecast Outlook 2025 to 2035
Surgical Robot Procedures Market Size and Share Forecast Outlook 2025 to 2035
Wireless Audio Devices Market Size and Share Forecast Outlook 2025 to 2035
Wireless Communication Technologies In Healthcare Market Size and Share Forecast Outlook 2025 to 2035
Wireless Mesh Network Market Size and Share Forecast Outlook 2025 to 2035
Wireless Sensor Tags Market Size and Share Forecast Outlook 2025 to 2035
Wireless Sensor Network Market Size and Share Forecast Outlook 2025 to 2035
Wireless Power Transmission Market Size and Share Forecast Outlook 2025 to 2035
Wireless Home Security Camera Market Size and Share Forecast Outlook 2025 to 2035
Wireless Testing Market Size and Share Forecast Outlook 2025 to 2035

Thank you!
You will receive an email from our Business Development Manager. Please be sure to check your SPAM/JUNK folder too.
Chat With
MaRIA