Wireless Polysomnography Market Size and Share Forecast Outlook 2025 to 2035

The Wireless Polysomnography Market is estimated to be valued at USD 218.8 billion in 2025 and is projected to reach USD 354.4 billion by 2035, registering a compound annual growth rate (CAGR) of 4.9% over the forecast period.
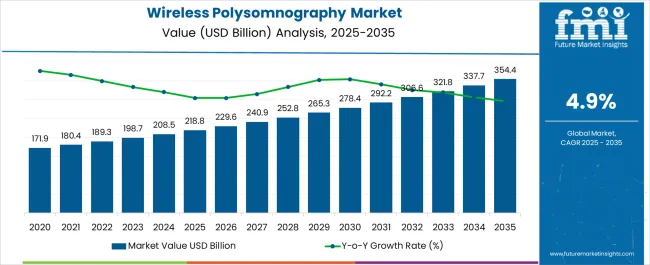
Quick Stats for Wireless Polysomnography Market

  • Wireless Polysomnography Market Industry Value (2025): USD 218.8 billion
  • Wireless Polysomnography Market Forecast Value (2035): USD 354.4 billion
  • Wireless Polysomnography Market Forecast CAGR: 4.9%
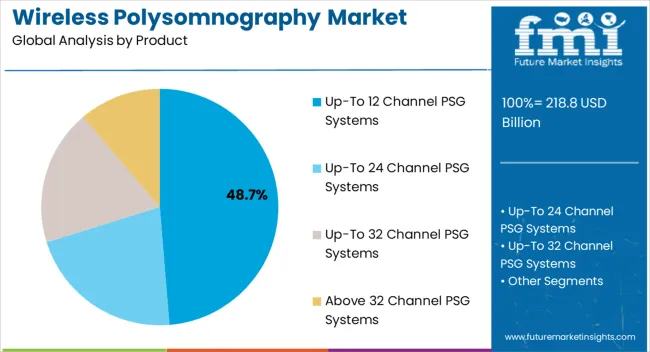
  • Leading Segment in Wireless Polysomnography Market in 2025: Up-To 12 Channel PSG Systems (48.7%)
  • Key Growth Region in Wireless Polysomnography Market: North America, Asia-Pacific, Europe
  • Top Key Players in Wireless Polysomnography Market: Nox Medical, Onera Technologies B.V., SOMNOmedics GmbH, Recorders & Medicare Systems P Ltd., VentMed Technology Medical Co. Ltd, Koninklijke Philips N.V., Allengers Medical Systems Limited, Natus Medical Incorporated

Wireless Polysomnography Market Market Value Analysis

Metric Value
Wireless Polysomnography Market Estimated Value in (2025 E) USD 218.8 billion
Wireless Polysomnography Market Forecast Value in (2035 F) USD 354.4 billion
Forecast CAGR (2025 to 2035) 4.9%

Rationale for Segmental Growth in the Wireless Polysomnography Market

The wireless polysomnography market is experiencing rapid growth driven by the increasing prevalence of sleep disorders, rising demand for home based monitoring, and advancements in wireless medical technologies. The need for accurate yet patient friendly diagnostic solutions has accelerated adoption of wireless PSG systems, which reduce discomfort while maintaining high diagnostic accuracy.

Healthcare providers are increasingly shifting toward ambulatory monitoring solutions to lower costs and improve patient convenience, while regulatory bodies emphasize early detection of sleep related conditions such as obstructive sleep apnea. Continuous innovation in signal processing, cloud connectivity, and integration with wearable sensors is enabling more reliable and scalable use of wireless PSG systems across clinical and remote settings.

The future outlook remains promising as healthcare systems prioritize preventive care, remote monitoring, and efficiency in diagnostic workflows.
Segmental Analysis

Insights into the Up To 12 Channel PSG Systems Product Segment

Wireless Polysomnography Market Analysis By Product

The up to 12 channel PSG systems segment is expected to account for 48.70% of total revenue by 2025 within the product category, making it the leading segment. Growth is being driven by the balance between affordability, portability, and sufficient diagnostic capability for common sleep disorders.

These systems are preferred in ambulatory and home based settings as they provide accurate results while minimizing complexity and patient discomfort. Healthcare providers value their efficiency in data collection and analysis, which supports widespread adoption.

This combination of convenience, cost effectiveness, and adequate diagnostic scope has strengthened the leadership of this product segment.
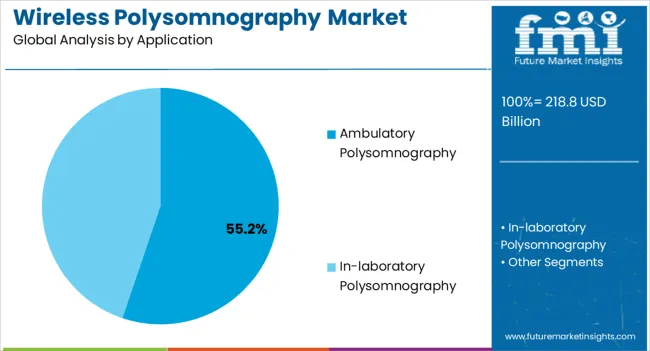
Insights into the Ambulatory Polysomnography Application Segment

Wireless Polysomnography Market Analysis By Application

The ambulatory polysomnography segment is projected to contribute 55.20% of total revenue by 2025 within the application category, positioning it as the dominant segment. This growth is supported by increasing preference for home based diagnostics that enhance patient comfort and compliance while reducing hospitalization costs.

Ambulatory PSG allows real time monitoring in natural sleep environments, improving diagnostic accuracy for conditions that may be missed in clinical labs. The segment is also benefiting from advancements in compact wireless devices and cloud based data reporting, which streamline workflows for healthcare professionals.

These advantages have made ambulatory polysomnography the preferred application, reinforcing its market leadership.
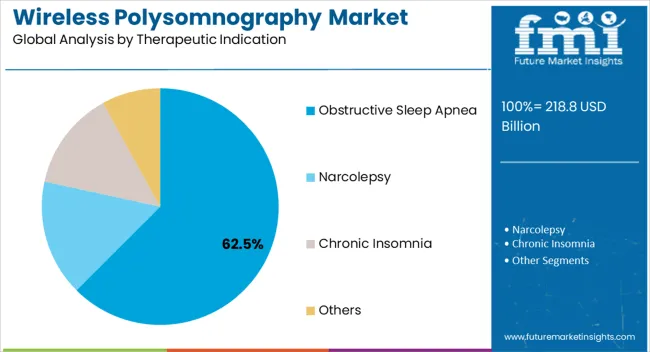
Insights into the Obstructive Sleep Apnea Therapeutic Indication Segment

Wireless Polysomnography Market Analysis By Therapeutic Indication

The obstructive sleep apnea segment is estimated to represent 62.50% of market revenue by 2025 within the therapeutic indication category, making it the most significant contributor. Growth is being propelled by the rising global burden of sleep apnea linked to obesity, aging populations, and lifestyle changes.

The need for early detection and long term management of the condition has accelerated adoption of wireless PSG systems in both clinical and ambulatory care. Insurance coverage expansions and growing awareness of the health risks associated with untreated sleep apnea have further reinforced segment growth.

This therapeutic area remains the cornerstone of demand for wireless polysomnography solutions due to its high prevalence and critical health implications.

Comparison of Historical Trends 2020 to 2025 with Forecast Growth Outlook 2025 to 2035

From 2012 to 2025, the global wireless polysomnography market experienced a CAGR of 3.6%, reaching a market size of USD 218.8 million in 2025.

From 2012 to 2025, the global wireless polysomnography industry witnessed steady growth due to the greater mobility and ease of use. Polysomnography was mostly performed in sleep labs using wired equipment.

Wireless PSG systems were designed to provide a more convenient and comfortable option. Because of their greater mobility and ease of use, wireless PSG systems have grown in popularity. Adoption in sleep clinics and hospitals has increasing.

Wireless communication and sensor technology advancements have greatly expanded the possibilities of wireless PSG systems. As a result, data gathering, analysis, and patient comfort have all improved.

Future Forecast for Wireless Polysomnography Industry:

Looking ahead, the global wireless polysomnography industry is expected to rise at a CAGR of 5.2% from 2025 to 2035. During the forecast period, the market size is expected to reach USD 354.4 million by 2035.

The wireless polysomnography industry is expected to continue its growth trajectory from 2025 to 2035, driven by increasing prevalence of sleep apnea. Sleep disorders including sleep apnea and insomnia are growing increasingly common as a result of causes such as lifestyle changes, stress, and ageing populations. This trend is projected to boost future demand for wireless PSG systems.

Home-based sleep monitoring is becoming more popular as a way to improve patient comfort and convenience while lowering healthcare expenses. Wireless PSG devices are ideal for this application because they allow patients to complete sleep studies in the comfort of their own homes.
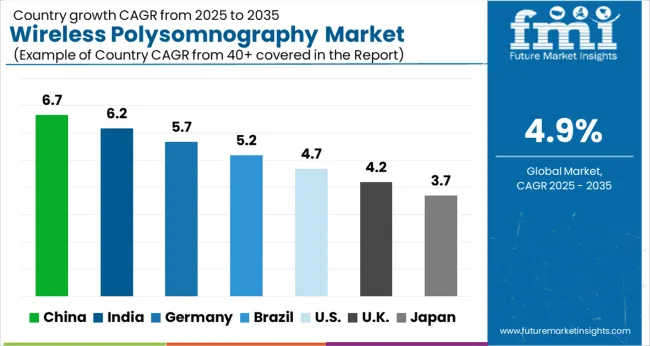
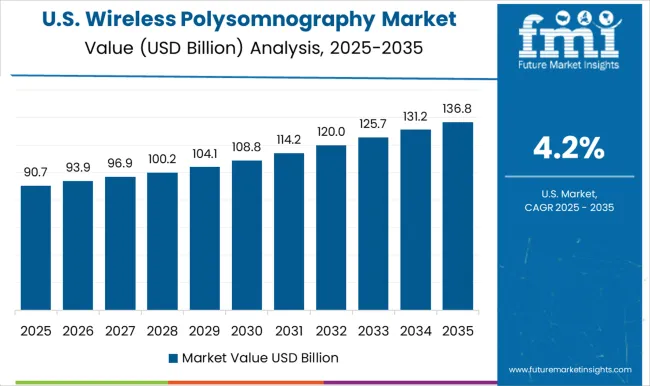
Analysis of Top Countries Using Wireless Polysomnography Devices

Wireless Polysomnography Market Cagr Analysis By Country

Wireless Polysomnography Market to Surge in the United States Due to Prevalence Of Sleep-Related Disorders.

Wireless Polysomnography Market Country Value Analysis

Country The United States
Market Size (USD million) by End of Forecast Period (2035) USD 354.4 million
CAGR % 2025 to End of Forecast (2035) 4.7%

The wireless polysomnography industry in the United States is expected to reach a market size of USD 354.4 million by 2035, expanding at a CAGR of 4.7%. Wireless polysomnography is expected to see growth in the US market due to the increasing prevalence of sleep-related disorders.

The America Sleep Association estimates that between 50 and 208.5 million individuals in the USA have sleep apnea in 2024. In the United States, sleep problems are fairly common, thus a proper diagnosis is also quite important. As a result, the country is adopting wireless polysomnography equipment for medical diagnostics.

Rising Demand for Wireless Polysomnography Due to Government Initiatives and Favorable Policies to Combat Obstructive Sleep Apnea Cycle.

Country The United Kingdom
Market Size (USD million) by End of Forecast Period (2035) USD 20.1 million
CAGR % 2025 to End of Forecast (2035) 6.4%

The wireless polysomnography industry in the United Kingdom is expected to reach a market value of USD 20.1 million, expanding at a CAGR of 6.4% during the forecast period. The United Kingdom market is projected to growth of the market due to the growing government initiatives and favorable policies.

The government of the United Kingdom has taken, or is preparing to take, a number of actions to combat obstructive sleep apnea cycle. In section 3.10, the government lists sleep apnea as an adult impairment. Such patients receive additional advantages, from education to therapy, removing any financial strain. The above-mentioned regulations all increased the need for wireless polysomnography.

Notable Growth Expected in China's Wireless Polysomnography Market as Increasing Prevalence of Sleep Related Disorders

Country China
Market Size (USD million) by End of Forecast Period (2035) USD 21.1 million
CAGR % 2025 to End of Forecast (2035) 6.0%

The wireless polysomnography industry in China is anticipated to reach a market size of USD 21.1 million, moving at a CAGR of 6.0% during the forecast period. The wireless polysomnography industry in China is expected to grow prominently due to the increasing prevalence of sleep related disorders.

Obstructive sleep apnea and other sleep disorders are quite prevalent in China. According to the paper A narrative review of obstructive sleep apnea in China: A sleeping giant in disease pathology, in Heart Mind 2025, 218.8 million Chinese citizens suffer from obstructive sleep apnea. This rising prevalence contributes to the market growth for wireless polysomnography in the country.

Growing Awareness and Acceptance to Drive Market Growth in Japan

Country Japan
Market Size (USD million) by End of Forecast Period (2035) USD 15.2 million
CAGR % 2025 to End of Forecast (2035) 5.7%

The wireless polysomnography industry in Japan is estimated to reach a market size of USD 15.2 million by 2035, thriving at a CAGR of 5.7%. The market in Japan is predicted to grow because of the growing awareness and acceptance.

There is an increasing need for efficient treatment alternatives, such as polysomnography in the country as more individuals are becoming aware of the health dangers linked to disorders that cause sleep disorder issues. The elderly population in Japan is another significant market driver. The chance of developing sleep apnea rises with age, increasing the need for polysomnography.

Demand for Wireless Polysomnography is Rising Due to Increased Prevalence of Insomnia in South Korea

Country South Korea
Market Size (USD million) by End of Forecast Period (2035) USD 12.3 million
CAGR % 2025 to End of Forecast (2035) 6.3%

The wireless polysomnography industry in South Korea is expected to reach a market size of USD 12.3 million, expanding at a CAGR of 6.3% during the forecast period. In South Korea, sleeplessness is more common than earlier.

People who experience the symptoms of insomnia report a worsening of their quality of life in many areas and have a higher risk of developing other psychiatric illnesses. Thus, the rising incidence of insomnia is increasing people's knowledge of sleep problems, which is assisting the market's expansion.

Wireless Polysomnography Industry Analysis by Top Investment Categories

Up-to 24 Channel PSG Systems to Dominate Wireless Polysomnography Industry with 8.0% CAGR through 2035

The up-to 24 channel PSG systems is expected to dominate the wireless polysomnography industry with a CAGR of 4.4% from 2025 to 2035. Since there are more devices in the range of up to 24 channel PSG systems available than in the other product categories, this sector dominates the market for wireless polysomnography equipment.

Which Applications is Leading the Wireless Polysomnography Market?

The Ambulatory PSG segments are expected to dominate the wireless polysomnography industry with a CAGR of 5.6% from 2025 to 2035. This segment captures a significant market share in 2025.

Ambulatory PSG sleep tests are increasingly being used to diagnose sleep disorders. Ambulatory PSG allows to conduct of an overnight polysomnography assessment while the patient is still at home. These technologies provide sleep clinics with the flexibility of wireless and portable PSG systems by transporting sleep studies from the sleep clinic to the patient's home.

Which Therapeutic Indication is Leading Wireless Polysomnography Market?

The Obstructive sleep apnea (OSA) segments is expected to dominate the wireless polysomnography industry with a CAGR of 4.7% from 2025 to 2035. As the occurrences of obstructive sleep apnea are increasing in comparison to the other sectors, this category is going to hold a considerable market share in 2025.

Polysomnography captures and classifies sleep phases, as well as the occurrence and duration of apneic and hypopneic episodes. It is useful for verifying OSA diagnosis and assessing OSA severity.

Which End User is Widely Adopted the Wireless Polysomnography?

The sleep laboratories segment is expected to dominate the wireless polysomnography industry with a CAGR of 4.7% from 2025 to 2035. The increasing number of clinics sleep clinics or laboratories in the field of sleep medicine is a key factor due to which the sleep laboratories have been estimated to account for more than half of the share of the end user segment in the forecast period as well.
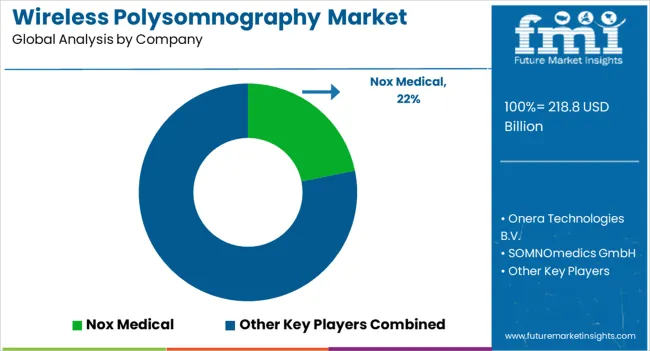
Competitive Landscape in the Wireless Polysomnography Market

Wireless Polysomnography Market Analysis By Company

The wireless polysomnography sector is fiercely competitive, with many companies fighting for market dominance. To stay ahead of the competition in such a circumstance, essential players must employ smart techniques.

Key Strategies Used by the Participants

Product Innovation

Key players focus on developing and introducing innovative products to address unmet needs in the market. They invest in research and development to improve existing formulations, delivery systems, and enhance the efficacy and safety of the products

Strategic Partnerships and Collaborations

Key players often form strategic partnerships and collaborations with other companies, research institutes, or healthcare organizations, these partnerships allow for knowledge sharing, joint research and development efforts, and access to complementary technologies or expertise.

Expansion into Emerging Markets

Key players strive to expand their presence in different geographic regions to tap into new markets and reach a wider customer base. They may establish subsidiaries, distribution networks or strategic alliances in various countries to strengthen their market position.

Mergers and Acquisitions

Companies in the market may engage in mergers or acquisitions to consolidate their product portfolio, acquire new technologies, these strategic moves allow companies to enter new market segments, gain access to novel products or intellectual property, and achieve synergies in terms of research, manufacturing, or distributions.

Top Players in the Wireless Polysomnography Market by Market Share

  • Nox Medical
  • Onera Technologies B.V.
  • SOMNOmedics GmbH
  • Recorders & Medicare Systems P Ltd.
  • VentMed Technology Medical Co. Ltd
  • Koninklijke Philips N.V.
  • Allengers Medical Systems Limited
  • Natus Medical Incorporated

Key Developments in the Wireless Polysomnography Market:

  • In August 2024, The SOMNOscreen HD, SOMNOscreen plus, and SOMNOscreen Eco polysomnography devices from SOMNOmedics GmbH have been given FDA clearance for paediatric usage.
  • In April 2025, Onera Health's non-invasive patch-based, clinical-grade, portable medical device for polysomnography was approved by the US Food and Drug Administration.

Top Segments Studied in the Wireless Polysomnography Market Research Report

By Product:

  • Up-to 12 Channel PSG Systems
  • Up-to 24 Channel PSG Systems
  • Up-to 32 Channel PSG Systems
  • Above 32 Channel PSG Systems

By Application:

  • Ambulatory Polysomnography
  • In-laboratory Polysomnography

By Therapeutic Indication:

  • Obstructive Sleep Apnea
  • Narcolepsy
  • Chronic Insomnia
  • Others

By End User:

  • Hospitals
  • Specialty Clinics
  • Rehabilitation Centers
  • Homecare Settings

By Region:

  • North America
  • Latin America
  • Europe
  • East Asia
  • South Asia
  • Oceania
  • The Middle East & Africa

Frequently Asked Questions

How big is the wireless polysomnography market in 2025?

The global wireless polysomnography market is estimated to be valued at USD 218.8 billion in 2025.

What will be the size of wireless polysomnography market in 2035?

The market size for the wireless polysomnography market is projected to reach USD 354.4 billion by 2035.

How much will be the wireless polysomnography market growth between 2025 and 2035?

The wireless polysomnography market is expected to grow at a 4.9% CAGR between 2025 and 2035.

What are the key product types in the wireless polysomnography market?

The key product types in wireless polysomnography market are up-to 12 channel psg systems, up-to 24 channel psg systems, up-to 32 channel psg systems and above 32 channel psg systems.

Which application segment to contribute significant share in the wireless polysomnography market in 2025?

In terms of application, ambulatory polysomnography segment to command 55.2% share in the wireless polysomnography market in 2025.

Table of Content

  1. Executive Summary
    • Global Market Outlook
    • Demand-side Trends
    • Supply-side Trends
    • Technology Roadmap Analysis
    • Analysis and Recommendations
  2. Market Overview
    • Market Coverage / Taxonomy
    • Market Definition / Scope / Limitations
  3. Market Background
    • Market Dynamics
      • Drivers
      • Restraints
      • Opportunity
      • Trends
    • Scenario Forecast
      • Demand in Optimistic Scenario
      • Demand in Likely Scenario
      • Demand in Conservative Scenario
    • Opportunity Map Analysis
    • Product Life Cycle Analysis
    • Supply Chain Analysis
    • Investment Feasibility Matrix
    • Value Chain Analysis
    • PESTLE and Porter’s Analysis
    • Regulatory Landscape
    • Regional Parent Market Outlook
    • Production and Consumption Statistics
    • Import and Export Statistics
  4. Global Market Analysis 2020 to 2024 and Forecast, 2025 to 2035
    • Historical Market Size Value (USD Million) Analysis, 2020 to 2024
    • Current and Future Market Size Value (USD Million) Projections, 2025 to 2035
      • Y-o-Y Growth Trend Analysis
      • Absolute $ Opportunity Analysis
  5. Global Market Pricing Analysis 2020 to 2024 and Forecast 2025 to 2035
  6. Global Market Analysis 2020 to 2024 and Forecast 2025 to 2035, By Product
    • Introduction / Key Findings
    • Historical Market Size Value (USD Million) Analysis By Product , 2020 to 2024
    • Current and Future Market Size Value (USD Million) Analysis and Forecast By Product , 2025 to 2035
      • Up-To 12 Channel PSG Systems
      • Up-To 24 Channel PSG Systems
      • Up-To 32 Channel PSG Systems
      • Above 32 Channel PSG Systems
    • Y-o-Y Growth Trend Analysis By Product , 2020 to 2024
    • Absolute $ Opportunity Analysis By Product , 2025 to 2035
  7. Global Market Analysis 2020 to 2024 and Forecast 2025 to 2035, By Application
    • Introduction / Key Findings
    • Historical Market Size Value (USD Million) Analysis By Application, 2020 to 2024
    • Current and Future Market Size Value (USD Million) Analysis and Forecast By Application, 2025 to 2035
      • Ambulatory Polysomnography
      • In-laboratory Polysomnography
    • Y-o-Y Growth Trend Analysis By Application, 2020 to 2024
    • Absolute $ Opportunity Analysis By Application, 2025 to 2035
  8. Global Market Analysis 2020 to 2024 and Forecast 2025 to 2035, By Therapeutic Indication
    • Introduction / Key Findings
    • Historical Market Size Value (USD Million) Analysis By Therapeutic Indication, 2020 to 2024
    • Current and Future Market Size Value (USD Million) Analysis and Forecast By Therapeutic Indication, 2025 to 2035
      • Obstructive Sleep Apnea
      • Narcolepsy
      • Chronic Insomnia
      • Others
    • Y-o-Y Growth Trend Analysis By Therapeutic Indication, 2020 to 2024
    • Absolute $ Opportunity Analysis By Therapeutic Indication, 2025 to 2035
  9. Global Market Analysis 2020 to 2024 and Forecast 2025 to 2035, By End User
    • Introduction / Key Findings
    • Historical Market Size Value (USD Million) Analysis By End User, 2020 to 2024
    • Current and Future Market Size Value (USD Million) Analysis and Forecast By End User, 2025 to 2035
      • Hospitals
      • Specialty Clinics
      • Rehabilitation Centers
      • Homecare Settings
    • Y-o-Y Growth Trend Analysis By End User, 2020 to 2024
    • Absolute $ Opportunity Analysis By End User, 2025 to 2035
  10. Global Market Analysis 2020 to 2024 and Forecast 2025 to 2035, By Region
    • Introduction
    • Historical Market Size Value (USD Million) Analysis By Region, 2020 to 2024
    • Current Market Size Value (USD Million) Analysis and Forecast By Region, 2025 to 2035
      • North America
      • Latin America
      • Western Europe
      • Eastern Europe
      • East Asia
      • South Asia and Pacific
      • Middle East & Africa
    • Market Attractiveness Analysis By Region
  11. North America Market Analysis 2020 to 2024 and Forecast 2025 to 2035, By Country
    • Historical Market Size Value (USD Million) Trend Analysis By Market Taxonomy, 2020 to 2024
    • Market Size Value (USD Million) Forecast By Market Taxonomy, 2025 to 2035
      • By Country
        • USA
        • Canada
        • Mexico
      • By Product
      • By Application
      • By Therapeutic Indication
      • By End User
    • Market Attractiveness Analysis
      • By Country
      • By Product
      • By Application
      • By Therapeutic Indication
      • By End User
    • Key Takeaways
  12. Latin America Market Analysis 2020 to 2024 and Forecast 2025 to 2035, By Country
    • Historical Market Size Value (USD Million) Trend Analysis By Market Taxonomy, 2020 to 2024
    • Market Size Value (USD Million) Forecast By Market Taxonomy, 2025 to 2035
      • By Country
        • Brazil
        • Chile
        • Rest of Latin America
      • By Product
      • By Application
      • By Therapeutic Indication
      • By End User
    • Market Attractiveness Analysis
      • By Country
      • By Product
      • By Application
      • By Therapeutic Indication
      • By End User
    • Key Takeaways
  13. Western Europe Market Analysis 2020 to 2024 and Forecast 2025 to 2035, By Country
    • Historical Market Size Value (USD Million) Trend Analysis By Market Taxonomy, 2020 to 2024
    • Market Size Value (USD Million) Forecast By Market Taxonomy, 2025 to 2035
      • By Country
        • Germany
        • UK
        • Italy
        • Spain
        • France
        • Nordic
        • BENELUX
        • Rest of Western Europe
      • By Product
      • By Application
      • By Therapeutic Indication
      • By End User
    • Market Attractiveness Analysis
      • By Country
      • By Product
      • By Application
      • By Therapeutic Indication
      • By End User
    • Key Takeaways
  14. Eastern Europe Market Analysis 2020 to 2024 and Forecast 2025 to 2035, By Country
    • Historical Market Size Value (USD Million) Trend Analysis By Market Taxonomy, 2020 to 2024
    • Market Size Value (USD Million) Forecast By Market Taxonomy, 2025 to 2035
      • By Country
        • Russia
        • Poland
        • Hungary
        • Balkan & Baltic
        • Rest of Eastern Europe
      • By Product
      • By Application
      • By Therapeutic Indication
      • By End User
    • Market Attractiveness Analysis
      • By Country
      • By Product
      • By Application
      • By Therapeutic Indication
      • By End User
    • Key Takeaways
  15. East Asia Market Analysis 2020 to 2024 and Forecast 2025 to 2035, By Country
    • Historical Market Size Value (USD Million) Trend Analysis By Market Taxonomy, 2020 to 2024
    • Market Size Value (USD Million) Forecast By Market Taxonomy, 2025 to 2035
      • By Country
        • China
        • Japan
        • South Korea
      • By Product
      • By Application
      • By Therapeutic Indication
      • By End User
    • Market Attractiveness Analysis
      • By Country
      • By Product
      • By Application
      • By Therapeutic Indication
      • By End User
    • Key Takeaways
  16. South Asia and Pacific Market Analysis 2020 to 2024 and Forecast 2025 to 2035, By Country
    • Historical Market Size Value (USD Million) Trend Analysis By Market Taxonomy, 2020 to 2024
    • Market Size Value (USD Million) Forecast By Market Taxonomy, 2025 to 2035
      • By Country
        • India
        • ASEAN
        • Australia & New Zealand
        • Rest of South Asia and Pacific
      • By Product
      • By Application
      • By Therapeutic Indication
      • By End User
    • Market Attractiveness Analysis
      • By Country
      • By Product
      • By Application
      • By Therapeutic Indication
      • By End User
    • Key Takeaways
  17. Middle East & Africa Market Analysis 2020 to 2024 and Forecast 2025 to 2035, By Country
    • Historical Market Size Value (USD Million) Trend Analysis By Market Taxonomy, 2020 to 2024
    • Market Size Value (USD Million) Forecast By Market Taxonomy, 2025 to 2035
      • By Country
        • Kingdom of Saudi Arabia
        • Other GCC Countries
        • Turkiye
        • South Africa
        • Other African Union
        • Rest of Middle East & Africa
      • By Product
      • By Application
      • By Therapeutic Indication
      • By End User
    • Market Attractiveness Analysis
      • By Country
      • By Product
      • By Application
      • By Therapeutic Indication
      • By End User
    • Key Takeaways
  18. Key Countries Market Analysis
    • USA
      • Pricing Analysis
      • Market Share Analysis, 2024
        • By Product
        • By Application
        • By Therapeutic Indication
        • By End User
    • Canada
      • Pricing Analysis
      • Market Share Analysis, 2024
        • By Product
        • By Application
        • By Therapeutic Indication
        • By End User
    • Mexico
      • Pricing Analysis
      • Market Share Analysis, 2024
        • By Product
        • By Application
        • By Therapeutic Indication
        • By End User
    • Brazil
      • Pricing Analysis
      • Market Share Analysis, 2024
        • By Product
        • By Application
        • By Therapeutic Indication
        • By End User
    • Chile
      • Pricing Analysis
      • Market Share Analysis, 2024
        • By Product
        • By Application
        • By Therapeutic Indication
        • By End User
    • Germany
      • Pricing Analysis
      • Market Share Analysis, 2024
        • By Product
        • By Application
        • By Therapeutic Indication
        • By End User
    • UK
      • Pricing Analysis
      • Market Share Analysis, 2024
        • By Product
        • By Application
        • By Therapeutic Indication
        • By End User
    • Italy
      • Pricing Analysis
      • Market Share Analysis, 2024
        • By Product
        • By Application
        • By Therapeutic Indication
        • By End User
    • Spain
      • Pricing Analysis
      • Market Share Analysis, 2024
        • By Product
        • By Application
        • By Therapeutic Indication
        • By End User
    • France
      • Pricing Analysis
      • Market Share Analysis, 2024
        • By Product
        • By Application
        • By Therapeutic Indication
        • By End User
    • India
      • Pricing Analysis
      • Market Share Analysis, 2024
        • By Product
        • By Application
        • By Therapeutic Indication
        • By End User
    • ASEAN
      • Pricing Analysis
      • Market Share Analysis, 2024
        • By Product
        • By Application
        • By Therapeutic Indication
        • By End User
    • Australia & New Zealand
      • Pricing Analysis
      • Market Share Analysis, 2024
        • By Product
        • By Application
        • By Therapeutic Indication
        • By End User
    • China
      • Pricing Analysis
      • Market Share Analysis, 2024
        • By Product
        • By Application
        • By Therapeutic Indication
        • By End User
    • Japan
      • Pricing Analysis
      • Market Share Analysis, 2024
        • By Product
        • By Application
        • By Therapeutic Indication
        • By End User
    • South Korea
      • Pricing Analysis
      • Market Share Analysis, 2024
        • By Product
        • By Application
        • By Therapeutic Indication
        • By End User
    • Russia
      • Pricing Analysis
      • Market Share Analysis, 2024
        • By Product
        • By Application
        • By Therapeutic Indication
        • By End User
    • Poland
      • Pricing Analysis
      • Market Share Analysis, 2024
        • By Product
        • By Application
        • By Therapeutic Indication
        • By End User
    • Hungary
      • Pricing Analysis
      • Market Share Analysis, 2024
        • By Product
        • By Application
        • By Therapeutic Indication
        • By End User
    • Kingdom of Saudi Arabia
      • Pricing Analysis
      • Market Share Analysis, 2024
        • By Product
        • By Application
        • By Therapeutic Indication
        • By End User
    • Turkiye
      • Pricing Analysis
      • Market Share Analysis, 2024
        • By Product
        • By Application
        • By Therapeutic Indication
        • By End User
    • South Africa
      • Pricing Analysis
      • Market Share Analysis, 2024
        • By Product
        • By Application
        • By Therapeutic Indication
        • By End User
  19. Market Structure Analysis
    • Competition Dashboard
    • Competition Benchmarking
    • Market Share Analysis of Top Players
      • By Regional
      • By Product
      • By Application
      • By Therapeutic Indication
      • By End User
  20. Competition Analysis
    • Competition Deep Dive
      • Nox Medical
        • Overview
        • Product Portfolio
        • Profitability by Market Segments (Product/Age /Sales Channel/Region)
        • Sales Footprint
        • Strategy Overview
          • Marketing Strategy
          • Product Strategy
          • Channel Strategy
      • Onera Technologies B.V.
      • SOMNOmedics GmbH
      • Recorders & Medicare Systems P Ltd.
      • VentMed Technology Medical Co. Ltd
      • Koninklijke Philips N.V.
      • Allengers Medical Systems Limited
      • Natus Medical Incorporated
  21. Assumptions & Acronyms Used
  22. Research Methodology

List of Tables

  • Table 1: Global Market Value (USD Million) Forecast by Region, 2020-2035
  • Table 2: Global Market Value (USD Million) Forecast by Product , 2020-2035
  • Table 3: Global Market Value (USD Million) Forecast by Application, 2020-2035
  • Table 4: Global Market Value (USD Million) Forecast by Therapeutic Indication, 2020-2035
  • Table 5: Global Market Value (USD Million) Forecast by End User, 2020-2035
  • Table 6: North America Market Value (USD Million) Forecast by Country, 2020-2035
  • Table 7: North America Market Value (USD Million) Forecast by Product , 2020-2035
  • Table 8: North America Market Value (USD Million) Forecast by Application, 2020-2035
  • Table 9: North America Market Value (USD Million) Forecast by Therapeutic Indication, 2020-2035
  • Table 10: North America Market Value (USD Million) Forecast by End User, 2020-2035
  • Table 11: Latin America Market Value (USD Million) Forecast by Country, 2020-2035
  • Table 12: Latin America Market Value (USD Million) Forecast by Product , 2020-2035
  • Table 13: Latin America Market Value (USD Million) Forecast by Application, 2020-2035
  • Table 14: Latin America Market Value (USD Million) Forecast by Therapeutic Indication, 2020-2035
  • Table 15: Latin America Market Value (USD Million) Forecast by End User, 2020-2035
  • Table 16: Western Europe Market Value (USD Million) Forecast by Country, 2020-2035
  • Table 17: Western Europe Market Value (USD Million) Forecast by Product , 2020-2035
  • Table 18: Western Europe Market Value (USD Million) Forecast by Application, 2020-2035
  • Table 19: Western Europe Market Value (USD Million) Forecast by Therapeutic Indication, 2020-2035
  • Table 20: Western Europe Market Value (USD Million) Forecast by End User, 2020-2035
  • Table 21: Eastern Europe Market Value (USD Million) Forecast by Country, 2020-2035
  • Table 22: Eastern Europe Market Value (USD Million) Forecast by Product , 2020-2035
  • Table 23: Eastern Europe Market Value (USD Million) Forecast by Application, 2020-2035
  • Table 24: Eastern Europe Market Value (USD Million) Forecast by Therapeutic Indication, 2020-2035
  • Table 25: Eastern Europe Market Value (USD Million) Forecast by End User, 2020-2035
  • Table 26: East Asia Market Value (USD Million) Forecast by Country, 2020-2035
  • Table 27: East Asia Market Value (USD Million) Forecast by Product , 2020-2035
  • Table 28: East Asia Market Value (USD Million) Forecast by Application, 2020-2035
  • Table 29: East Asia Market Value (USD Million) Forecast by Therapeutic Indication, 2020-2035
  • Table 30: East Asia Market Value (USD Million) Forecast by End User, 2020-2035
  • Table 31: South Asia and Pacific Market Value (USD Million) Forecast by Country, 2020-2035
  • Table 32: South Asia and Pacific Market Value (USD Million) Forecast by Product , 2020-2035
  • Table 33: South Asia and Pacific Market Value (USD Million) Forecast by Application, 2020-2035
  • Table 34: South Asia and Pacific Market Value (USD Million) Forecast by Therapeutic Indication, 2020-2035
  • Table 35: South Asia and Pacific Market Value (USD Million) Forecast by End User, 2020-2035
  • Table 36: Middle East & Africa Market Value (USD Million) Forecast by Country, 2020-2035
  • Table 37: Middle East & Africa Market Value (USD Million) Forecast by Product , 2020-2035
  • Table 38: Middle East & Africa Market Value (USD Million) Forecast by Application, 2020-2035
  • Table 39: Middle East & Africa Market Value (USD Million) Forecast by Therapeutic Indication, 2020-2035
  • Table 40: Middle East & Africa Market Value (USD Million) Forecast by End User, 2020-2035

List of Figures

  • Figure 1: Global Market Pricing Analysis
  • Figure 2: Global Market Value (USD Million) Forecast 2020-2035
  • Figure 3: Global Market Value Share and BPS Analysis by Product , 2025 and 2035
  • Figure 4: Global Market Y-o-Y Growth Comparison by Product , 2025-2035
  • Figure 5: Global Market Attractiveness Analysis by Product
  • Figure 6: Global Market Value Share and BPS Analysis by Application, 2025 and 2035
  • Figure 7: Global Market Y-o-Y Growth Comparison by Application, 2025-2035
  • Figure 8: Global Market Attractiveness Analysis by Application
  • Figure 9: Global Market Value Share and BPS Analysis by Therapeutic Indication, 2025 and 2035
  • Figure 10: Global Market Y-o-Y Growth Comparison by Therapeutic Indication, 2025-2035
  • Figure 11: Global Market Attractiveness Analysis by Therapeutic Indication
  • Figure 12: Global Market Value Share and BPS Analysis by End User, 2025 and 2035
  • Figure 13: Global Market Y-o-Y Growth Comparison by End User, 2025-2035
  • Figure 14: Global Market Attractiveness Analysis by End User
  • Figure 15: Global Market Value (USD Million) Share and BPS Analysis by Region, 2025 and 2035
  • Figure 16: Global Market Y-o-Y Growth Comparison by Region, 2025-2035
  • Figure 17: Global Market Attractiveness Analysis by Region
  • Figure 18: North America Market Incremental Dollar Opportunity, 2025-2035
  • Figure 19: Latin America Market Incremental Dollar Opportunity, 2025-2035
  • Figure 20: Western Europe Market Incremental Dollar Opportunity, 2025-2035
  • Figure 21: Eastern Europe Market Incremental Dollar Opportunity, 2025-2035
  • Figure 22: East Asia Market Incremental Dollar Opportunity, 2025-2035
  • Figure 23: South Asia and Pacific Market Incremental Dollar Opportunity, 2025-2035
  • Figure 24: Middle East & Africa Market Incremental Dollar Opportunity, 2025-2035
  • Figure 25: North America Market Value Share and BPS Analysis by Country, 2025 and 2035
  • Figure 26: North America Market Value Share and BPS Analysis by Product , 2025 and 2035
  • Figure 27: North America Market Y-o-Y Growth Comparison by Product , 2025-2035
  • Figure 28: North America Market Attractiveness Analysis by Product
  • Figure 29: North America Market Value Share and BPS Analysis by Application, 2025 and 2035
  • Figure 30: North America Market Y-o-Y Growth Comparison by Application, 2025-2035
  • Figure 31: North America Market Attractiveness Analysis by Application
  • Figure 32: North America Market Value Share and BPS Analysis by Therapeutic Indication, 2025 and 2035
  • Figure 33: North America Market Y-o-Y Growth Comparison by Therapeutic Indication, 2025-2035
  • Figure 34: North America Market Attractiveness Analysis by Therapeutic Indication
  • Figure 35: North America Market Value Share and BPS Analysis by End User, 2025 and 2035
  • Figure 36: North America Market Y-o-Y Growth Comparison by End User, 2025-2035
  • Figure 37: North America Market Attractiveness Analysis by End User
  • Figure 38: Latin America Market Value Share and BPS Analysis by Country, 2025 and 2035
  • Figure 39: Latin America Market Value Share and BPS Analysis by Product , 2025 and 2035
  • Figure 40: Latin America Market Y-o-Y Growth Comparison by Product , 2025-2035
  • Figure 41: Latin America Market Attractiveness Analysis by Product
  • Figure 42: Latin America Market Value Share and BPS Analysis by Application, 2025 and 2035
  • Figure 43: Latin America Market Y-o-Y Growth Comparison by Application, 2025-2035
  • Figure 44: Latin America Market Attractiveness Analysis by Application
  • Figure 45: Latin America Market Value Share and BPS Analysis by Therapeutic Indication, 2025 and 2035
  • Figure 46: Latin America Market Y-o-Y Growth Comparison by Therapeutic Indication, 2025-2035
  • Figure 47: Latin America Market Attractiveness Analysis by Therapeutic Indication
  • Figure 48: Latin America Market Value Share and BPS Analysis by End User, 2025 and 2035
  • Figure 49: Latin America Market Y-o-Y Growth Comparison by End User, 2025-2035
  • Figure 50: Latin America Market Attractiveness Analysis by End User
  • Figure 51: Western Europe Market Value Share and BPS Analysis by Country, 2025 and 2035
  • Figure 52: Western Europe Market Value Share and BPS Analysis by Product , 2025 and 2035
  • Figure 53: Western Europe Market Y-o-Y Growth Comparison by Product , 2025-2035
  • Figure 54: Western Europe Market Attractiveness Analysis by Product
  • Figure 55: Western Europe Market Value Share and BPS Analysis by Application, 2025 and 2035
  • Figure 56: Western Europe Market Y-o-Y Growth Comparison by Application, 2025-2035
  • Figure 57: Western Europe Market Attractiveness Analysis by Application
  • Figure 58: Western Europe Market Value Share and BPS Analysis by Therapeutic Indication, 2025 and 2035
  • Figure 59: Western Europe Market Y-o-Y Growth Comparison by Therapeutic Indication, 2025-2035
  • Figure 60: Western Europe Market Attractiveness Analysis by Therapeutic Indication
  • Figure 61: Western Europe Market Value Share and BPS Analysis by End User, 2025 and 2035
  • Figure 62: Western Europe Market Y-o-Y Growth Comparison by End User, 2025-2035
  • Figure 63: Western Europe Market Attractiveness Analysis by End User
  • Figure 64: Eastern Europe Market Value Share and BPS Analysis by Country, 2025 and 2035
  • Figure 65: Eastern Europe Market Value Share and BPS Analysis by Product , 2025 and 2035
  • Figure 66: Eastern Europe Market Y-o-Y Growth Comparison by Product , 2025-2035
  • Figure 67: Eastern Europe Market Attractiveness Analysis by Product
  • Figure 68: Eastern Europe Market Value Share and BPS Analysis by Application, 2025 and 2035
  • Figure 69: Eastern Europe Market Y-o-Y Growth Comparison by Application, 2025-2035
  • Figure 70: Eastern Europe Market Attractiveness Analysis by Application
  • Figure 71: Eastern Europe Market Value Share and BPS Analysis by Therapeutic Indication, 2025 and 2035
  • Figure 72: Eastern Europe Market Y-o-Y Growth Comparison by Therapeutic Indication, 2025-2035
  • Figure 73: Eastern Europe Market Attractiveness Analysis by Therapeutic Indication
  • Figure 74: Eastern Europe Market Value Share and BPS Analysis by End User, 2025 and 2035
  • Figure 75: Eastern Europe Market Y-o-Y Growth Comparison by End User, 2025-2035
  • Figure 76: Eastern Europe Market Attractiveness Analysis by End User
  • Figure 77: East Asia Market Value Share and BPS Analysis by Country, 2025 and 2035
  • Figure 78: East Asia Market Value Share and BPS Analysis by Product , 2025 and 2035
  • Figure 79: East Asia Market Y-o-Y Growth Comparison by Product , 2025-2035
  • Figure 80: East Asia Market Attractiveness Analysis by Product
  • Figure 81: East Asia Market Value Share and BPS Analysis by Application, 2025 and 2035
  • Figure 82: East Asia Market Y-o-Y Growth Comparison by Application, 2025-2035
  • Figure 83: East Asia Market Attractiveness Analysis by Application
  • Figure 84: East Asia Market Value Share and BPS Analysis by Therapeutic Indication, 2025 and 2035
  • Figure 85: East Asia Market Y-o-Y Growth Comparison by Therapeutic Indication, 2025-2035
  • Figure 86: East Asia Market Attractiveness Analysis by Therapeutic Indication
  • Figure 87: East Asia Market Value Share and BPS Analysis by End User, 2025 and 2035
  • Figure 88: East Asia Market Y-o-Y Growth Comparison by End User, 2025-2035
  • Figure 89: East Asia Market Attractiveness Analysis by End User
  • Figure 90: South Asia and Pacific Market Value Share and BPS Analysis by Country, 2025 and 2035
  • Figure 91: South Asia and Pacific Market Value Share and BPS Analysis by Product , 2025 and 2035
  • Figure 92: South Asia and Pacific Market Y-o-Y Growth Comparison by Product , 2025-2035
  • Figure 93: South Asia and Pacific Market Attractiveness Analysis by Product
  • Figure 94: South Asia and Pacific Market Value Share and BPS Analysis by Application, 2025 and 2035
  • Figure 95: South Asia and Pacific Market Y-o-Y Growth Comparison by Application, 2025-2035
  • Figure 96: South Asia and Pacific Market Attractiveness Analysis by Application
  • Figure 97: South Asia and Pacific Market Value Share and BPS Analysis by Therapeutic Indication, 2025 and 2035
  • Figure 98: South Asia and Pacific Market Y-o-Y Growth Comparison by Therapeutic Indication, 2025-2035
  • Figure 99: South Asia and Pacific Market Attractiveness Analysis by Therapeutic Indication
  • Figure 100: South Asia and Pacific Market Value Share and BPS Analysis by End User, 2025 and 2035
  • Figure 101: South Asia and Pacific Market Y-o-Y Growth Comparison by End User, 2025-2035
  • Figure 102: South Asia and Pacific Market Attractiveness Analysis by End User
  • Figure 103: Middle East & Africa Market Value Share and BPS Analysis by Country, 2025 and 2035
  • Figure 104: Middle East & Africa Market Value Share and BPS Analysis by Product , 2025 and 2035
  • Figure 105: Middle East & Africa Market Y-o-Y Growth Comparison by Product , 2025-2035
  • Figure 106: Middle East & Africa Market Attractiveness Analysis by Product
  • Figure 107: Middle East & Africa Market Value Share and BPS Analysis by Application, 2025 and 2035
  • Figure 108: Middle East & Africa Market Y-o-Y Growth Comparison by Application, 2025-2035
  • Figure 109: Middle East & Africa Market Attractiveness Analysis by Application
  • Figure 110: Middle East & Africa Market Value Share and BPS Analysis by Therapeutic Indication, 2025 and 2035
  • Figure 111: Middle East & Africa Market Y-o-Y Growth Comparison by Therapeutic Indication, 2025-2035
  • Figure 112: Middle East & Africa Market Attractiveness Analysis by Therapeutic Indication
  • Figure 113: Middle East & Africa Market Value Share and BPS Analysis by End User, 2025 and 2035
  • Figure 114: Middle East & Africa Market Y-o-Y Growth Comparison by End User, 2025-2035
  • Figure 115: Middle East & Africa Market Attractiveness Analysis by End User
  • Figure 116: Global Market - Tier Structure Analysis
  • Figure 117: Global Market - Company Share Analysis
Dashboard
Dashboard
Dashboard
Dashboard
Dashboard
Dashboard

Full Research Suite comprises of:

Market outlook & trends analysis

Market outlook & trends analysis

Interviews & case studies

Interviews & case studies

Strategic recommendations

Strategic recommendations

Vendor profiles & capabilities analysis

Vendor profiles & capabilities analysis

5-year forecasts

5-year forecasts

8 regions and 60+ country-level data splits

8 regions and 60+ country-level data splits

Market segment data splits

Market segment data splits

12 months of continuous data updates

12 months of continuous data updates

DELIVERED AS:

PDF EXCEL ONLINE

Full Research Suite


$5000

$7500

$10000

Buy Report Now
Similar Industry Reports

Similar Industry Reports

Wireless Access Point Market

Wireless Access Point Market Size and Share Forecast Outlook 2025 to 2035

Wireless Video - 2.4/5GHz Market

Wireless Video - 2.4/5GHz Market Size and Share Forecast Outlook 2025 to 2035

Wireless Audio Devices Market

Wireless Audio Devices Market Size and Share Forecast Outlook 2025 to 2035

Wireless Communication Technologies In Healthcare Market

Wireless Communication Technologies In Healthcare Market Size and Share Forecast Outlook 2025 to 2035

Wireless Mesh Network Market

Wireless Mesh Network Market Size and Share Forecast Outlook 2025 to 2035

Wireless Sensor Tags Market

Wireless Sensor Tags Market Size and Share Forecast Outlook 2025 to 2035

Wireless Sensor Network Market

Wireless Sensor Network Market Size and Share Forecast Outlook 2025 to 2035

Wireless Power Transmission Market

Wireless Power Transmission Market Size and Share Forecast Outlook 2025 to 2035

Wireless Home Security Camera Market

Wireless Home Security Camera Market Size and Share Forecast Outlook 2025 to 2035

Wireless Testing Market

Wireless Testing Market Size and Share Forecast Outlook 2025 to 2035

Wireless Power Bank Market

Wireless Power Bank Market Size and Share Forecast Outlook 2025 to 2035

Wireless Battery Monitoring System Market

Wireless Battery Monitoring System Market Size and Share Forecast Outlook 2025 to 2035

Wireless Printer Market

Wireless Printer Market Size and Share Forecast Outlook 2025 to 2035

Wireless Headphones Market

Wireless Headphones Market Size and Share Forecast Outlook 2025 to 2035

Wireless Sensors Market

Wireless Sensors Market Size and Share Forecast Outlook 2025 to 2035

Wireless Display Market

Wireless Display Market Size and Share Forecast Outlook 2025 to 2035

Wireless Paging Systems Market

Wireless Paging Systems Market Size and Share Forecast Outlook 2025 to 2035

Wireless Patient Monitoring Market

Wireless Patient Monitoring Market Size and Share Forecast Outlook 2025 to 2035

Wireless Earphone Market

Wireless Earphone Market Size and Share Forecast Outlook 2025 to 2035

Wireless Ev Charging Market

Wireless Ev Charging Market Size and Share Forecast Outlook 2025 to 2035

Future Market Insights

Wireless Polysomnography Market

Chat With MaRIA

Chat With

MaRIA

Hi There, I am MaRIA, Your Market Research Intelligence Assistant. How may I help you?