Wireless Fire Detection Systems Market Size and Share Forecast Outlook 2025 to 2035

The global wireless fire detection systems market is valued at USD 1.62 billion in 2025 and is expected to reach USD 3.1 billion by 2035, reflecting a CAGR of 7.6%.
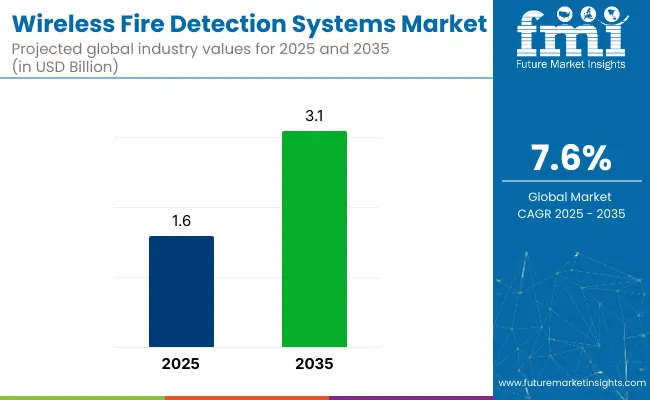
Quick Stats for Wireless Fire Detection Systems Market

  • Market Value (2025): USD 1.6 billion
  • Forecast Value (2035): USD 3.1 billion
  • Forecast CAGR: 7.6%
  • Product Leader in 2025: Sensors/Detectors (28% Market Share)
  • Top Application Segment:Indoor Segment (70% Market Share)
  • Key Growth Region:North America (fastest-growing major market in the USA with 8.2% CAGR)

Wireless Fire Detection Systems Market

Metric Value
Estimated Size (2025) USD 1.6 billion
Projected Value (2035) USD 3.1 billion
CAGR (2025 to 2035) 7.6%

Growth is being driven by stricter fire safety regulations, technological advancements in sensors and IoT integration, and rising adoption in smart building projects worldwide. The market is witnessing expansion in commercial, residential, industrial, and healthcare sectors due to the benefits of wireless systems, such as ease of installation, scalability, and cost efficiency compared to conventional wired systems.

In 2025, the USA is expected to account for the largest market share, expanding at a CAGR of 8.2%, driven by strict regulatory standards and rapid adoption of AI-integrated fire safety solutions. Meanwhile, Germany and the UK closely follow this growth with significant CAGRs of 8.0% and 7.4% respectively. Sensors/detectors are estimated to remain the leading product type with a 28% share in 2025, while wireless systems account for 65% of the market share.

The market holds a niche yet significant share within its parent markets, typically accounting for approximately 2-5% of the overall Fire Safety Systems Market due to its specialized nature. Within the Building Automation Systems Market, the wireless fire detection segment might represent around 3-7%, driven by its integration with smart buildings. In the Internet of Things (IoT) in Smart Homes Market, it could hold a 1-2% share, as fire detection is a key safety component in connected homes. Similarly, it holds a 4-6% share in the broader Sensors and Detection Systems Market.

Looking forward, growth opportunities are expected to emerge from AI and IoT integration in fire detection systems, rising demand for real-time monitoring and predictive maintenance solutions, and strategic partnerships enhancing product portfolios across regions.

Companies are investing in mesh-network technologies, 5G-enabled systems, and sustainable materials to align with evolving environmental standards and smart building integration trends, positioning themselves competitively in a dynamic market landscape. Furthermore, increased government regulations and growing emphasis on fire safety in urban development are likely to accelerate market growth further.

Analyzing Wireless Fire Detection Systems Market by Top Investment Segments

The wireless fire detection systems market is segmented by product type, installation type, system type, application, vertical and region. By product type,it is segmented into sensors/detectors, call points, fire alarm panels and modules, and input/output modules.

By installation type,it includes new installation and retrofit installation.By system type, it is segmented into wireless systems and hybrid systems.By application,it is divided into indoor and outdoor.By vertical,it includes residential, commercial, government and manufacturing.By region,it covers North America, Latin America, Europe, Asia Pacific, and MEA.

By Product Type, Sensors/Detectors Account for 28% of the Market Share

Sensors/detectors are projected to remain the dominant product type, accounting for 28% of market share in 2025. This growth is being driven by their critical role in monitoring environmental parameters for early hazard detection, supporting compliance with stringent fire safety regulations globally.
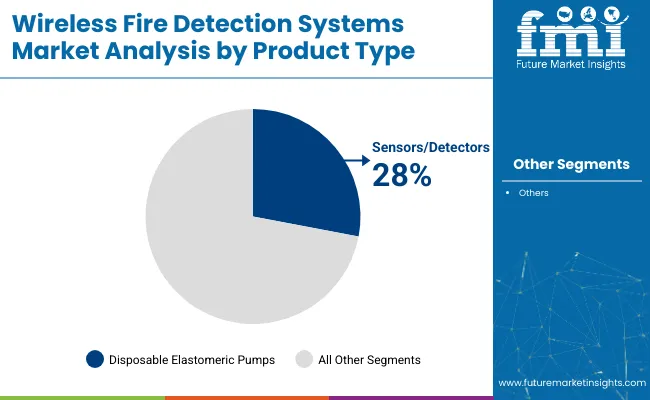
  • Sensors hold a 28% share in 2025
  • IoT integration driving sensor upgrades
  • AI-enabled detectors enhance accuracy
  • Fire alarm panels are growing for smart buildings

Wireless Fire Detection Systems Market Analysis By Product Type

By Installation Type, Retrofit Installations hold a Prominent Share of 56% in 2025

Retrofit installations are estimated to hold a major share, accounting for nearly 56% of the installation segment in 2025. Growth is being propelled by the need to modernize aging infrastructure, especially in North America and Europe, where older buildings require compliant, scalable, and minimally invasive fire detection solutions.
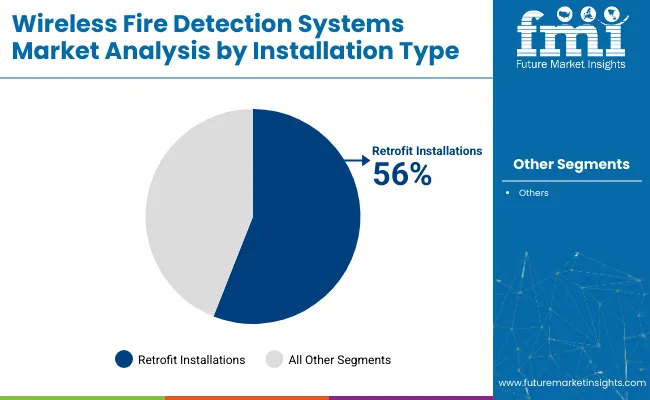
  • Preferred for heritage and old buildings
  • Cost-efficient for upgrading safety systems
  • Enables easy compliance with updated codes

Wireless Fire Detection Systems Market Analysis By Installation Type

By System Type, Wireless Systems Account for 65% of the Market Share

Wireless systems are projected to maintain the largest market share, accounting for approximately 65% of the global wireless fire detection systems market in 2025.
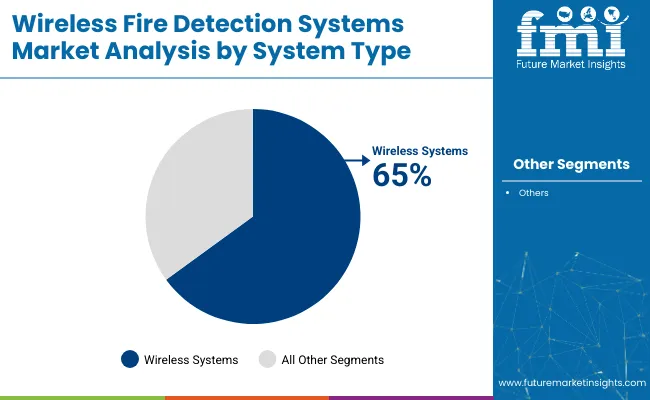
  • Highly preferred in residential and small-to-mid commercial buildings
  • Growing demand from smart homes and connected infrastructure
  • Compliance-ready for evolving fire safety codes

Wireless Fire Detection Systems Market Analysis By System Type

By Application, Indoor Segment Accounts for 70% of the Market Share in 2025

The indoor segment is anticipated to maintain its dominance with a 70% share in 2025, as most fire detection installations are mandated within residential, commercial, and industrial buildings to ensure occupant safety.
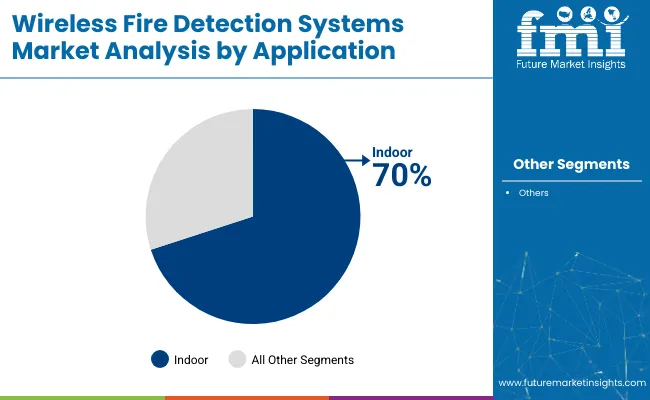
  • Indoor applications hold 70% share
  • Driven by mandatory building codes
  • Integrated with smart management systems
  • Outdoor systems are growing in industrial sites

Wireless Fire Detection Systems Market Analysis By Application

By Vertical, the Commercial Sector Accounts for 34% of the Market Share

The commercial sector is estimated to contribute around 34% of the market share in 2025. Growth is being driven by stringent fire safety regulations in offices, malls, and hospitality buildings, alongside the rising trend of smart commercial facilities integrating AI and IoT-enabled fire detection solutions.
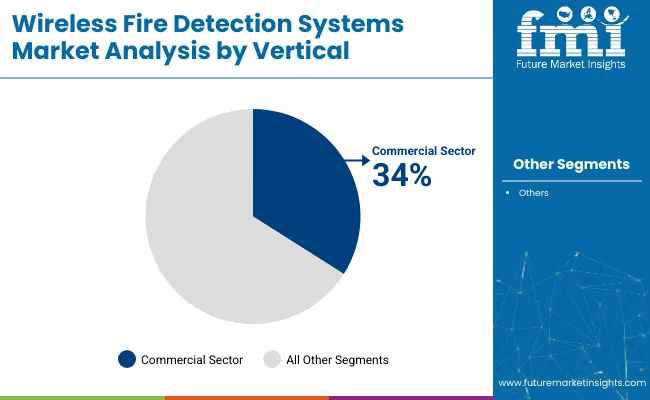
  • Adoption driven by regulatory mandates
  • Smart offices integrating AI-based alarms
  • Residential segment growing with smart homes

Wireless Fire Detection Systems Market Analysis By Vertical

Wireless Fire Detection Systems Market Dynamics

Recent Wireless Fire Detection System Market Trends

  • AI and IoT integration are being increasingly adopted to enable real-time monitoring and predictive fire safety alerts.
  • Hybrid fire detection systems are being preferred for seamless upgrades in mixed infrastructure buildings.
  • Compact, energy-efficient sensors are being developed for space-constrained urban and heritage buildings.
  • Retrofit installations are witnessing higher demand due to mandatory compliance in older structures.

Challenges the Wireless Detection System Market Facing
  • High initial investment costs continue to limit adoption in budget-sensitive regions.
  • Integration challenges with existing building management systems are hindering seamless deployment.
  • Semiconductor shortages and geopolitical tensions are disrupting component supply chains.
  • Regulatory complexity across regions is increasing certification and compliance costs for manufacturers.

Analyzing Top Countries Manufacturing and Supplying Wireless Fire Detection Systems

Country Wise Analysis Of Wireless Fire Detection Systems Market

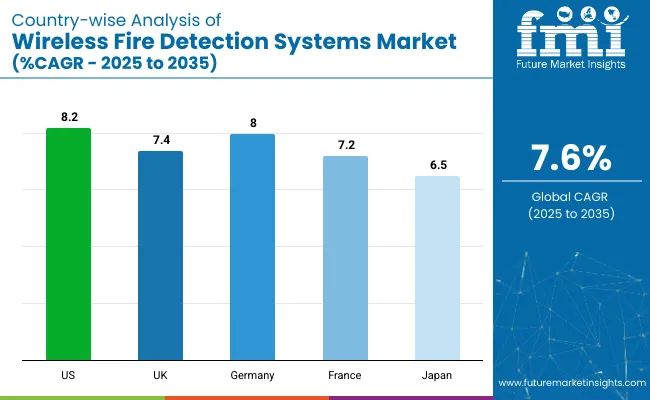
The United States is projected to experience the fastest growth in the wireless fire detection systems market, with a CAGR of 8.2% from 2025 to 2035. This growth is driven by stringent fire safety regulations, AI and IoT integration, and increasing retrofitting projects. Germany follows closely with an 8.0% CAGR, propelled by strong regulations and digitalization in the construction sector.

The United Kingdom is expected to grow at a 7.4% CAGR, fueled by post-Grenfell reforms and smart city developments. France and Japan have slightly lower growth rates of 7.2% and 6.5%, respectively, due to varying adoption speeds and regulatory environments.

The report covers in-depth analysis of 40+ countries; five top-performing OECD countries are highlighted below.

USA Wireless Fire Detection Systems Market Analysis

The USA wireless fire detection systems revenue is projected to register a CAGR of 8.2% from 2025 to 2035. Growth is being driven by stringent fire safety regulations enforced at the federal and state levels alongside the rapid adoption of AI-integrated and IoT-enabled fire detection solutions.

  • Strong regulatory framework mandates advanced safety standards.
  • High adoption of AI-based real-time monitoring systems.
  • Retrofitting projects are boosting the demand for retrofit installations.

Wireless Fire Detection System Demand Analysis in the UK

The revenue from the wireless fire detection systems market in the UK is forecast to expand at a CAGR of during 2025 to 2035.

  • Fire safety reforms are driving demand in high-rise buildings.
  • Rising adoption of IoT-based smart fire detection systems.
  • Retrofit installations are preferred for heritage building compliance.

Germany Wireless Fire Detection Systems SalesAnalysis

The wireless fire detection systems market in Germanyis expected to grow at a CAGR of 8.0% between 2025 and 2035. The market expansion is driven by robust fire safety regulations, rapid digitalization in the construction sector, and the widespread integration of hybrid fire detection systems in public and commercial buildings to enhance safety compliance and operational efficiency.

  • Digitalization initiatives are boosting smart safety solutions.
  • Hybrid systems are preferred for large commercial complexes.
  • Strict regulatory standards ensure high system adoption.

Wireless Fire Detection System Sales Analysis in France

The sales of wireless fire detection systems in France are projected to grow at a CAGR of 7.2% from 2025 to 2035. Market growth is driven by the enforcement of strong fire safety standards, mandatory CE certification, and increasing demand for energy-efficient, IoT-integrated fire safety solutions in smart building and renovation projects aligned with sustainability targets.

  • CE certification drives compliance-focused product development.
  • Smart building projects fuel wireless systems adoption.
  • Sustainability goals are increasing demand for energy-efficient systems.

Wireless Fire Detection Systems Market Analysis in Japan

The wireless fire detection systems demandin Japan is anticipated to expand at a CAGR of 6.5% through 2035. Despite being a mature market, growth is steady due to urbanization, the need for compact designs in high-density cities, and the gradual adoption of IoT and AI technologies for enhanced predictive monitoring in commercial and residential sectors.

  • Conservative adoption trends are slowly shifting toward IoT solutions.
  • Demand rising for compact, space-efficient wireless systems.
  • Regulatory standards favor wired systems, but wireless is gaining traction.

Leading Wireless Fire Detection System Suppliers

The market is moderately consolidated, with major players such as Honeywell International Inc., Siemens AG, Johnson Controls, Hochiki Corporation, and Schneider Electric accounting for substantial market shares.

Competition is driven by pricing strategies, continuous innovation in AI and IoT integration, strategic mergers & acquisitions, and expansion into emerging smart city infrastructures. Companies are strengthening their portfolios with advanced wireless solutions featuring predictive maintenance, AI-driven analytics, and seamless integration with building management systems.

Recent Wireless Fire Detection Systems Industry News

In December 2024, Siemens acquired Danfoss Fire Safety to boost its sustainable fire suppression portfolio.

Wireless Fire Detection Systems Market Report Scope

Report Attributes Details
Current Total Market Size (2025) USD 1.6 billion
Projected Market Size (2035) USD 3.1 billion
CAGR (2025 to 2035) 7.6%
Base Year for Estimation 2024
Historical Period 2020 to 2024
Projections Period 2025 to 2035
Market Analysis Parameters Revenue in USD billions/Volume in units
By Product Type Sensors, Detectors, Call Points, Fire Alarm Panels, Modules
By Installation Type New Installation, Retrofit Installation
By System Type Wireless, Hybrid
By Application Indoor, Outdoor
By Vertical Residential, Commercial, Government, Industrial
Regions Covered North America, Latin America, Europe, East Asia, South Asia & Pacific, MEA
Countries Covered United States, Canada, Germany, United Kingdom, France, China, Japan, South Korea, India, Australia
Key Players Honeywell International Inc., Siemens AG, Johnson Controls, Hochiki Corporation, Schneider Electric, Bosch Security Systems, UTC, Nest Labs, Kidde, Apollo Fire Detectors Ltd., Testo AG, Vanderbilt Industries, EMS Safety Services
Additional Attributes Dollar sales by value, market share analysis by region, and country-wise analysis

Key Segmentation

By Product Type:

Sensors/Detectors, Call Points, Fire Alarm Panels and Modules, and Input/ Output Modules

By Installation Type:

New Installation and Retrofit Installation

By System Type:

Wireless Systems and Hybrid Systems

By Application:

Indoor and Outdoor

By Vertical:

Residential, Commercial, Government, and Manufacturing

By Region:

North America, Latin America, Europe, Asia Pacific, and Middle East and Africa

Table of Content

  1. Executive Summary
    • Global Market Outlook
    • Demand-side Trends
    • Supply-side Trends
    • Technology Roadmap Analysis
    • Analysis and Recommendations
  2. Market Overview
    • Market Coverage / Taxonomy
    • Market Definition / Scope / Limitations
  3. Market Background
    • Market Dynamics
      • Drivers
      • Restraints
      • Opportunity
      • Trends
    • Scenario Forecast
      • Demand in Optimistic Scenario
      • Demand in Likely Scenario
      • Demand in Conservative Scenario
    • Opportunity Map Analysis
    • Product Life Cycle Analysis
    • Supply Chain Analysis
      • Supply Side Participants and their Roles
        • Producers
        • Mid-Level Participants (Traders/ Agents/ Brokers)
        • Wholesalers and Distributors
      • Value Added and Value Created at Node in the Supply Chain
      • List of Raw Material Suppliers
      • List of Existing and Potential Buyer’s
    • Investment Feasibility Matrix
    • Value Chain Analysis
      • Profit Margin Analysis
      • Wholesalers and Distributors
      • Retailers
    • PESTLE and Porter’s Analysis
    • Regulatory Landscape
      • By Key Regions
      • By Key Countries
    • Regional Parent Market Outlook
    • Production and Consumption Statistics
    • Import and Export Statistics
  4. Global Market Analysis 2020 to 2024 and Forecast, 2025 to 2035
    • Historical Market Size Value (USD Billion) & Volume (Units) Analysis, 2020 to 2024
    • Current and Future Market Size Value (USD Billion) & Volume (Units) Projections, 2025 to 2035
      • Y-o-Y Growth Trend Analysis
      • Absolute $ Opportunity Analysis
  5. Global Market Pricing Analysis 2020 to 2024 and Forecast 2025 to 2035
  6. Global Market Analysis 2020 to 2024 and Forecast 2025 to 2035, By Product Type
    • Introduction / Key Findings
    • Historical Market Size Value (USD Billion) & Volume (Units) Analysis By Product Type, 2020 to 2024
    • Current and Future Market Size Value (USD Billion) & Volume (Units) Analysis and Forecast By Product Type, 2025 to 2035
      • Sensors/Detectors
      • Call Points
      • Fire Alarm Panels and Modules
      • Input/Output Modules
    • Y-o-Y Growth Trend Analysis By Product Type, 2020 to 2024
    • Absolute $ Opportunity Analysis By Product Type, 2025 to 2035
  7. Global Market Analysis 2020 to 2024 and Forecast 2025 to 2035, By Installation Type
    • Introduction / Key Findings
    • Historical Market Size Value (USD Billion) & Volume (Units) Analysis By Installation Type, 2020 to 2024
    • Current and Future Market Size Value (USD Billion) & Volume (Units) Analysis and Forecast By Installation Type, 2025 to 2035
      • New Installation
      • Retrofit Installation
    • Y-o-Y Growth Trend Analysis By Installation Type, 2020 to 2024
    • Absolute $ Opportunity Analysis By Installation Type, 2025 to 2035
  8. Global Market Analysis 2020 to 2024 and Forecast 2025 to 2035, By System Type
    • Introduction / Key Findings
    • Historical Market Size Value (USD Billion) & Volume (Units) Analysis By System Type, 2020 to 2024
    • Current and Future Market Size Value (USD Billion) & Volume (Units) Analysis and Forecast By System Type, 2025 to 2035
      • Wireless Systems
      • Hybrid Systems
    • Y-o-Y Growth Trend Analysis By System Type, 2020 to 2024
    • Absolute $ Opportunity Analysis By System Type, 2025 to 2035
  9. Global Market Analysis 2020 to 2024 and Forecast 2025 to 2035, By Application
    • Introduction / Key Findings
    • Historical Market Size Value (USD Billion) & Volume (Units) Analysis By Application, 2020 to 2024
    • Current and Future Market Size Value (USD Billion) & Volume (Units) Analysis and Forecast By Application, 2025 to 2035
      • Indoor
      • Outdoor
    • Y-o-Y Growth Trend Analysis By Application, 2020 to 2024
    • Absolute $ Opportunity Analysis By Application, 2025 to 2035
  10. Global Market Analysis 2020 to 2024 and Forecast 2025 to 2035, By Vertical
    • Introduction / Key Findings
    • Historical Market Size Value (USD Billion) & Volume (Units) Analysis By Vertical, 2020 to 2024
    • Current and Future Market Size Value (USD Billion) & Volume (Units) Analysis and Forecast By Vertical, 2025 to 2035
      • Residential
      • Commercial
      • Government
      • Manufacturing
    • Y-o-Y Growth Trend Analysis By Vertical, 2020 to 2024
    • Absolute $ Opportunity Analysis By Vertical, 2025 to 2035
  11. Global Market Analysis 2020 to 2024 and Forecast 2025 to 2035, By Region
    • Introduction
    • Historical Market Size Value (USD Billion) & Volume (Units) Analysis By Region, 2020 to 2024
    • Current Market Size Value (USD Billion) & Volume (Units) Analysis and Forecast By Region, 2025 to 2035
      • North America
      • Latin America
      • Western Europe
      • Eastern Europe
      • East Asia
      • South Asia & Pacific
      • Middle East and Africa
    • Market Attractiveness Analysis By Region
  12. North America Market Analysis 2020 to 2024 and Forecast 2025 to 2035, By Country
    • Historical Market Size Value (USD Billion) & Volume (Units) Trend Analysis By Market Taxonomy, 2020 to 2024
    • Market Size Value (USD Billion) & Volume (Units) Forecast By Market Taxonomy, 2025 to 2035
      • By Country
        • USA
        • Canada
        • Mexico
      • By Product Type
      • By Installation Type
      • By System Type
      • By Application
      • By Vertical
    • Market Attractiveness Analysis
      • By Country
      • By Product Type
      • By Installation Type
      • By System Type
      • By Application
      • By Vertical
    • Key Takeaways
  13. Latin America Market Analysis 2020 to 2024 and Forecast 2025 to 2035, By Country
    • Historical Market Size Value (USD Billion) & Volume (Units) Trend Analysis By Market Taxonomy, 2020 to 2024
    • Market Size Value (USD Billion) & Volume (Units) Forecast By Market Taxonomy, 2025 to 2035
      • By Country
        • Brazil
        • Argentina
        • Rest of LATAM
      • By Product Type
      • By Installation Type
      • By System Type
      • By Application
      • By Vertical
    • Market Attractiveness Analysis
      • By Country
      • By Product Type
      • By Installation Type
      • By System Type
      • By Application
      • By Vertical
    • Key Takeaways
  14. Western Europe Market Analysis 2020 to 2024 and Forecast 2025 to 2035, By Country
    • Historical Market Size Value (USD Billion) & Volume (Units) Trend Analysis By Market Taxonomy, 2020 to 2024
    • Market Size Value (USD Billion) & Volume (Units) Forecast By Market Taxonomy, 2025 to 2035
      • By Country
        • Germany
        • Italy
        • France
        • UK
        • Spain
        • BENELUX
        • Nordic
        • Rest of W.Europe
      • By Product Type
      • By Installation Type
      • By System Type
      • By Application
      • By Vertical
    • Market Attractiveness Analysis
      • By Country
      • By Product Type
      • By Installation Type
      • By System Type
      • By Application
      • By Vertical
    • Key Takeaways
  15. Eastern Europe Market Analysis 2020 to 2024 and Forecast 2025 to 2035, By Country
    • Historical Market Size Value (USD Billion) & Volume (Units) Trend Analysis By Market Taxonomy, 2020 to 2024
    • Market Size Value (USD Billion) & Volume (Units) Forecast By Market Taxonomy, 2025 to 2035
      • By Country
        • Russia
        • Hungary
        • Poland
        • Balkan & Baltics
        • Rest of E. Europe
      • By Product Type
      • By Installation Type
      • By System Type
      • By Application
      • By Vertical
    • Market Attractiveness Analysis
      • By Country
      • By Product Type
      • By Installation Type
      • By System Type
      • By Application
      • By Vertical
    • Key Takeaways
  16. East Asia Market Analysis 2020 to 2024 and Forecast 2025 to 2035, By Country
    • Historical Market Size Value (USD Billion) & Volume (Units) Trend Analysis By Market Taxonomy, 2020 to 2024
    • Market Size Value (USD Billion) & Volume (Units) Forecast By Market Taxonomy, 2025 to 2035
      • By Country
        • China
        • Japan
        • South Korea
      • By Product Type
      • By Installation Type
      • By System Type
      • By Application
      • By Vertical
    • Market Attractiveness Analysis
      • By Country
      • By Product Type
      • By Installation Type
      • By System Type
      • By Application
      • By Vertical
    • Key Takeaways
  17. South Asia & Pacific Market Analysis 2020 to 2024 and Forecast 2025 to 2035, By Country
    • Historical Market Size Value (USD Billion) & Volume (Units) Trend Analysis By Market Taxonomy, 2020 to 2024
    • Market Size Value (USD Billion) & Volume (Units) Forecast By Market Taxonomy, 2025 to 2035
      • By Country
        • India
        • Australia & New Zealand
        • ASEAN
        • Rest of SAP
      • By Product Type
      • By Installation Type
      • By System Type
      • By Application
      • By Vertical
    • Market Attractiveness Analysis
      • By Country
      • By Product Type
      • By Installation Type
      • By System Type
      • By Application
      • By Vertical
    • Key Takeaways
  18. Middle East and Africa Market Analysis 2020 to 2024 and Forecast 2025 to 2035, By Country
    • Historical Market Size Value (USD Billion) & Volume (Units) Trend Analysis By Market Taxonomy, 2020 to 2024
    • Market Size Value (USD Billion) & Volume (Units) Forecast By Market Taxonomy, 2025 to 2035
      • By Country
        • GCC Countries
        • Northern Africa
        • South Africa
        • Turkiye
        • Rest of MEA
      • By Product Type
      • By Installation Type
      • By System Type
      • By Application
      • By Vertical
    • Market Attractiveness Analysis
      • By Country
      • By Product Type
      • By Installation Type
      • By System Type
      • By Application
      • By Vertical
    • Key Takeaways
  19. Key Countries Market Analysis
    • USA
      • Pricing Analysis
      • Market Share Analysis, 2024
        • By Product Type
        • By Installation Type
        • By System Type
        • By Application
        • By Vertical
    • Canada
      • Pricing Analysis
      • Market Share Analysis, 2024
        • By Product Type
        • By Installation Type
        • By System Type
        • By Application
        • By Vertical
    • Brazil
      • Pricing Analysis
      • Market Share Analysis, 2024
        • By Product Type
        • By Installation Type
        • By System Type
        • By Application
        • By Vertical
    • Mexico
      • Pricing Analysis
      • Market Share Analysis, 2024
        • By Product Type
        • By Installation Type
        • By System Type
        • By Application
        • By Vertical
    • Argentina
      • Pricing Analysis
      • Market Share Analysis, 2024
        • By Product Type
        • By Installation Type
        • By System Type
        • By Application
        • By Vertical
  20. Market Structure Analysis
    • Competition Dashboard
    • Competition Benchmarking
    • Market Share Analysis of Top Players
      • By Regional
      • By Product Type
      • By Installation Type
      • By System Type
      • By Application
      • By Vertical
  21. Competition Analysis
    • Competition Deep Dive
      • Electro Detectors Ltd.
        • Overview
        • Product Portfolio
        • Profitability by Market Segments (Product/Age /Sales Channel/Region)
        • Sales Footprint
        • Strategy Overview
          • Marketing Strategy
          • Product Strategy
          • Channel Strategy
      • Zeta Alarms Ltd.
        • Overview
        • Product Portfolio
        • Profitability by Market Segments (Product/Age /Sales Channel/Region)
        • Sales Footprint
        • Strategy Overview
          • Marketing Strategy
          • Product Strategy
          • Channel Strategy
      • Ceasefire Industries Pvt. Ltd.
        • Overview
        • Product Portfolio
        • Profitability by Market Segments (Product/Age /Sales Channel/Region)
        • Sales Footprint
        • Strategy Overview
          • Marketing Strategy
          • Product Strategy
          • Channel Strategy
      • Sterling Safety System
        • Overview
        • Product Portfolio
        • Profitability by Market Segments (Product/Age /Sales Channel/Region)
        • Sales Footprint
        • Strategy Overview
          • Marketing Strategy
          • Product Strategy
          • Channel Strategy
      • Siemens AG
        • Overview
        • Product Portfolio
        • Profitability by Market Segments (Product/Age /Sales Channel/Region)
        • Sales Footprint
        • Strategy Overview
          • Marketing Strategy
          • Product Strategy
          • Channel Strategy
      • Johnson Controls
        • Overview
        • Product Portfolio
        • Profitability by Market Segments (Product/Age /Sales Channel/Region)
        • Sales Footprint
        • Strategy Overview
          • Marketing Strategy
          • Product Strategy
          • Channel Strategy
      • HOCHIKI Corporation
        • Overview
        • Product Portfolio
        • Profitability by Market Segments (Product/Age /Sales Channel/Region)
        • Sales Footprint
        • Strategy Overview
          • Marketing Strategy
          • Product Strategy
          • Channel Strategy
      • Napco Security Technologies, Inc.
        • Overview
        • Product Portfolio
        • Profitability by Market Segments (Product/Age /Sales Channel/Region)
        • Sales Footprint
        • Strategy Overview
          • Marketing Strategy
          • Product Strategy
          • Channel Strategy
      • Argus Security S.r.l.
        • Overview
        • Product Portfolio
        • Profitability by Market Segments (Product/Age /Sales Channel/Region)
        • Sales Footprint
        • Strategy Overview
          • Marketing Strategy
          • Product Strategy
          • Channel Strategy
      • Honeywell International Inc.
        • Overview
        • Product Portfolio
        • Profitability by Market Segments (Product/Age /Sales Channel/Region)
        • Sales Footprint
        • Strategy Overview
          • Marketing Strategy
          • Product Strategy
          • Channel Strategy
      • Tyco International PLC
        • Overview
        • Product Portfolio
        • Profitability by Market Segments (Product/Age /Sales Channel/Region)
        • Sales Footprint
        • Strategy Overview
          • Marketing Strategy
          • Product Strategy
          • Channel Strategy
      • Halma Plc
        • Overview
        • Product Portfolio
        • Profitability by Market Segments (Product/Age /Sales Channel/Region)
        • Sales Footprint
        • Strategy Overview
          • Marketing Strategy
          • Product Strategy
          • Channel Strategy
      • EMS Security Group Ltd
        • Overview
        • Product Portfolio
        • Profitability by Market Segments (Product/Age /Sales Channel/Region)
        • Sales Footprint
        • Strategy Overview
          • Marketing Strategy
          • Product Strategy
          • Channel Strategy
      • Robert Bosch GmbH
        • Overview
        • Product Portfolio
        • Profitability by Market Segments (Product/Age /Sales Channel/Region)
        • Sales Footprint
        • Strategy Overview
          • Marketing Strategy
          • Product Strategy
          • Channel Strategy
      • EuroFyre Ltd
        • Overview
        • Product Portfolio
        • Profitability by Market Segments (Product/Age /Sales Channel/Region)
        • Sales Footprint
        • Strategy Overview
          • Marketing Strategy
          • Product Strategy
          • Channel Strategy
      • Detectomat GmbH
        • Overview
        • Product Portfolio
        • Profitability by Market Segments (Product/Age /Sales Channel/Region)
        • Sales Footprint
        • Strategy Overview
          • Marketing Strategy
          • Product Strategy
          • Channel Strategy
      • Apollo Fire Detectors Limited
        • Overview
        • Product Portfolio
        • Profitability by Market Segments (Product/Age /Sales Channel/Region)
        • Sales Footprint
        • Strategy Overview
          • Marketing Strategy
          • Product Strategy
          • Channel Strategy
  22. Assumptions & Acronyms Used
  23. Research Methodology

List of Tables

  • Table 1: Global Market Value (USD Billion) Forecast by Region, 2020 to 2035
  • Table 2: Global Market Volume (Units) Forecast by Region, 2020 to 2035
  • Table 3: Global Market Value (USD Billion) Forecast by Product Type, 2020 to 2035
  • Table 4: Global Market Volume (Units) Forecast by Product Type, 2020 to 2035
  • Table 5: Global Market Value (USD Billion) Forecast by Installation Type, 2020 to 2035
  • Table 6: Global Market Volume (Units) Forecast by Installation Type, 2020 to 2035
  • Table 7: Global Market Value (USD Billion) Forecast by System Type, 2020 to 2035
  • Table 8: Global Market Volume (Units) Forecast by System Type, 2020 to 2035
  • Table 9: Global Market Value (USD Billion) Forecast by Application, 2020 to 2035
  • Table 10: Global Market Volume (Units) Forecast by Application, 2020 to 2035
  • Table 11: Global Market Value (USD Billion) Forecast by Vertical, 2020 to 2035
  • Table 12: Global Market Volume (Units) Forecast by Vertical, 2020 to 2035
  • Table 13: North America Market Value (USD Billion) Forecast by Country, 2020 to 2035
  • Table 14: North America Market Volume (Units) Forecast by Country, 2020 to 2035
  • Table 15: North America Market Value (USD Billion) Forecast by Product Type, 2020 to 2035
  • Table 16: North America Market Volume (Units) Forecast by Product Type, 2020 to 2035
  • Table 17: North America Market Value (USD Billion) Forecast by Installation Type, 2020 to 2035
  • Table 18: North America Market Volume (Units) Forecast by Installation Type, 2020 to 2035
  • Table 19: North America Market Value (USD Billion) Forecast by System Type, 2020 to 2035
  • Table 20: North America Market Volume (Units) Forecast by System Type, 2020 to 2035
  • Table 21: North America Market Value (USD Billion) Forecast by Application, 2020 to 2035
  • Table 22: North America Market Volume (Units) Forecast by Application, 2020 to 2035
  • Table 23: North America Market Value (USD Billion) Forecast by Vertical, 2020 to 2035
  • Table 24: North America Market Volume (Units) Forecast by Vertical, 2020 to 2035
  • Table 25: Latin America Market Value (USD Billion) Forecast by Country, 2020 to 2035
  • Table 26: Latin America Market Volume (Units) Forecast by Country, 2020 to 2035
  • Table 27: Latin America Market Value (USD Billion) Forecast by Product Type, 2020 to 2035
  • Table 28: Latin America Market Volume (Units) Forecast by Product Type, 2020 to 2035
  • Table 29: Latin America Market Value (USD Billion) Forecast by Installation Type, 2020 to 2035
  • Table 30: Latin America Market Volume (Units) Forecast by Installation Type, 2020 to 2035
  • Table 31: Latin America Market Value (USD Billion) Forecast by System Type, 2020 to 2035
  • Table 32: Latin America Market Volume (Units) Forecast by System Type, 2020 to 2035
  • Table 33: Latin America Market Value (USD Billion) Forecast by Application, 2020 to 2035
  • Table 34: Latin America Market Volume (Units) Forecast by Application, 2020 to 2035
  • Table 35: Latin America Market Value (USD Billion) Forecast by Vertical, 2020 to 2035
  • Table 36: Latin America Market Volume (Units) Forecast by Vertical, 2020 to 2035
  • Table 37: Western Europe Market Value (USD Billion) Forecast by Country, 2020 to 2035
  • Table 38: Western Europe Market Volume (Units) Forecast by Country, 2020 to 2035
  • Table 39: Western Europe Market Value (USD Billion) Forecast by Product Type, 2020 to 2035
  • Table 40: Western Europe Market Volume (Units) Forecast by Product Type, 2020 to 2035
  • Table 41: Western Europe Market Value (USD Billion) Forecast by Installation Type, 2020 to 2035
  • Table 42: Western Europe Market Volume (Units) Forecast by Installation Type, 2020 to 2035
  • Table 43: Western Europe Market Value (USD Billion) Forecast by System Type, 2020 to 2035
  • Table 44: Western Europe Market Volume (Units) Forecast by System Type, 2020 to 2035
  • Table 45: Western Europe Market Value (USD Billion) Forecast by Application, 2020 to 2035
  • Table 46: Western Europe Market Volume (Units) Forecast by Application, 2020 to 2035
  • Table 47: Western Europe Market Value (USD Billion) Forecast by Vertical, 2020 to 2035
  • Table 48: Western Europe Market Volume (Units) Forecast by Vertical, 2020 to 2035
  • Table 49: Eastern Europe Market Value (USD Billion) Forecast by Country, 2020 to 2035
  • Table 50: Eastern Europe Market Volume (Units) Forecast by Country, 2020 to 2035
  • Table 51: Eastern Europe Market Value (USD Billion) Forecast by Product Type, 2020 to 2035
  • Table 52: Eastern Europe Market Volume (Units) Forecast by Product Type, 2020 to 2035
  • Table 53: Eastern Europe Market Value (USD Billion) Forecast by Installation Type, 2020 to 2035
  • Table 54: Eastern Europe Market Volume (Units) Forecast by Installation Type, 2020 to 2035
  • Table 55: Eastern Europe Market Value (USD Billion) Forecast by System Type, 2020 to 2035
  • Table 56: Eastern Europe Market Volume (Units) Forecast by System Type, 2020 to 2035
  • Table 57: Eastern Europe Market Value (USD Billion) Forecast by Application, 2020 to 2035
  • Table 58: Eastern Europe Market Volume (Units) Forecast by Application, 2020 to 2035
  • Table 59: Eastern Europe Market Value (USD Billion) Forecast by Vertical, 2020 to 2035
  • Table 60: Eastern Europe Market Volume (Units) Forecast by Vertical, 2020 to 2035
  • Table 61: East Asia Market Value (USD Billion) Forecast by Country, 2020 to 2035
  • Table 62: East Asia Market Volume (Units) Forecast by Country, 2020 to 2035
  • Table 63: East Asia Market Value (USD Billion) Forecast by Product Type, 2020 to 2035
  • Table 64: East Asia Market Volume (Units) Forecast by Product Type, 2020 to 2035
  • Table 65: East Asia Market Value (USD Billion) Forecast by Installation Type, 2020 to 2035
  • Table 66: East Asia Market Volume (Units) Forecast by Installation Type, 2020 to 2035
  • Table 67: East Asia Market Value (USD Billion) Forecast by System Type, 2020 to 2035
  • Table 68: East Asia Market Volume (Units) Forecast by System Type, 2020 to 2035
  • Table 69: East Asia Market Value (USD Billion) Forecast by Application, 2020 to 2035
  • Table 70: East Asia Market Volume (Units) Forecast by Application, 2020 to 2035
  • Table 71: East Asia Market Value (USD Billion) Forecast by Vertical, 2020 to 2035
  • Table 72: East Asia Market Volume (Units) Forecast by Vertical, 2020 to 2035
  • Table 73: South Asia & Pacific Market Value (USD Billion) Forecast by Country, 2020 to 2035
  • Table 74: South Asia & Pacific Market Volume (Units) Forecast by Country, 2020 to 2035
  • Table 75: South Asia & Pacific Market Value (USD Billion) Forecast by Product Type, 2020 to 2035
  • Table 76: South Asia & Pacific Market Volume (Units) Forecast by Product Type, 2020 to 2035
  • Table 77: South Asia & Pacific Market Value (USD Billion) Forecast by Installation Type, 2020 to 2035
  • Table 78: South Asia & Pacific Market Volume (Units) Forecast by Installation Type, 2020 to 2035
  • Table 79: South Asia & Pacific Market Value (USD Billion) Forecast by System Type, 2020 to 2035
  • Table 80: South Asia & Pacific Market Volume (Units) Forecast by System Type, 2020 to 2035
  • Table 81: South Asia & Pacific Market Value (USD Billion) Forecast by Application, 2020 to 2035
  • Table 82: South Asia & Pacific Market Volume (Units) Forecast by Application, 2020 to 2035
  • Table 83: South Asia & Pacific Market Value (USD Billion) Forecast by Vertical, 2020 to 2035
  • Table 84: South Asia & Pacific Market Volume (Units) Forecast by Vertical, 2020 to 2035
  • Table 85: Middle East and Africa Market Value (USD Billion) Forecast by Country, 2020 to 2035
  • Table 86: Middle East and Africa Market Volume (Units) Forecast by Country, 2020 to 2035
  • Table 87: Middle East and Africa Market Value (USD Billion) Forecast by Product Type, 2020 to 2035
  • Table 88: Middle East and Africa Market Volume (Units) Forecast by Product Type, 2020 to 2035
  • Table 89: Middle East and Africa Market Value (USD Billion) Forecast by Installation Type, 2020 to 2035
  • Table 90: Middle East and Africa Market Volume (Units) Forecast by Installation Type, 2020 to 2035
  • Table 91: Middle East and Africa Market Value (USD Billion) Forecast by System Type, 2020 to 2035
  • Table 92: Middle East and Africa Market Volume (Units) Forecast by System Type, 2020 to 2035
  • Table 93: Middle East and Africa Market Value (USD Billion) Forecast by Application, 2020 to 2035
  • Table 94: Middle East and Africa Market Volume (Units) Forecast by Application, 2020 to 2035
  • Table 95: Middle East and Africa Market Value (USD Billion) Forecast by Vertical, 2020 to 2035
  • Table 96: Middle East and Africa Market Volume (Units) Forecast by Vertical, 2020 to 2035

List of Figures

  • Figure 1: Global Market Volume (Units) Forecast 2020 to 2035
  • Figure 2: Global Market Pricing Analysis
  • Figure 3: Global Market Value (USD Billion) Forecast 2020 to 2035
  • Figure 4: Global Market Value Share and BPS Analysis by Product Type, 2025 and 2035
  • Figure 5: Global Market Y-o-Y Growth Comparison by Product Type, 2025 to 2035
  • Figure 6: Global Market Attractiveness Analysis by Product Type
  • Figure 7: Global Market Value Share and BPS Analysis by Installation Type, 2025 and 2035
  • Figure 8: Global Market Y-o-Y Growth Comparison by Installation Type, 2025 to 2035
  • Figure 9: Global Market Attractiveness Analysis by Installation Type
  • Figure 10: Global Market Value Share and BPS Analysis by System Type, 2025 and 2035
  • Figure 11: Global Market Y-o-Y Growth Comparison by System Type, 2025 to 2035
  • Figure 12: Global Market Attractiveness Analysis by System Type
  • Figure 13: Global Market Value Share and BPS Analysis by Application, 2025 and 2035
  • Figure 14: Global Market Y-o-Y Growth Comparison by Application, 2025 to 2035
  • Figure 15: Global Market Attractiveness Analysis by Application
  • Figure 16: Global Market Value Share and BPS Analysis by Vertical, 2025 and 2035
  • Figure 17: Global Market Y-o-Y Growth Comparison by Vertical, 2025 to 2035
  • Figure 18: Global Market Attractiveness Analysis by Vertical
  • Figure 19: Global Market Value (USD Billion) Share and BPS Analysis by Region, 2025 and 2035
  • Figure 20: Global Market Y-o-Y Growth Comparison by Region, 2025 to 2035
  • Figure 21: Global Market Attractiveness Analysis by Region
  • Figure 22: North America Market Incremental $ Opportunity, 2025 to 2035
  • Figure 23: Latin America Market Incremental $ Opportunity, 2025 to 2035
  • Figure 24: Western Europe Market Incremental $ Opportunity, 2025 to 2035
  • Figure 25: Eastern Europe Market Incremental $ Opportunity, 2025 to 2035
  • Figure 26: East Asia Market Incremental $ Opportunity, 2025 to 2035
  • Figure 27: South Asia & Pacific Market Incremental $ Opportunity, 2025 to 2035
  • Figure 28: Middle East and Africa Market Incremental $ Opportunity, 2025 to 2035
  • Figure 29: North America Market Value Share and BPS Analysis by Country, 2025 and 2035
  • Figure 30: North America Market Value Share and BPS Analysis by Product Type, 2025 and 2035
  • Figure 31: North America Market Y-o-Y Growth Comparison by Product Type, 2025 to 2035
  • Figure 32: North America Market Attractiveness Analysis by Product Type
  • Figure 33: North America Market Value Share and BPS Analysis by Installation Type, 2025 and 2035
  • Figure 34: North America Market Y-o-Y Growth Comparison by Installation Type, 2025 to 2035
  • Figure 35: North America Market Attractiveness Analysis by Installation Type
  • Figure 36: North America Market Value Share and BPS Analysis by System Type, 2025 and 2035
  • Figure 37: North America Market Y-o-Y Growth Comparison by System Type, 2025 to 2035
  • Figure 38: North America Market Attractiveness Analysis by System Type
  • Figure 39: North America Market Value Share and BPS Analysis by Application, 2025 and 2035
  • Figure 40: North America Market Y-o-Y Growth Comparison by Application, 2025 to 2035
  • Figure 41: North America Market Attractiveness Analysis by Application
  • Figure 42: North America Market Value Share and BPS Analysis by Vertical, 2025 and 2035
  • Figure 43: North America Market Y-o-Y Growth Comparison by Vertical, 2025 to 2035
  • Figure 44: North America Market Attractiveness Analysis by Vertical
  • Figure 45: Latin America Market Value Share and BPS Analysis by Country, 2025 and 2035
  • Figure 46: Latin America Market Value Share and BPS Analysis by Product Type, 2025 and 2035
  • Figure 47: Latin America Market Y-o-Y Growth Comparison by Product Type, 2025 to 2035
  • Figure 48: Latin America Market Attractiveness Analysis by Product Type
  • Figure 49: Latin America Market Value Share and BPS Analysis by Installation Type, 2025 and 2035
  • Figure 50: Latin America Market Y-o-Y Growth Comparison by Installation Type, 2025 to 2035
  • Figure 51: Latin America Market Attractiveness Analysis by Installation Type
  • Figure 52: Latin America Market Value Share and BPS Analysis by System Type, 2025 and 2035
  • Figure 53: Latin America Market Y-o-Y Growth Comparison by System Type, 2025 to 2035
  • Figure 54: Latin America Market Attractiveness Analysis by System Type
  • Figure 55: Latin America Market Value Share and BPS Analysis by Application, 2025 and 2035
  • Figure 56: Latin America Market Y-o-Y Growth Comparison by Application, 2025 to 2035
  • Figure 57: Latin America Market Attractiveness Analysis by Application
  • Figure 58: Latin America Market Value Share and BPS Analysis by Vertical, 2025 and 2035
  • Figure 59: Latin America Market Y-o-Y Growth Comparison by Vertical, 2025 to 2035
  • Figure 60: Latin America Market Attractiveness Analysis by Vertical
  • Figure 61: Western Europe Market Value Share and BPS Analysis by Country, 2025 and 2035
  • Figure 62: Western Europe Market Value Share and BPS Analysis by Product Type, 2025 and 2035
  • Figure 63: Western Europe Market Y-o-Y Growth Comparison by Product Type, 2025 to 2035
  • Figure 64: Western Europe Market Attractiveness Analysis by Product Type
  • Figure 65: Western Europe Market Value Share and BPS Analysis by Installation Type, 2025 and 2035
  • Figure 66: Western Europe Market Y-o-Y Growth Comparison by Installation Type, 2025 to 2035
  • Figure 67: Western Europe Market Attractiveness Analysis by Installation Type
  • Figure 68: Western Europe Market Value Share and BPS Analysis by System Type, 2025 and 2035
  • Figure 69: Western Europe Market Y-o-Y Growth Comparison by System Type, 2025 to 2035
  • Figure 70: Western Europe Market Attractiveness Analysis by System Type
  • Figure 71: Western Europe Market Value Share and BPS Analysis by Application, 2025 and 2035
  • Figure 72: Western Europe Market Y-o-Y Growth Comparison by Application, 2025 to 2035
  • Figure 73: Western Europe Market Attractiveness Analysis by Application
  • Figure 74: Western Europe Market Value Share and BPS Analysis by Vertical, 2025 and 2035
  • Figure 75: Western Europe Market Y-o-Y Growth Comparison by Vertical, 2025 to 2035
  • Figure 76: Western Europe Market Attractiveness Analysis by Vertical
  • Figure 77: Eastern Europe Market Value Share and BPS Analysis by Country, 2025 and 2035
  • Figure 78: Eastern Europe Market Value Share and BPS Analysis by Product Type, 2025 and 2035
  • Figure 79: Eastern Europe Market Y-o-Y Growth Comparison by Product Type, 2025 to 2035
  • Figure 80: Eastern Europe Market Attractiveness Analysis by Product Type
  • Figure 81: Eastern Europe Market Value Share and BPS Analysis by Installation Type, 2025 and 2035
  • Figure 82: Eastern Europe Market Y-o-Y Growth Comparison by Installation Type, 2025 to 2035
  • Figure 83: Eastern Europe Market Attractiveness Analysis by Installation Type
  • Figure 84: Eastern Europe Market Value Share and BPS Analysis by System Type, 2025 and 2035
  • Figure 85: Eastern Europe Market Y-o-Y Growth Comparison by System Type, 2025 to 2035
  • Figure 86: Eastern Europe Market Attractiveness Analysis by System Type
  • Figure 87: Eastern Europe Market Value Share and BPS Analysis by Application, 2025 and 2035
  • Figure 88: Eastern Europe Market Y-o-Y Growth Comparison by Application, 2025 to 2035
  • Figure 89: Eastern Europe Market Attractiveness Analysis by Application
  • Figure 90: Eastern Europe Market Value Share and BPS Analysis by Vertical, 2025 and 2035
  • Figure 91: Eastern Europe Market Y-o-Y Growth Comparison by Vertical, 2025 to 2035
  • Figure 92: Eastern Europe Market Attractiveness Analysis by Vertical
  • Figure 93: East Asia Market Value Share and BPS Analysis by Country, 2025 and 2035
  • Figure 94: East Asia Market Value Share and BPS Analysis by Product Type, 2025 and 2035
  • Figure 95: East Asia Market Y-o-Y Growth Comparison by Product Type, 2025 to 2035
  • Figure 96: East Asia Market Attractiveness Analysis by Product Type
  • Figure 97: East Asia Market Value Share and BPS Analysis by Installation Type, 2025 and 2035
  • Figure 98: East Asia Market Y-o-Y Growth Comparison by Installation Type, 2025 to 2035
  • Figure 99: East Asia Market Attractiveness Analysis by Installation Type
  • Figure 100: East Asia Market Value Share and BPS Analysis by System Type, 2025 and 2035
  • Figure 101: East Asia Market Y-o-Y Growth Comparison by System Type, 2025 to 2035
  • Figure 102: East Asia Market Attractiveness Analysis by System Type
  • Figure 103: East Asia Market Value Share and BPS Analysis by Application, 2025 and 2035
  • Figure 104: East Asia Market Y-o-Y Growth Comparison by Application, 2025 to 2035
  • Figure 105: East Asia Market Attractiveness Analysis by Application
  • Figure 106: East Asia Market Value Share and BPS Analysis by Vertical, 2025 and 2035
  • Figure 107: East Asia Market Y-o-Y Growth Comparison by Vertical, 2025 to 2035
  • Figure 108: East Asia Market Attractiveness Analysis by Vertical
  • Figure 109: South Asia & Pacific Market Value Share and BPS Analysis by Country, 2025 and 2035
  • Figure 110: South Asia & Pacific Market Value Share and BPS Analysis by Product Type, 2025 and 2035
  • Figure 111: South Asia & Pacific Market Y-o-Y Growth Comparison by Product Type, 2025 to 2035
  • Figure 112: South Asia & Pacific Market Attractiveness Analysis by Product Type
  • Figure 113: South Asia & Pacific Market Value Share and BPS Analysis by Installation Type, 2025 and 2035
  • Figure 114: South Asia & Pacific Market Y-o-Y Growth Comparison by Installation Type, 2025 to 2035
  • Figure 115: South Asia & Pacific Market Attractiveness Analysis by Installation Type
  • Figure 116: South Asia & Pacific Market Value Share and BPS Analysis by System Type, 2025 and 2035
  • Figure 117: South Asia & Pacific Market Y-o-Y Growth Comparison by System Type, 2025 to 2035
  • Figure 118: South Asia & Pacific Market Attractiveness Analysis by System Type
  • Figure 119: South Asia & Pacific Market Value Share and BPS Analysis by Application, 2025 and 2035
  • Figure 120: South Asia & Pacific Market Y-o-Y Growth Comparison by Application, 2025 to 2035
  • Figure 121: South Asia & Pacific Market Attractiveness Analysis by Application
  • Figure 122: South Asia & Pacific Market Value Share and BPS Analysis by Vertical, 2025 and 2035
  • Figure 123: South Asia & Pacific Market Y-o-Y Growth Comparison by Vertical, 2025 to 2035
  • Figure 124: South Asia & Pacific Market Attractiveness Analysis by Vertical
  • Figure 125: Middle East and Africa Market Value Share and BPS Analysis by Country, 2025 and 2035
  • Figure 126: Middle East and Africa Market Value Share and BPS Analysis by Product Type, 2025 and 2035
  • Figure 127: Middle East and Africa Market Y-o-Y Growth Comparison by Product Type, 2025 to 2035
  • Figure 128: Middle East and Africa Market Attractiveness Analysis by Product Type
  • Figure 129: Middle East and Africa Market Value Share and BPS Analysis by Installation Type, 2025 and 2035
  • Figure 130: Middle East and Africa Market Y-o-Y Growth Comparison by Installation Type, 2025 to 2035
  • Figure 131: Middle East and Africa Market Attractiveness Analysis by Installation Type
  • Figure 132: Middle East and Africa Market Value Share and BPS Analysis by System Type, 2025 and 2035
  • Figure 133: Middle East and Africa Market Y-o-Y Growth Comparison by System Type, 2025 to 2035
  • Figure 134: Middle East and Africa Market Attractiveness Analysis by System Type
  • Figure 135: Middle East and Africa Market Value Share and BPS Analysis by Application, 2025 and 2035
  • Figure 136: Middle East and Africa Market Y-o-Y Growth Comparison by Application, 2025 to 2035
  • Figure 137: Middle East and Africa Market Attractiveness Analysis by Application
  • Figure 138: Middle East and Africa Market Value Share and BPS Analysis by Vertical, 2025 and 2035
  • Figure 139: Middle East and Africa Market Y-o-Y Growth Comparison by Vertical, 2025 to 2035
  • Figure 140: Middle East and Africa Market Attractiveness Analysis by Vertical
  • Figure 141: Global Market - Tier Structure Analysis
  • Figure 142: Global Market - Company Share Analysis

Frequently Asked Questions

What is the projected size of the wireless fire detection systems market in 2025?

The market is valued at USD 1.6 billion in 2025.

What is the outlook on the demand for wireless fire detection systems by 2035?

The market is forecasted to reach USD 3.1 billion by 2035, reflecting a CAGR of 7.6%.

Which system type is expected to grow the fastest in the wireless fire detection systems market?

Wireless systems are projected to grow at the fastest, with a market share of 65% in 2025.

What is the leading application segment for wireless fire detection systems in 2025?

Indoor applications are expected to lead the market due to their wide use in commercial and residential buildings.

Which country is projected to have the highest CAGR in the wireless fire detection systems market?

The USA is anticipated to post the highest CAGR of 8.2% from 2025 to 2035.

Explore Similar Insights

Future Market Insights

Wireless Fire Detection Systems Market