Reports

- Global Locations -

Headquarters

Future Market Insights, Inc.

Christiana Corporate, 200
Continental Drive, Suite 401,
Newark, Delaware - 19713,
United States

T: +1-845-579-5705

Americas

Future Market Insights, Inc.

616 Corporate Way, Suite 2-9018,
Valley Cottage, NY 10989, United States

T: +1-347-918-3531

MEA

Future Market Insights

1602-6 Jumeirah Bay X2 Tower, Plot No: JLT-PH2-X2A,
Jumeirah Lakes Towers, Dubai,
United Arab Emirates

Europe

Future Market Insights

3rd Floor, 207 Regent Street,
W1B 3HH London
United Kingdom

T: + 44 (0) 20 8123 9659
D: +44 (0) 20 3287 4268

Asia Pacific

Future Market Insights

IndiaLand Global Tech Park, Unit UG-1, Behind Grand HighStreet, Phase 1, Hinjawadi, MH, Pune – 411057, India

Wireless Battery Monitoring System Market Outlook (2022 to 2032)

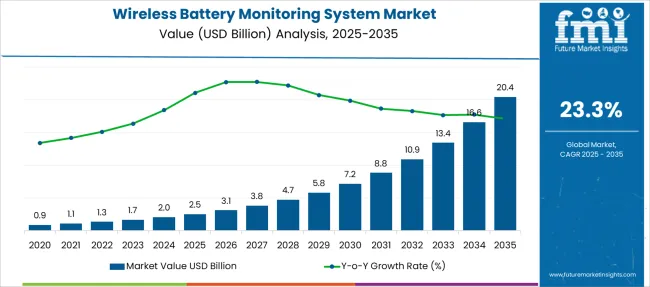
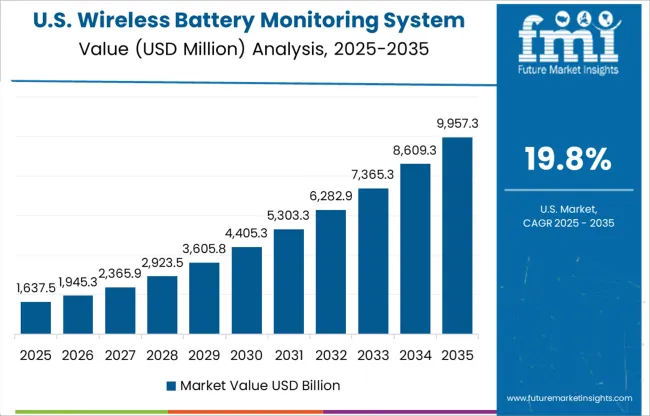
The global wireless battery monitoring system market is forecast to reach US$ 1,340.5 million in 2022. Based on the market report, sales of wireless battery monitoring system is projected to increase at a CAGR of 23.30% to reach an assessment of US$ 10,856.6 million by 2032.

Report Attribute Details
Wireless Battery Monitoring System Market Value (2022) US$ 1,340.5 Million
Wireless Battery Monitoring System Market Anticipated Value (2032) US$ 10,856.6 Million
Wireless Battery Monitoring System Projected Growth Rate (2022 to 2032) 23.30 %

The demand for wireless battery monitoring systems is anticipated to surge owing to the growing need for battery-operated vehicles and rising demand for efficient electric grid management and these two factors are likely to boost the growth of the global wireless battery monitoring system market during the forecast period.

Wireless battery monitoring systems are measuring and central evaluation systems for batteries. These systems can monitor and measure individual battery voltage, current and ambient temperature, voltage, acid levels, temperature, and electrical resistance. Most battery monitoring systems perform a resistance check once a week or once a month and they also provide the actual status of the battery and detect any failure in the case.

A wireless battery monitoring system comprises three elements viz., battery cell sensors, main control unit, and transceivers. The wireless battery monitoring system is most preferred as it ensures the battery’s long life while protecting it from any damage. Also, this system assists in maintaining the battery in the vital state for which it is given.

A wireless battery monitoring system has the potential to prevent overcurrent, and this system estimates the batteries’ functional state and optimizes the overall performance noting the functional status of the external devices. Owing to a slowdown in supply and logistics chains, there was a dearth of raw materials supply needed for manufacturing the systems.

Factors that could boost the sales of wireless battery monitoring systems are their ability and high capacity of flow batteries to endure extreme temperatures, this makes them appropriately suited for applications such as UPS and renewable energy systems.

Factors encouraging the growth of wireless battery monitoring systems are increasing industry preference for using lithium-ion batteries, the growing adoption of electric vehicles (EVs), and hybrid electric vehicles (HEVs). Across various end-use industries, there is a growing adoption of rechargeable batteries which further promotes market growth.

Don't pay for what you don't need

Customize your report by selecting specific countries or regions and save 30%!

Key Drivers and Restraining factors in the Wireless Battery Monitoring System Market

The adoption of batteries for energy storage used in emergency and grid-scale applications due to technological advancement is one of the key factors responsible for the growth of the global wireless battery monitoring system market. There has been an enormous growth in the use of electric vehicles, this has resulted in more adoption of wireless monitoring systems to maintain the safe functioning of batteries in these electric-powered vehicles.

Since electric vehicles protect the environment from harmful emissions, they have become prominent solutions for a sustainable environment. The growing adoption of electric vehicles is increasing considerably due to the sensitivity toward the advantages of these vehicles. Also, various research and development initiatives are also predicted to enhance the performance of electric vehicles. Various factors such as battery life and health, cell voltage, and charging and discharging rates impact the operation of the electric vehicle.

Market manufacturers are continuously engaged in developing enhanced batteries to better their life, this is because consumers across the world are having growing awareness pertaining to the maintenance cost of batteries. This has led to increasing demand for wireless battery monitoring systems and the growth of the global market.

Wireless monitoring systems can foresee any kind of failures or damage in batteries in advance, this could decrease the overall maintenance cost in the future. Furthermore, wireless monitoring system focuses to improve the safety of the maintenance workers. Benefits like these are projected to fuel the global wireless battery monitoring system market at a substantial growth rate during the forecast period.

While in crucial applications, it is vital to determine the batteries’ status. The demand for constant tracking of batteries in applications is likely to result in the market growth of wireless battery monitoring systems across the globe.

The demand for wireless battery monitoring systems is surging in the medical and healthcare industries. These industries demand a constant battery power supply and therefore wireless battery monitoring system plays a critical role in monitoring the status of the battery. These factors propel the global wireless battery monitoring system market.

Constant and steady enhancements along with research and development activities have been carried out in the last ten years in terms of improving the energy and power of lithium-ion batteries. These factors are giving way to various applications of lithium-ion batteries across industries. These batteries render superior power density, decreased cost, and lower self-discharge. The increasing application of lithium-ion batteries is promoting the global wireless battery monitoring systems market.

Lastly, the assembly and interlinking of battery cells for managing their temperature and voltage are not cost-efficient and this is hindering the global wireless battery monitoring systems market.
North America to Hold a Significant Market Share in Wireless Battery Monitoring System Market

North America is accountable for a 32.60% market share in the global wireless battery monitoring systems market owing to the increasing penetration of electric vehicles. North America has favorable government policies and employment of various supportive government monetary policies for developing hybrid electric vehicles along with growing automotive sales.

This region’s market is dominating owing to the presence of various industry participants and considerable research and development activities in power wireless battery monitoring systems. The American Recovery and Reinvestment Act gives funds for developing hybrid electric vehicles for usage by public and commercial organizations. This factor is predicted to promote the market in countries such as the United States in the North American region.

Sudip Saha
Sudip Saha

Principal Consultant

Talk to Analyst

Find your sweet spots for generating winning opportunities in this market.

What is the Regional Outlook for the Asia Pacific Wireless Battery Monitoring System Market?

Following North America, Asia Pacific is known to lead the global wireless battery monitoring systems market. This region is said to have substantial potential growth owing to the increasing adoption of wireless battery monitoring systems along with increasing awareness in organizations for battery protection.

With the growing adoption of electric vehicles in countries like India and China, the Asia Pacific region is anticipated to experience huge demand for wireless battery monitoring systems during the forecast period. There are multiple automotive manufacturers who are expanding their footprint in this region, and this is anticipated to promote the growth of the Asia Pacific wireless battery monitoring systems market.

How is the Start-up Ecosystem in the Wireless Battery Monitoring System Market?

Startups in the market are evolving due to alteration and fluctuations and innovation of novel technology. This results in the development of new and exciting trends. This research report monitors the start-up ecosystem from across the globe and introduces significant market insights.

For, example In May 2022, Marelli who is a leading global automotive supplier announced the expansion of its range of battery management technologies for electric vehicles with a new state-of-the-art wireless distributed battery management system.
Get the data you need at a Fraction of the cost

Personalize your report by choosing insights you need
and save 40%!

Who are the Key Players in the Wireless Battery Monitoring System Market?

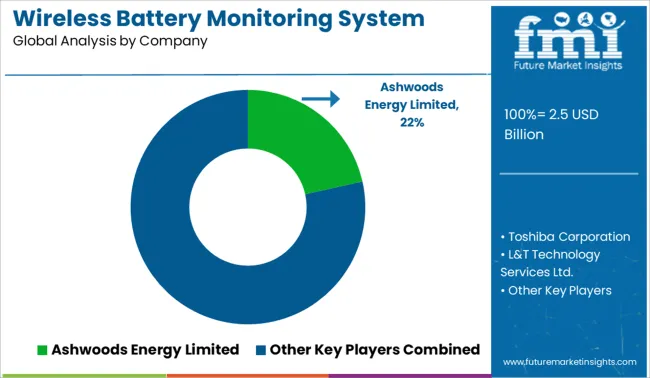
Some of the key players in the wireless battery monitoring system market are Ashwoods Energy Limited, Toshiba Corporation, L&T Technology Services Ltd., Merlin Equipment Ltd., Vecture Inc., Lithium Balance Corporation, and Nuvation Engineering.

Recent Developments in the Wireless Battery Monitoring System Market

  • In June 2022, Toshiba Energy Systems & Solutions Corporation announced its latest development of a superconducting motor to fulfill the needs of the mobility sector. This motor can recognize lightweight, high-speed rotation, and high-output density, and can be made available for bigger mobility applications.
  • Toshiba Electronic Devices & Storage Corporation announced its partnership with Farnell to intensify the supply chain for an extended range of novel and innovative products.

Report Scope

Report Attribute Details
Growth Rate CAGR of 23.30% from 2022 to 2032
Base Year for Estimation 2021
Historical Data 2014 to 2020
Forecast Period 2022 to 2032
Quantitative Units Revenue in USD million and CAGR from 2022 to 2032
Report Coverage Revenue Forecast, Volume Forecast, Company Ranking, Competitive Landscape, Growth Factors, Trends, and Pricing Analysis
Segments Covered
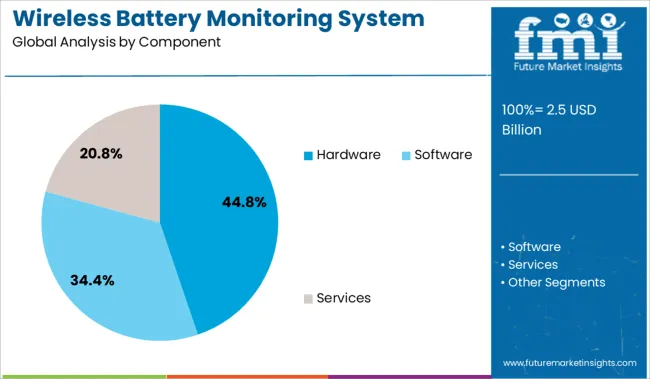
  • Component
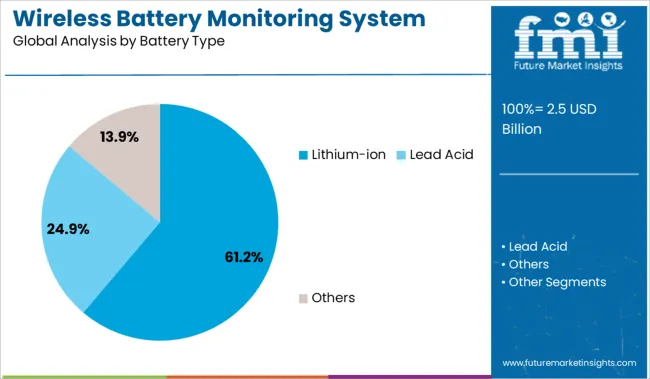
  • Battery Type
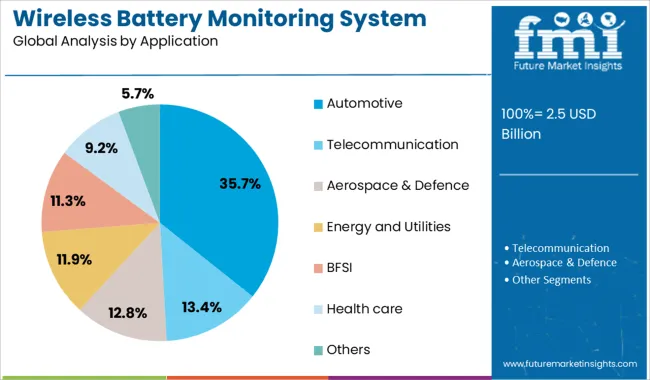
  • Application
  • Region
Regions Covered
  • North America
  • Latin America
  • Europe
  • East Asia
  • South Asia
  • Oceania
  • Middle East and Africa
Key Countries Profiled
  • United States of America
  • Canada
  • Brazil
  • Argentina
  • Germany
  • United Kingdom
  • France
  • Spain
  • Italy
  • Nordics
  • BENELUX
  • Australia & New Zealand
  • China
  • India
  • ASEAN
  • GCC Countries
  • South Africa
Key Companies Profiled
  • Ashwoods Energy Limited
  • Toshiba Corporation
  • L&T Technology Services Ltd.
  • Merlin Equipment Ltd.
  • Vecture Inc.
  • Lithium Balance Corporation
  • Nuvation Engineering.
Customization Available Upon Request

Key Segments of the Wireless Battery Monitoring System Market

By Component:

  • Hardware
  • Software
  • Services

By Battery Type:

  • Lithium-ion
  • Lead Acid
  • Others

By Application:

  • Automotive
  • Telecommunication
  • Aerospace & Defence
  • Energy and Utilities
  • BFSI
  • Health care
  • Others

Frequently Asked Questions

What is the Growth Outlook for the Wireless Battery Monitoring System Market?

The wireless battery monitoring system market is predicted to advance at a CAGR of 23.30% from 2022 to 2032.

Which Region Leads the Wireless Battery Monitoring System Market?

The North American region is anticipated to lead the wireless battery monitoring system market during the forecast period.

How much Growth Potential does the Wireless Battery Monitoring System Market hold?

The wireless battery monitoring system market is likely to hold a valuation of US$ 10,856.6 million by 2032.

Table of Content

1. Executive Summary | Wireless Battery Monitoring System Market

    1.1. Global Market Outlook

    1.2. Demand-side Trends

    1.3. Supply-side Trends

    1.4. Technology Roadmap Analysis

    1.5. Analysis and Recommendations

2. Market Overview

    2.1. Market Coverage / Taxonomy

    2.2. Market Definition / Scope / Limitations

3. Market Background

    3.1. Market Dynamics

        3.1.1. Drivers

        3.1.2. Restraints

        3.1.3. Opportunity

        3.1.4. Trends

    3.2. Scenario Forecast

        3.2.1. Demand in Optimistic Scenario

        3.2.2. Demand in Likely Scenario

        3.2.3. Demand in Conservative Scenario

    3.3. Opportunity Map Analysis

    3.4. Product Life Cycle Analysis

    3.5. Supply Chain Analysis

        3.5.1. Supply Side Participants and Their Roles

            3.5.1.1. Producers

            3.5.1.2. Mid-Level Participants (Traders/ Agents/ Brokers)

            3.5.1.3. Wholesalers and Distributors

        3.5.2. Value Added and Value Created at Node in the Supply Chain

        3.5.3. List of Raw Material Suppliers

        3.5.4. List of Existing and Potential Buyers

    3.6. Investment Feasibility Matrix

    3.7. Value Chain Analysis

        3.7.1. Profit Margin Analysis

        3.7.2. Wholesalers and Distributors

        3.7.3. Retailers

    3.8. PESTLE and Porter’s Analysis

    3.9. Regulatory Landscape

        3.9.1. By Key Regions

        3.9.2. By Key Countries

    3.10. Regional Parent Market Outlook

    3.11. Production and Consumption Statistics

    3.12. Import and Export Statistics

4. Global Market Analysis 2017 to 2021 and Forecast, 2022 to 2032

    4.1. Historical Market Size Value (US$ Million) & Volume (Units) Analysis, 2017 to 2021

    4.2. Current and Future Market Size Value (US$ Million) & Volume (Units) Projections, 2022 to 2032

        4.2.1. Y-o-Y Growth Trend Analysis

        4.2.2. Absolute $ Opportunity Analysis

5. Global Market Analysis 2017 to 2021 and Forecast 2022 to 2032, By Component

    5.1. Introduction / Key Findings

    5.2. Historical Market Size Value (US$ Million) & Volume (Units) Analysis By Component, 2017 to 2021

    5.3. Current and Future Market Size Value (US$ Million) & Volume (Units) Analysis and Forecast By Component, 2022 to 2032

        5.3.1. Battery Management Unit

        5.3.2. Communication Unit

    5.4. Y-o-Y Growth Trend Analysis By Component, 2017 to 2021

    5.5. Absolute $ Opportunity Analysis By Component, 2022 to 2032

6. Global Market Analysis 2017 to 2021 and Forecast 2022 to 2032, By Applications

    6.1. Introduction / Key Findings

    6.2. Historical Market Size Value (US$ Million) & Volume (Units) Analysis By Applications, 2017 to 2021

    6.3. Current and Future Market Size Value (US$ Million) & Volume (Units) Analysis and Forecast By Applications, 2022 to 2032

        6.3.1. DC Power Supply

        6.3.2. IDC Data Center

        6.3.3. Others

    6.4. Y-o-Y Growth Trend Analysis By Applications, 2017 to 2021

    6.5. Absolute $ Opportunity Analysis By Applications, 2022 to 2032

7. Global Market Analysis 2017 to 2021 and Forecast 2022 to 2032, By Industry

    7.1. Introduction / Key Findings

    7.2. Historical Market Size Value (US$ Million) & Volume (Units) Analysis By Industry, 2017 to 2021

    7.3. Current and Future Market Size Value (US$ Million) & Volume (Units) Analysis and Forecast By Industry, 2022 to 2032

        7.3.1. Energy and Utilities

        7.3.2. IT and Telecommunications

        7.3.3. Manufacturing

        7.3.4. Transportation and Logistics

        7.3.5. Defense and Government

        7.3.6. BFSI

        7.3.7. Healthcare

        7.3.8. Retail

        7.3.9. Others

    7.4. Y-o-Y Growth Trend Analysis By Industry, 2017 to 2021

    7.5. Absolute $ Opportunity Analysis By Industry, 2022 to 2032

8. Global Market Analysis 2017 to 2021 and Forecast 2022 to 2032, By Region

    8.1. Introduction

    8.2. Historical Market Size Value (US$ Million) & Volume (Units) Analysis By Region, 2017 to 2021

    8.3. Current Market Size Value (US$ Million) & Volume (Units) Analysis and Forecast By Region, 2022 to 2032

        8.3.1. North America

        8.3.2. Latin America

        8.3.3. Europe

        8.3.4. Asia Pacific

        8.3.5. Middle East and Africa

    8.4. Market Attractiveness Analysis By Region

9. North America Market Analysis 2017 to 2021 and Forecast 2022 to 2032, By Country

    9.1. Historical Market Size Value (US$ Million) & Volume (Units) Trend Analysis By Market Taxonomy, 2017 to 2021

    9.2. Market Size Value (US$ Million) & Volume (Units) Forecast By Market Taxonomy, 2022 to 2032

        9.2.1. By Country

            9.2.1.1. United States of America

            9.2.1.2. Canada

        9.2.2. By Component

        9.2.3. By Applications

        9.2.4. By Industry

    9.3. Market Attractiveness Analysis

        9.3.1. By Country

        9.3.2. By Component

        9.3.3. By Applications

        9.3.4. By Industry

    9.4. Key Takeaways

10. Latin America Market Analysis 2017 to 2021 and Forecast 2022 to 2032, By Country

    10.1. Historical Market Size Value (US$ Million) & Volume (Units) Trend Analysis By Market Taxonomy, 2017 to 2021

    10.2. Market Size Value (US$ Million) & Volume (Units) Forecast By Market Taxonomy, 2022 to 2032

        10.2.1. By Country

            10.2.1.1. Brazil

            10.2.1.2. Mexico

            10.2.1.3. Rest of Latin America

        10.2.2. By Component

        10.2.3. By Applications

        10.2.4. By Industry

    10.3. Market Attractiveness Analysis

        10.3.1. By Country

        10.3.2. By Component

        10.3.3. By Applications

        10.3.4. By Industry

    10.4. Key Takeaways

11. Europe Market Analysis 2017 to 2021 and Forecast 2022 to 2032, By Country

    11.1. Historical Market Size Value (US$ Million) & Volume (Units) Trend Analysis By Market Taxonomy, 2017 to 2021

    11.2. Market Size Value (US$ Million) & Volume (Units) Forecast By Market Taxonomy, 2022 to 2032

        11.2.1. By Country

            11.2.1.1. Germany

            11.2.1.2. United Kingdom

            11.2.1.3. France

            11.2.1.4. Spain

            11.2.1.5. Italy

            11.2.1.6. Rest of Europe

        11.2.2. By Component

        11.2.3. By Applications

        11.2.4. By Industry

    11.3. Market Attractiveness Analysis

        11.3.1. By Country

        11.3.2. By Component

        11.3.3. By Applications

        11.3.4. By Industry

    11.4. Key Takeaways

12. Asia Pacific Market Analysis 2017 to 2021 and Forecast 2022 to 2032, By Country

    12.1. Historical Market Size Value (US$ Million) & Volume (Units) Trend Analysis By Market Taxonomy, 2017 to 2021

    12.2. Market Size Value (US$ Million) & Volume (Units) Forecast By Market Taxonomy, 2022 to 2032

        12.2.1. By Country

            12.2.1.1. China

            12.2.1.2. Japan

            12.2.1.3. South Korea

            12.2.1.4. Malaysia

            12.2.1.5. Singapore

            12.2.1.6. Australia

            12.2.1.7. New Zealand

            12.2.1.8. Rest of Asia-Pacific

        12.2.2. By Component

        12.2.3. By Applications

        12.2.4. By Industry

    12.3. Market Attractiveness Analysis

        12.3.1. By Country

        12.3.2. By Component

        12.3.3. By Applications

        12.3.4. By Industry

    12.4. Key Takeaways

13. MEA Market Analysis 2017 to 2021 and Forecast 2022 to 2032, By Country

    13.1. Historical Market Size Value (US$ Million) & Volume (Units) Trend Analysis By Market Taxonomy, 2017 to 2021

    13.2. Market Size Value (US$ Million) & Volume (Units) Forecast By Market Taxonomy, 2022 to 2032

        13.2.1. By Country

            13.2.1.1. GCC Countries

            13.2.1.2. South Africa

            13.2.1.3. Israel

            13.2.1.4. Rest of Middle East and Africa

        13.2.2. By Component

        13.2.3. By Applications

        13.2.4. By Industry

    13.3. Market Attractiveness Analysis

        13.3.1. By Country

        13.3.2. By Component

        13.3.3. By Applications

        13.3.4. By Industry

    13.4. Key Takeaways

14. Key Countries Market Analysis

    14.1. United States of America

        14.1.1. Pricing Analysis

        14.1.2. Market Share Analysis, 2021

            14.1.2.1. By Component

            14.1.2.2. By Applications

            14.1.2.3. By Industry

    14.2. Canada

        14.2.1. Pricing Analysis

        14.2.2. Market Share Analysis, 2021

            14.2.2.1. By Component

            14.2.2.2. By Applications

            14.2.2.3. By Industry

    14.3. Brazil

        14.3.1. Pricing Analysis

        14.3.2. Market Share Analysis, 2021

            14.3.2.1. By Component

            14.3.2.2. By Applications

            14.3.2.3. By Industry

    14.4. Mexico

        14.4.1. Pricing Analysis

        14.4.2. Market Share Analysis, 2021

            14.4.2.1. By Component

            14.4.2.2. By Applications

            14.4.2.3. By Industry

    14.5. Germany

        14.5.1. Pricing Analysis

        14.5.2. Market Share Analysis, 2021

            14.5.2.1. By Component

            14.5.2.2. By Applications

            14.5.2.3. By Industry

    14.6. United Kingdom

        14.6.1. Pricing Analysis

        14.6.2. Market Share Analysis, 2021

            14.6.2.1. By Component

            14.6.2.2. By Applications

            14.6.2.3. By Industry

    14.7. France

        14.7.1. Pricing Analysis

        14.7.2. Market Share Analysis, 2021

            14.7.2.1. By Component

            14.7.2.2. By Applications

            14.7.2.3. By Industry

    14.8. Spain

        14.8.1. Pricing Analysis

        14.8.2. Market Share Analysis, 2021

            14.8.2.1. By Component

            14.8.2.2. By Applications

            14.8.2.3. By Industry

    14.9. Italy

        14.9.1. Pricing Analysis

        14.9.2. Market Share Analysis, 2021

            14.9.2.1. By Component

            14.9.2.2. By Applications

            14.9.2.3. By Industry

    14.10. China

        14.10.1. Pricing Analysis

        14.10.2. Market Share Analysis, 2021

            14.10.2.1. By Component

            14.10.2.2. By Applications

            14.10.2.3. By Industry

    14.11. Japan

        14.11.1. Pricing Analysis

        14.11.2. Market Share Analysis, 2021

            14.11.2.1. By Component

            14.11.2.2. By Applications

            14.11.2.3. By Industry

    14.12. South Korea

        14.12.1. Pricing Analysis

        14.12.2. Market Share Analysis, 2021

            14.12.2.1. By Component

            14.12.2.2. By Applications

            14.12.2.3. By Industry

    14.13. Malaysia

        14.13.1. Pricing Analysis

        14.13.2. Market Share Analysis, 2021

            14.13.2.1. By Component

            14.13.2.2. By Applications

            14.13.2.3. By Industry

    14.14. Singapore

        14.14.1. Pricing Analysis

        14.14.2. Market Share Analysis, 2021

            14.14.2.1. By Component

            14.14.2.2. By Applications

            14.14.2.3. By Industry

    14.15. Australia

        14.15.1. Pricing Analysis

        14.15.2. Market Share Analysis, 2021

            14.15.2.1. By Component

            14.15.2.2. By Applications

            14.15.2.3. By Industry

    14.16. New Zealand

        14.16.1. Pricing Analysis

        14.16.2. Market Share Analysis, 2021

            14.16.2.1. By Component

            14.16.2.2. By Applications

            14.16.2.3. By Industry

    14.17. GCC Countries

        14.17.1. Pricing Analysis

        14.17.2. Market Share Analysis, 2021

            14.17.2.1. By Component

            14.17.2.2. By Applications

            14.17.2.3. By Industry

    14.18. South Africa

        14.18.1. Pricing Analysis

        14.18.2. Market Share Analysis, 2021

            14.18.2.1. By Component

            14.18.2.2. By Applications

            14.18.2.3. By Industry

    14.19. Israel

        14.19.1. Pricing Analysis

        14.19.2. Market Share Analysis, 2021

            14.19.2.1. By Component

            14.19.2.2. By Applications

            14.19.2.3. By Industry

15. Market Structure Analysis

    15.1. Competition Dashboard

    15.2. Competition Benchmarking

    15.3. Market Share Analysis of Top Players

        15.3.1. By Regional

        15.3.2. By Component

        15.3.3. By Applications

        15.3.4. By Industry

16. Competition Analysis

    16.1. Competition Deep Dive

        16.1.1. Ashwoods Energy Limited

            16.1.1.1. Overview

            16.1.1.2. Product Portfolio

            16.1.1.3. Profitability by Market Segments

            16.1.1.4. Sales Footprint

            16.1.1.5. Strategy Overview

                16.1.1.5.1. Marketing Strategy

                16.1.1.5.2. Product Strategy

                16.1.1.5.3. Channel Strategy

        16.1.2. Toshiba Corporation

            16.1.2.1. Overview

            16.1.2.2. Product Portfolio

            16.1.2.3. Profitability by Market Segments

            16.1.2.4. Sales Footprint

            16.1.2.5. Strategy Overview

                16.1.2.5.1. Marketing Strategy

                16.1.2.5.2. Product Strategy

                16.1.2.5.3. Channel Strategy

        16.1.3. L&T Technology Services Ltd.

            16.1.3.1. Overview

            16.1.3.2. Product Portfolio

            16.1.3.3. Profitability by Market Segments

            16.1.3.4. Sales Footprint

            16.1.3.5. Strategy Overview

                16.1.3.5.1. Marketing Strategy

                16.1.3.5.2. Product Strategy

                16.1.3.5.3. Channel Strategy

        16.1.4. Merlin Equipment Ltd.

            16.1.4.1. Overview

            16.1.4.2. Product Portfolio

            16.1.4.3. Profitability by Market Segments

            16.1.4.4. Sales Footprint

            16.1.4.5. Strategy Overview

                16.1.4.5.1. Marketing Strategy

                16.1.4.5.2. Product Strategy

                16.1.4.5.3. Channel Strategy

        16.1.5. Vecture Inc.

            16.1.5.1. Overview

            16.1.5.2. Product Portfolio

            16.1.5.3. Profitability by Market Segments

            16.1.5.4. Sales Footprint

            16.1.5.5. Strategy Overview

                16.1.5.5.1. Marketing Strategy

                16.1.5.5.2. Product Strategy

                16.1.5.5.3. Channel Strategy

        16.1.6. Lithium Balance Corporation

            16.1.6.1. Overview

            16.1.6.2. Product Portfolio

            16.1.6.3. Profitability by Market Segments

            16.1.6.4. Sales Footprint

            16.1.6.5. Strategy Overview

                16.1.6.5.1. Marketing Strategy

                16.1.6.5.2. Product Strategy

                16.1.6.5.3. Channel Strategy

        16.1.7. Nuvation Engineering

            16.1.7.1. Overview

            16.1.7.2. Product Portfolio

            16.1.7.3. Profitability by Market Segments

            16.1.7.4. Sales Footprint

            16.1.7.5. Strategy Overview

                16.1.7.5.1. Marketing Strategy

                16.1.7.5.2. Product Strategy

                16.1.7.5.3. Channel Strategy

        16.1.8. Texas Instruments

            16.1.8.1. Overview

            16.1.8.2. Product Portfolio

            16.1.8.3. Profitability by Market Segments

            16.1.8.4. Sales Footprint

            16.1.8.5. Strategy Overview

                16.1.8.5.1. Marketing Strategy

                16.1.8.5.2. Product Strategy

                16.1.8.5.3. Channel Strategy

        16.1.9. PowerShield

            16.1.9.1. Overview

            16.1.9.2. Product Portfolio

            16.1.9.3. Profitability by Market Segments

            16.1.9.4. Sales Footprint

            16.1.9.5. Strategy Overview

                16.1.9.5.1. Marketing Strategy

                16.1.9.5.2. Product Strategy

                16.1.9.5.3. Channel Strategy

        16.1.10. Schneider Electric

            16.1.10.1. Overview

            16.1.10.2. Product Portfolio

            16.1.10.3. Profitability by Market Segments

            16.1.10.4. Sales Footprint

            16.1.10.5. Strategy Overview

                16.1.10.5.1. Marketing Strategy

                16.1.10.5.2. Product Strategy

                16.1.10.5.3. Channel Strategy

17. Assumptions & Acronyms Used

18. Research Methodology

Don't pay for what you don't need

Customize your report by selecting specific countries or regions and save 30%!

List of Tables

Table 1: Global Market Value (US$ Million) Forecast by Region, 2017 to 2032

Table 2: Global Market Volume (Units) Forecast by Region, 2017 to 2032

Table 3: Global Market Value (US$ Million) Forecast by Component, 2017 to 2032

Table 4: Global Market Volume (Units) Forecast by Component, 2017 to 2032

Table 5: Global Market Value (US$ Million) Forecast by Applications, 2017 to 2032

Table 6: Global Market Volume (Units) Forecast by Applications, 2017 to 2032

Table 7: Global Market Value (US$ Million) Forecast by Industry, 2017 to 2032

Table 8: Global Market Volume (Units) Forecast by Industry, 2017 to 2032

Table 9: North America Market Value (US$ Million) Forecast by Country, 2017 to 2032

Table 10: North America Market Volume (Units) Forecast by Country, 2017 to 2032

Table 11: North America Market Value (US$ Million) Forecast by Component, 2017 to 2032

Table 12: North America Market Volume (Units) Forecast by Component, 2017 to 2032

Table 13: North America Market Value (US$ Million) Forecast by Applications, 2017 to 2032

Table 14: North America Market Volume (Units) Forecast by Applications, 2017 to 2032

Table 15: North America Market Value (US$ Million) Forecast by Industry, 2017 to 2032

Table 16: North America Market Volume (Units) Forecast by Industry, 2017 to 2032

Table 17: Latin America Market Value (US$ Million) Forecast by Country, 2017 to 2032

Table 18: Latin America Market Volume (Units) Forecast by Country, 2017 to 2032

Table 19: Latin America Market Value (US$ Million) Forecast by Component, 2017 to 2032

Table 20: Latin America Market Volume (Units) Forecast by Component, 2017 to 2032

Table 21: Latin America Market Value (US$ Million) Forecast by Applications, 2017 to 2032

Table 22: Latin America Market Volume (Units) Forecast by Applications, 2017 to 2032

Table 23: Latin America Market Value (US$ Million) Forecast by Industry, 2017 to 2032

Table 24: Latin America Market Volume (Units) Forecast by Industry, 2017 to 2032

Table 25: Europe Market Value (US$ Million) Forecast by Country, 2017 to 2032

Table 26: Europe Market Volume (Units) Forecast by Country, 2017 to 2032

Table 27: Europe Market Value (US$ Million) Forecast by Component, 2017 to 2032

Table 28: Europe Market Volume (Units) Forecast by Component, 2017 to 2032

Table 29: Europe Market Value (US$ Million) Forecast by Applications, 2017 to 2032

Table 30: Europe Market Volume (Units) Forecast by Applications, 2017 to 2032

Table 31: Europe Market Value (US$ Million) Forecast by Industry, 2017 to 2032

Table 32: Europe Market Volume (Units) Forecast by Industry, 2017 to 2032

Table 33: Asia Pacific Market Value (US$ Million) Forecast by Country, 2017 to 2032

Table 34: Asia Pacific Market Volume (Units) Forecast by Country, 2017 to 2032

Table 35: Asia Pacific Market Value (US$ Million) Forecast by Component, 2017 to 2032

Table 36: Asia Pacific Market Volume (Units) Forecast by Component, 2017 to 2032

Table 37: Asia Pacific Market Value (US$ Million) Forecast by Applications, 2017 to 2032

Table 38: Asia Pacific Market Volume (Units) Forecast by Applications, 2017 to 2032

Table 39: Asia Pacific Market Value (US$ Million) Forecast by Industry, 2017 to 2032

Table 40: Asia Pacific Market Volume (Units) Forecast by Industry, 2017 to 2032

Table 41: Middle East and Africa Market Value (US$ Million) Forecast by Country, 2017 to 2032

Table 42: Middle East and Africa Market Volume (Units) Forecast by Country, 2017 to 2032

Table 43: Middle East and Africa Market Value (US$ Million) Forecast by Component, 2017 to 2032

Table 44: Middle East and Africa Market Volume (Units) Forecast by Component, 2017 to 2032

Table 45: Middle East and Africa Market Value (US$ Million) Forecast by Applications, 2017 to 2032

Table 46: Middle East and Africa Market Volume (Units) Forecast by Applications, 2017 to 2032

Table 47: Middle East and Africa Market Value (US$ Million) Forecast by Industry, 2017 to 2032

Table 48: Middle East and Africa Market Volume (Units) Forecast by Industry, 2017 to 2032
Sudip Saha
Sudip Saha

Principal Consultant

Talk to Analyst

Find your sweet spots for generating winning opportunities in this market.

List of Charts

Figure 1: Global Market Value (US$ Million) by Component, 2022 to 2032

Figure 2: Global Market Value (US$ Million) by Applications, 2022 to 2032

Figure 3: Global Market Value (US$ Million) by Industry, 2022 to 2032

Figure 4: Global Market Value (US$ Million) by Region, 2022 to 2032

Figure 5: Global Market Value (US$ Million) Analysis by Region, 2017 to 2032

Figure 6: Global Market Volume (Units) Analysis by Region, 2017 to 2032

Figure 7: Global Market Value Share (%) and BPS Analysis by Region, 2022 to 2032

Figure 8: Global Market Y-o-Y Growth (%) Projections by Region, 2022 to 2032

Figure 9: Global Market Value (US$ Million) Analysis by Component, 2017 to 2032

Figure 10: Global Market Volume (Units) Analysis by Component, 2017 to 2032

Figure 11: Global Market Value Share (%) and BPS Analysis by Component, 2022 to 2032

Figure 12: Global Market Y-o-Y Growth (%) Projections by Component, 2022 to 2032

Figure 13: Global Market Value (US$ Million) Analysis by Applications, 2017 to 2032

Figure 14: Global Market Volume (Units) Analysis by Applications, 2017 to 2032

Figure 15: Global Market Value Share (%) and BPS Analysis by Applications, 2022 to 2032

Figure 16: Global Market Y-o-Y Growth (%) Projections by Applications, 2022 to 2032

Figure 17: Global Market Value (US$ Million) Analysis by Industry, 2017 to 2032

Figure 18: Global Market Volume (Units) Analysis by Industry, 2017 to 2032

Figure 19: Global Market Value Share (%) and BPS Analysis by Industry, 2022 to 2032

Figure 20: Global Market Y-o-Y Growth (%) Projections by Industry, 2022 to 2032

Figure 21: Global Market Attractiveness by Component, 2022 to 2032

Figure 22: Global Market Attractiveness by Applications, 2022 to 2032

Figure 23: Global Market Attractiveness by Industry, 2022 to 2032

Figure 24: Global Market Attractiveness by Region, 2022 to 2032

Figure 25: North America Market Value (US$ Million) by Component, 2022 to 2032

Figure 26: North America Market Value (US$ Million) by Applications, 2022 to 2032

Figure 27: North America Market Value (US$ Million) by Industry, 2022 to 2032

Figure 28: North America Market Value (US$ Million) by Country, 2022 to 2032

Figure 29: North America Market Value (US$ Million) Analysis by Country, 2017 to 2032

Figure 30: North America Market Volume (Units) Analysis by Country, 2017 to 2032

Figure 31: North America Market Value Share (%) and BPS Analysis by Country, 2022 to 2032

Figure 32: North America Market Y-o-Y Growth (%) Projections by Country, 2022 to 2032

Figure 33: North America Market Value (US$ Million) Analysis by Component, 2017 to 2032

Figure 34: North America Market Volume (Units) Analysis by Component, 2017 to 2032

Figure 35: North America Market Value Share (%) and BPS Analysis by Component, 2022 to 2032

Figure 36: North America Market Y-o-Y Growth (%) Projections by Component, 2022 to 2032

Figure 37: North America Market Value (US$ Million) Analysis by Applications, 2017 to 2032

Figure 38: North America Market Volume (Units) Analysis by Applications, 2017 to 2032

Figure 39: North America Market Value Share (%) and BPS Analysis by Applications, 2022 to 2032

Figure 40: North America Market Y-o-Y Growth (%) Projections by Applications, 2022 to 2032

Figure 41: North America Market Value (US$ Million) Analysis by Industry, 2017 to 2032

Figure 42: North America Market Volume (Units) Analysis by Industry, 2017 to 2032

Figure 43: North America Market Value Share (%) and BPS Analysis by Industry, 2022 to 2032

Figure 44: North America Market Y-o-Y Growth (%) Projections by Industry, 2022 to 2032

Figure 45: North America Market Attractiveness by Component, 2022 to 2032

Figure 46: North America Market Attractiveness by Applications, 2022 to 2032

Figure 47: North America Market Attractiveness by Industry, 2022 to 2032

Figure 48: North America Market Attractiveness by Country, 2022 to 2032

Figure 49: Latin America Market Value (US$ Million) by Component, 2022 to 2032

Figure 50: Latin America Market Value (US$ Million) by Applications, 2022 to 2032

Figure 51: Latin America Market Value (US$ Million) by Industry, 2022 to 2032

Figure 52: Latin America Market Value (US$ Million) by Country, 2022 to 2032

Figure 53: Latin America Market Value (US$ Million) Analysis by Country, 2017 to 2032

Figure 54: Latin America Market Volume (Units) Analysis by Country, 2017 to 2032

Figure 55: Latin America Market Value Share (%) and BPS Analysis by Country, 2022 to 2032

Figure 56: Latin America Market Y-o-Y Growth (%) Projections by Country, 2022 to 2032

Figure 57: Latin America Market Value (US$ Million) Analysis by Component, 2017 to 2032

Figure 58: Latin America Market Volume (Units) Analysis by Component, 2017 to 2032

Figure 59: Latin America Market Value Share (%) and BPS Analysis by Component, 2022 to 2032

Figure 60: Latin America Market Y-o-Y Growth (%) Projections by Component, 2022 to 2032

Figure 61: Latin America Market Value (US$ Million) Analysis by Applications, 2017 to 2032

Figure 62: Latin America Market Volume (Units) Analysis by Applications, 2017 to 2032

Figure 63: Latin America Market Value Share (%) and BPS Analysis by Applications, 2022 to 2032

Figure 64: Latin America Market Y-o-Y Growth (%) Projections by Applications, 2022 to 2032

Figure 65: Latin America Market Value (US$ Million) Analysis by Industry, 2017 to 2032

Figure 66: Latin America Market Volume (Units) Analysis by Industry, 2017 to 2032

Figure 67: Latin America Market Value Share (%) and BPS Analysis by Industry, 2022 to 2032

Figure 68: Latin America Market Y-o-Y Growth (%) Projections by Industry, 2022 to 2032

Figure 69: Latin America Market Attractiveness by Component, 2022 to 2032

Figure 70: Latin America Market Attractiveness by Applications, 2022 to 2032

Figure 71: Latin America Market Attractiveness by Industry, 2022 to 2032

Figure 72: Latin America Market Attractiveness by Country, 2022 to 2032

Figure 73: Europe Market Value (US$ Million) by Component, 2022 to 2032

Figure 74: Europe Market Value (US$ Million) by Applications, 2022 to 2032

Figure 75: Europe Market Value (US$ Million) by Industry, 2022 to 2032

Figure 76: Europe Market Value (US$ Million) by Country, 2022 to 2032

Figure 77: Europe Market Value (US$ Million) Analysis by Country, 2017 to 2032

Figure 78: Europe Market Volume (Units) Analysis by Country, 2017 to 2032

Figure 79: Europe Market Value Share (%) and BPS Analysis by Country, 2022 to 2032

Figure 80: Europe Market Y-o-Y Growth (%) Projections by Country, 2022 to 2032

Figure 81: Europe Market Value (US$ Million) Analysis by Component, 2017 to 2032

Figure 82: Europe Market Volume (Units) Analysis by Component, 2017 to 2032

Figure 83: Europe Market Value Share (%) and BPS Analysis by Component, 2022 to 2032

Figure 84: Europe Market Y-o-Y Growth (%) Projections by Component, 2022 to 2032

Figure 85: Europe Market Value (US$ Million) Analysis by Applications, 2017 to 2032

Figure 86: Europe Market Volume (Units) Analysis by Applications, 2017 to 2032

Figure 87: Europe Market Value Share (%) and BPS Analysis by Applications, 2022 to 2032

Figure 88: Europe Market Y-o-Y Growth (%) Projections by Applications, 2022 to 2032

Figure 89: Europe Market Value (US$ Million) Analysis by Industry, 2017 to 2032

Figure 90: Europe Market Volume (Units) Analysis by Industry, 2017 to 2032

Figure 91: Europe Market Value Share (%) and BPS Analysis by Industry, 2022 to 2032

Figure 92: Europe Market Y-o-Y Growth (%) Projections by Industry, 2022 to 2032

Figure 93: Europe Market Attractiveness by Component, 2022 to 2032

Figure 94: Europe Market Attractiveness by Applications, 2022 to 2032

Figure 95: Europe Market Attractiveness by Industry, 2022 to 2032

Figure 96: Europe Market Attractiveness by Country, 2022 to 2032

Figure 97: Asia Pacific Market Value (US$ Million) by Component, 2022 to 2032

Figure 98: Asia Pacific Market Value (US$ Million) by Applications, 2022 to 2032

Figure 99: Asia Pacific Market Value (US$ Million) by Industry, 2022 to 2032

Figure 100: Asia Pacific Market Value (US$ Million) by Country, 2022 to 2032

Figure 101: Asia Pacific Market Value (US$ Million) Analysis by Country, 2017 to 2032

Figure 102: Asia Pacific Market Volume (Units) Analysis by Country, 2017 to 2032

Figure 103: Asia Pacific Market Value Share (%) and BPS Analysis by Country, 2022 to 2032

Figure 104: Asia Pacific Market Y-o-Y Growth (%) Projections by Country, 2022 to 2032

Figure 105: Asia Pacific Market Value (US$ Million) Analysis by Component, 2017 to 2032

Figure 106: Asia Pacific Market Volume (Units) Analysis by Component, 2017 to 2032

Figure 107: Asia Pacific Market Value Share (%) and BPS Analysis by Component, 2022 to 2032

Figure 108: Asia Pacific Market Y-o-Y Growth (%) Projections by Component, 2022 to 2032

Figure 109: Asia Pacific Market Value (US$ Million) Analysis by Applications, 2017 to 2032

Figure 110: Asia Pacific Market Volume (Units) Analysis by Applications, 2017 to 2032

Figure 111: Asia Pacific Market Value Share (%) and BPS Analysis by Applications, 2022 to 2032

Figure 112: Asia Pacific Market Y-o-Y Growth (%) Projections by Applications, 2022 to 2032

Figure 113: Asia Pacific Market Value (US$ Million) Analysis by Industry, 2017 to 2032

Figure 114: Asia Pacific Market Volume (Units) Analysis by Industry, 2017 to 2032

Figure 115: Asia Pacific Market Value Share (%) and BPS Analysis by Industry, 2022 to 2032

Figure 116: Asia Pacific Market Y-o-Y Growth (%) Projections by Industry, 2022 to 2032

Figure 117: Asia Pacific Market Attractiveness by Component, 2022 to 2032

Figure 118: Asia Pacific Market Attractiveness by Applications, 2022 to 2032

Figure 119: Asia Pacific Market Attractiveness by Industry, 2022 to 2032

Figure 120: Asia Pacific Market Attractiveness by Country, 2022 to 2032

Figure 121: Middle East and Africa Market Value (US$ Million) by Component, 2022 to 2032

Figure 122: Middle East and Africa Market Value (US$ Million) by Applications, 2022 to 2032

Figure 123: Middle East and Africa Market Value (US$ Million) by Industry, 2022 to 2032

Figure 124: Middle East and Africa Market Value (US$ Million) by Country, 2022 to 2032

Figure 125: Middle East and Africa Market Value (US$ Million) Analysis by Country, 2017 to 2032

Figure 126: Middle East and Africa Market Volume (Units) Analysis by Country, 2017 to 2032

Figure 127: Middle East and Africa Market Value Share (%) and BPS Analysis by Country, 2022 to 2032

Figure 128: Middle East and Africa Market Y-o-Y Growth (%) Projections by Country, 2022 to 2032

Figure 129: Middle East and Africa Market Value (US$ Million) Analysis by Component, 2017 to 2032

Figure 130: Middle East and Africa Market Volume (Units) Analysis by Component, 2017 to 2032

Figure 131: Middle East and Africa Market Value Share (%) and BPS Analysis by Component, 2022 to 2032

Figure 132: Middle East and Africa Market Y-o-Y Growth (%) Projections by Component, 2022 to 2032

Figure 133: Middle East and Africa Market Value (US$ Million) Analysis by Applications, 2017 to 2032

Figure 134: Middle East and Africa Market Volume (Units) Analysis by Applications, 2017 to 2032

Figure 135: Middle East and Africa Market Value Share (%) and BPS Analysis by Applications, 2022 to 2032

Figure 136: Middle East and Africa Market Y-o-Y Growth (%) Projections by Applications, 2022 to 2032

Figure 137: Middle East and Africa Market Value (US$ Million) Analysis by Industry, 2017 to 2032

Figure 138: Middle East and Africa Market Volume (Units) Analysis by Industry, 2017 to 2032

Figure 139: Middle East and Africa Market Value Share (%) and BPS Analysis by Industry, 2022 to 2032

Figure 140: Middle East and Africa Market Y-o-Y Growth (%) Projections by Industry, 2022 to 2032

Figure 141: Middle East and Africa Market Attractiveness by Component, 2022 to 2032

Figure 142: Middle East and Africa Market Attractiveness by Applications, 2022 to 2032

Figure 143: Middle East and Africa Market Attractiveness by Industry, 2022 to 2032

Figure 144: Middle East and Africa Market Attractiveness by Country, 2022 to 2032

Recommendations

Technology

Data Center Monitoring Systems Market

Published : March 2023

Explore Technology Insights

View Reports

Wireless Battery Monitoring System Market