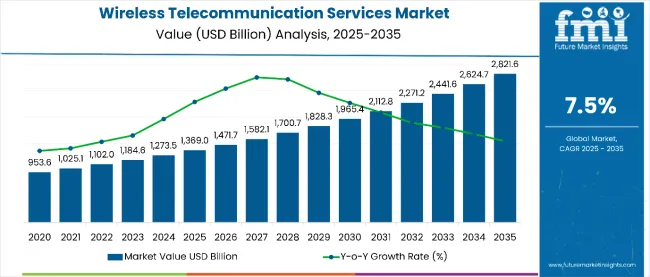
The global wireless telecommunication services market is worth USD 1,369.0 billion in 2025 and anticipated to reach a value of USD 2,821.6 billion by 2035. Demand is projected to rise at a CAGR of 7.5% over the forecast period between 2025 and 2035.
| Attributes | Key Insights |
|---|---|
| Historical Size, 2024 | USD 1,282.7 billion |
| Estimated Size, 2025 | USD 1,369.0 billion |
| Projected Size, 2035 | USD 2,821.6 billion |
| Value-based CAGR (2025 to 2035) | 7.50% |
The wireless telecommunication services that pertain to communication provision using wireless technologies. The market includes a wide range of services that enable people and businesses to communicate and exchange data wirelessly over data wirelessly over radio waves without the need for physical wired connections.
Application of wireless telecommunication services has turned intrinsic in modern civilization whereby voice, data, and multimedia communication have been enabled on varied devices such as smartphones, tablets, laptops, and even IoT devices.
The improvements in technology inclusive of enhanced connectivity and communication capabilities, the wireless telecommunication services market has developed pretty rapidly over the years.
The increased demand for mobile data, IoT connectivity, and digital services expansion across industries fuels the growth of the market. Moreover, as evolving technologies like 5G and others advance, the outlook of the market is very likely to change, bringing in new opportunities and challenges for the industry participants.
Global Wireless Telecommunication Services Industry Assessment
The adoption of the 5G services in wireless telecommunication services market is expected to see accelerated adoption in the next few years, in response to demands for increased data speeds, lower latency, and more reliable networks-all critical in the digital and interconnected world.
Consumers and companies are increasingly adopting advanced technologies such as IoT, augmented reality, and HD video streaming, 5G networks become an imperative strategy for telecommunication companies.
The industry stakeholders will invest in expanding the infrastructure of 5G, sign partnerships, and offer services to get an edge over others. The momentum will continue to push the wireless telecommunication services market into a connected era and a technological innovation era of unprecedented proportions.
Network function virtualization (NFV) and software-defined networking (SDN) are accelerating the modernization of the wireless telecommunication services market, enabling nations to transition from hardware-bound infrastructures to agile, software-defined ecosystems. As 5G deployment scales and edge computing becomes mainstream, virtualization is becoming foundational to competitiveness and service innovation.
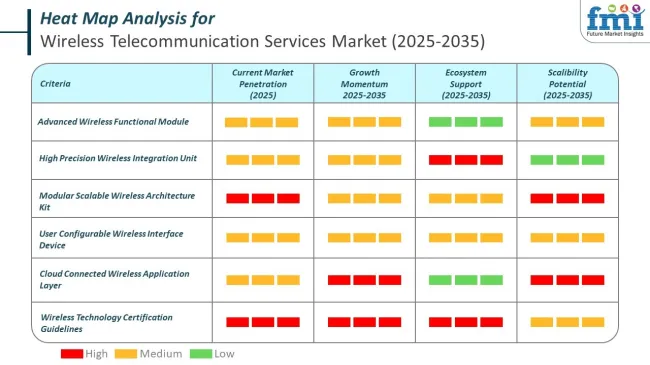
Regulatory shifts, environmental mandates, and spectrum distribution are emerging as defining levers in the wireless telecommunication services market. The world’s largest economies are adopting divergent but equally aggressive strategies to modernize frameworks, accelerate 5G adoption, and meet national policy targets. These actions are redefining competitive positioning and long-term infrastructure viability.
The below table presents the expected CAGR for the global Wireless Telecommunication Services market over several semi-annual periods spanning from 2025 to 2035. In the first half (H1) of the year from 2024 to 2034, the business is predicted to surge at a CAGR of 7.3%, followed by a slightly higher growth rate of 7.5% in the second half (H2) of the same year.
| Particular | Value CAGR |
|---|---|
| H1, 2024 | 6.3% (2024 to 2034) |
| H2, 2024 | 6.5% (2024 to 2034) |
| H1, 2025 | 7.5%(2025 to 2035) |
| H2, 2025 | 7.8% (2025 to 2035) |
Moving into the subsequent period, from H1 2025 to H2 2035, the CAGR is projected to increase slightly to 7.5% in the first half and remain relatively moderate at 7.8% in the second half. In the first half (H1) the market witnessed a decrease of 40 BPS while in the second half (H2), the market witnessed an increase of 30 BPS.
On the basis of subscriber type, the individuals/consumers segment registers 60% share. Wireless telecommunication services are widely used by individuals and consumers because they offer convenience, mobility, and instant connectivity.
People can make calls, send messages, access the internet, and use various apps anytime and anywhere without being tied to physical cables. These services support essential daily activities such as social networking, online shopping, remote work, mobile banking, and entertainment.
With the rise of smartphones and smart devices, consumers rely heavily on wireless networks for staying connected, informed, and productive. Additionally, wireless services are often more accessible and easier to set up than wired alternatives, making them the preferred choice for personal use. Their flexibility and widespread coverage have made wireless communication an essential part of modern life.
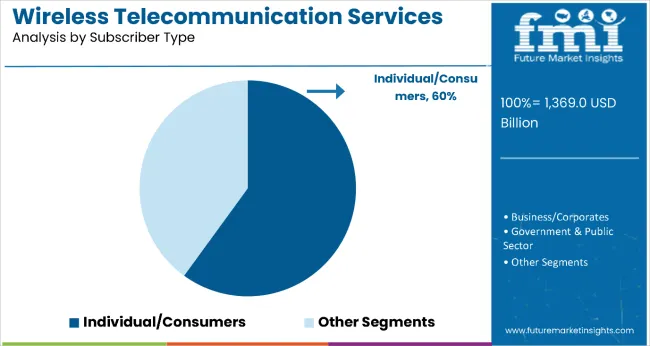
| Service Type | Share (2025) |
|---|---|
| Individuals/Consumers | 60% |
On the basis of technology, the 5G segment accounts for 50% share. 5G technology is popular for wireless telecommunication services because it offers significantly faster data speeds, lower latency, and higher network capacity compared to previous generations.
These improvements enable smoother streaming, faster downloads, and real-time responsiveness, which are essential for applications like video conferencing, online gaming, and remote work. 5G also supports a massive number of connected devices, making it ideal for growing technologies such as the Internet of Things (IoT), smart cities, and autonomous vehicles.
Its enhanced reliability and speed improve user experience and open doors for innovation in industries like healthcare, manufacturing, and transportation. As demand for high-performance connectivity increases, 5G has become the preferred solution for modern, efficient, and future-ready wireless communication.
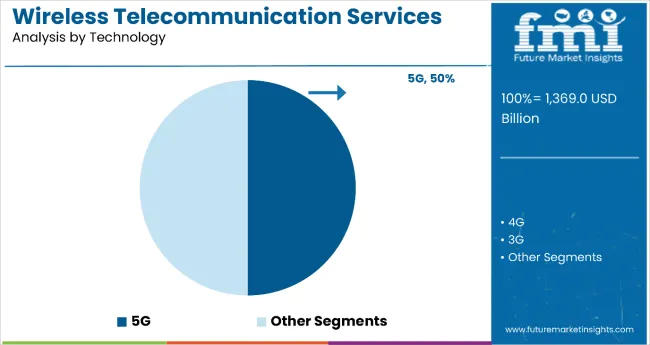
| Technology | Share (2025) |
|---|---|
| 5G | 50% |
5G technology should be a major driver for this sector. 5G is the future of connectivity-everyone, everything, and anything connected at unprecedented speeds, with very low latency and massive capacity.
It means IoT devices and smart cities, immersive augmented and virtual realities, will change the game not only by meeting the growing consumer demand for faster and more reliable connections but also by enabling new business models and even industries that barely existed a few years ago.
With the rapid deployment of 5G networks in full force, wireless telecommunications service providers are now at an advantageous juncture to reap some economic benefits from the opportunities that this next-generation technology promises to offer while it rethinks the ways of communication and connectivity in the digital world.
5G will usher in innovative possibilities for the wireless telecommunication services market with super-fast bandwidth, extremely low latency, and the ability to connect billions of devices. Given its power to improve real-time communication, allow innovative applications such as driverless vehicles and remote medical treatments, and permit smooth data interchange, it is bound to increase demand for enhanced services.
This, therefore, bodes well for the increased service offerings and share of wireless telecommunications firms in the market, who have their sectors optimize processes and build creative solutions using the 5G capabilities. Early movers are likely to emerge as leaders in the supply of cutting-edge connectivity solutions as the scramble for solid 5G infrastructure takes shape and defines the competitive landscape.
Wireless telecommunication industry is equipped for notable growth for the demand for data and connectivity. Improved dependence on connected devices, including smartphones and tablets, has resulted in an unprecedented surge in data consumption. All these factors of video streaming, social media engagement, online gaming, and the IoT landscape drive this demand.
The seamless and high-speed need for data transmission has become of ultimate importance as the global population becomes more digitally connected. This again has spurred providers into a race of expanding their networks, enriching infrastructure, and deploying advanced technologies like 5G. 5G technology features higher data speed, lower latency, and the ability to connect several devices simultaneously, drawing more interest from consumers and organizations.
Growing remote work, cloud-based backup services, and data-intensive applications make wireless access very important in the corporate sector. The importance of wireless networks is growing each day, from enterprise communication and operations to real-time decision-making.
This is in line with the increasing trend of data consumption and need for connectivity, opening ways for new innovation, competition, and investment. Companies offering excellent user experiences, faultless connectivity, and innovative service packaging will successfully perform in this growth industry. The wireless telecommunication services industry would be well-placed to remain advancing from the robust demand for wireless communication services throughout the smart cities.
These cities incorporate digital technologies, data-driven solutions and advanced physical infrastructure aimed at improving the eminence of life of the citizens and operative resource management.
In this regard, the demand for wireless communication services is highly important in the exchange of real-time data among interconnected devices and systems, such as smart traffic management systems, efficient energy utilities, and intelligent public safety systems. The growth of Internet of Things devices that require pervasive connectivity also depends on wireless telecommunication services.
In addition, the development of making cities intelligent with the help of governments and urban planners is expected to spur the demand for high-end wireless communication solutions.
Therefore, present a novelty opportunity for wireless service providers to offer tailored connectivity solutions for various vertical markets, including 5G networks, edge computing capability, and seamless integration of emerging technologies such as artificial intelligence and block chain.
Wireless telecommunication services are competitive with a large number of service providers, constant technological evolution and ever-changing consumer expectations. The more saturated the market gets, the greater the need for differentiation, which often puts pressure on providing differentiated services, pricing models and customer experiences.
These forces companies to invest extremely in research and development to sustain their relevance and maintain competitiveness, which might obstacle the profitability.
The changes in consumer expectation are also fast-evolving; the infrastructure investments related to these changes are pretty high. The competition only intensifies with the entry of non-traditional players from adjacent industries, usually with disruptive business models and considerable resources. The price competition is forcing pressure, too, as services become increasingly commoditized, profit margins shrink, and, as a result, make it tough to invest in network expansion and enhancement of quality.
With these challenges at play, companies will need to zero in on strategies for differentiation, investments in upgrades in network infrastructure, emerging technologies, and tuning into the evolving needs of consumers
The global wireless telecommunication services industry recorded a CAGR of 6.2% during the historical period between 2020 and 2024. The growth of Wireless Telecommunication Services industry share was positive as it reached a value of USD 1,282.7 billion in 2024 from USD 1,026.4 billion in 2020.
Within the period from 2020 to 2024, the global market for wireless telecommunication services entered an extremely sharp growth phase, underpinning growing utilization of advanced communication systems and more significant phased array antennas deployment into defense and aerospace. The technological advancements and increased demand for RF signal control have continuously driven the demand in the market.
The global wireless telecommunication services industry recorded a CAGR of 7.5% during the forecast period between 2025 and 2035. The growth of Wireless Telecommunication Services industry was positive as it reached a value of USD 1,369.0 billion in 2025 from USD 2,821.6 billion in 2035.
This market is expected to grow a great deal in demand from 2025 to 2035. Reasons may be the 5G networks around the world, the IoT devices popping up everywhere, and new breakthroughs in satellite technology. Also, new usages in car radar systems and smart antennas will expand the market. The above factors ensure extreme growth in the industry in the next decade.
Tier 1: The leading telecom infrastructure providers and global tech giants head the wireless services ecosystem, driven by highly extended 5G networks along with cloud infrastructure solutions. This tier would, therefore, be constituted of Cisco Systems, Nokia, Huawei, Ericsson, Google, IBM, Microsoft, and Siemens AG, given that they remain leading vendors within networking, data management, and telecommunication solutions.
The Tier 2 companies in manufacturing semiconductors, IoT, and sensor technologies extend the wireless industry by providing crucial components of hardware. Suppliers in this tier include Texas Instruments, Broadcom Inc., NXP Semiconductors, STMicroelectronics, Infineon Technologies, TDK Corp., TE Connectivity, and Sensata Technologies.
Tier 3: Providing high value-added services related to niche applications, sensor manufacturing, and industrial automation. These aid the indirect contribution toward telecommunication services: Bosch Sensortec, Honeywell International Inc., Omron Corporation, General Electric, Monnit Corporation, and Broadcom Inc. provide for specific IoT and sensor solutions pertaining to wireless connectivity.
The section below covers the industry analysis for the wireless telecommunication services market for different countries. The market demand analysis on key countries in several countries of the globe, including USA, Germany, Italy, China and India are provided.
The united states are expected to remains at the forefront in North America, with a value share of 62.5% in 2025. In East Asia, china is projected to witness a CAGR of 9.2% during the forecasted period.
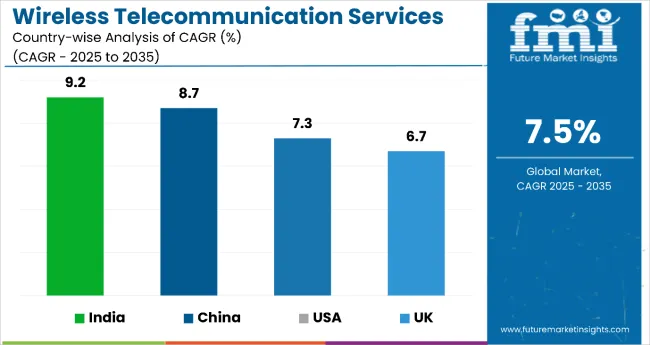
| Country | Value CAGR (2025 to 2035) |
|---|---|
| USA | 7.3% |
| Germany | 5.2% |
| China | 8.7% |
| UK | 6.7% |
| India | 9.2% |
The USA wireless telecommunication services market is witnessing rapid growth owing to mass deployment of 5G networks all over the country. Major players such as Verizon, AT&T, and T-Mobile are heavily building up the infrastructure of 5G platforms, which are expected to provide ultra-high speeds both for consumers and business enterprises. Advanced wireless services have also seen demand in the growth of IoT, smart homes, and other applications in autonomous vehicles.
Further, the strong regulatory environment and friendly policies concerning the spectrum auctions have aided these USA companies in aggressively expanding their services. Other growth factors include supportive policies by the USA government for rural broadband expansion that helps bridge gaps concerning network coverage and access in remote areas.
India is one of the fastest-growing markets in the world when it concerns wireless telecommunication services because of its huge population, fast urbanization rate, and increasing mobile penetration. It houses over 1.4 billion people, and the demand for affordable and fast mobile internet is also very high with the access of smartphones.
Aggressive 4G network rollout and upcoming 5G deployment by key players such as Reliance Jio, Airtel, and Vodafone Idea boost the market further. The most significant growth contribution was from the government's Digital India initiative, oriented at upgrading internet connectivity across villages and cities.
Besides, India's movement towards mobile-first internet access, boosted by low-priced data packages and rapid growth in digital payments, e-commerce, and entertainment apps, has further flourished the wireless telecom industry. It has been an international leader in wireless telecommunication services, driven by the early adoption and expansion of 5G technology.
One of the largest and most advanced 5G networks in the world is in the china, with the country being home to foremost telecom giants such as Huawei, China Mobile, and China Telecom. Chinese government's strategic focus to become a world leader in 5G and smart technology has helped to facilitate the rapid development of the infrastructure, hence pushing further toward IoT, Smart Cities, and Industrial Automation.
Other major drivers will be China's huge smartphone user base and, importantly, an increasing demand for high-speed internet across verticals, such as healthcare, manufacturing, and education. This is considered to be further enhancing market growth in China, with the integration of wireless services with emerging technologies such as artificial intelligence and cloud.
The wireless telecommunication services market has a mix of big industry players and smaller focused companies. Leaders names like Bosch Sensortec, Texas Instruments, Honeywell International Inc., TDK Corp., TE Connectivity, Broadcom Inc. and others. They have an edge because of their wide range of products, cutting-edge tech skills, and strong worldwide sales networks.
In terms of Service Type, the industry is segregated into Data/Internet Services, Fixed Voice Services & Messaging, Telecom Managed Services and Cloud Services.
In terms of Technology, is distributed into 3G, 4G and 5G.
In terms of Subscriber Type is distributed Individual/Consumers, Business/Corporates and Government & Public Sector.
In terms of End-use Industry is distributed BFSI, Healthcare & Pharmaceuticals, Retail & eCommerce, IT & Telecom, Travel & Hospitality, Government and Others
Key countries of North America, Latin America, Western Europe, Eastern Europe, East Asia, South Asia & pacific, Middle East and Africa (MEA) have been covered in the report.
The global wireless telecommunication services industry is projected to witness CAGR of 7.5% between 2025 and 2035.
The global wireless telecommunication services industry stood at USD 1,282.7 billion in 2024.
The global wireless telecommunication services industry is anticipated to reach USD 2,821.6 billion by 2035 end.
East Asia is set to record the highest CAGR of 8.7% in the assessment period.
The key players operating in the global wireless telecommunication services industry include Bosch Sensortec, Texas Instruments, Honeywell International Inc., TDK Corp., TE Connectivity, Broadcom Inc., NXP Semiconductors, STMicroelectronics and others.
Table 1: Global Market Value (US$ Million) Forecast by Region, 2017 to 2032
Table 2: Global Market Value (US$ Million) Forecast by Service Type, 2017 to 2032
Table 3: Global Market Value (US$ Million) Forecast by Application, 2017 to 2032
Table 4: North America Market Value (US$ Million) Forecast by Country, 2017 to 2032
Table 5: North America Market Value (US$ Million) Forecast by Service Type, 2017 to 2032
Table 6: North America Market Value (US$ Million) Forecast by Application, 2017 to 2032
Table 7: Latin America Market Value (US$ Million) Forecast by Country, 2017 to 2032
Table 8: Latin America Market Value (US$ Million) Forecast by Service Type, 2017 to 2032
Table 9: Latin America Market Value (US$ Million) Forecast by Application, 2017 to 2032
Table 10: Europe Market Value (US$ Million) Forecast by Country, 2017 to 2032
Table 11: Europe Market Value (US$ Million) Forecast by Service Type, 2017 to 2032
Table 12: Europe Market Value (US$ Million) Forecast by Application, 2017 to 2032
Table 13: Asia Pacific Market Value (US$ Million) Forecast by Country, 2017 to 2032
Table 14: Asia Pacific Market Value (US$ Million) Forecast by Service Type, 2017 to 2032
Table 15: Asia Pacific Market Value (US$ Million) Forecast by Application, 2017 to 2032
Table 16: Middle East and Africa Market Value (US$ Million) Forecast by Country, 2017 to 2032
Table 17: Middle East and Africa Market Value (US$ Million) Forecast by Service Type, 2017 to 2032
Table 18: Middle East and Africa Market Value (US$ Million) Forecast by Application, 2017 to 2032
Figure 1: Global Market Value (US$ Million) by Service Type, 2022 to 2032
Figure 2: Global Market Value (US$ Million) by Application, 2022 to 2032
Figure 3: Global Market Value (US$ Million) by Region, 2022 to 2032
Figure 4: Global Market Value (US$ Million) Analysis by Region, 2017 to 2032
Figure 5: Global Market Value Share (%) and BPS Analysis by Region, 2022 to 2032
Figure 6: Global Market Y-o-Y Growth (%) Projections by Region, 2022 to 2032
Figure 7: Global Market Value (US$ Million) Analysis by Service Type, 2017 to 2032
Figure 8: Global Market Value Share (%) and BPS Analysis by Service Type, 2022 to 2032
Figure 9: Global Market Y-o-Y Growth (%) Projections by Service Type, 2022 to 2032
Figure 10: Global Market Value (US$ Million) Analysis by Application, 2017 to 2032
Figure 11: Global Market Value Share (%) and BPS Analysis by Application, 2022 to 2032
Figure 12: Global Market Y-o-Y Growth (%) Projections by Application, 2022 to 2032
Figure 13: Global Market Attractiveness by Service Type, 2022 to 2032
Figure 14: Global Market Attractiveness by Application, 2022 to 2032
Figure 15: Global Market Attractiveness by Region, 2022 to 2032
Figure 16: North America Market Value (US$ Million) by Service Type, 2022 to 2032
Figure 17: North America Market Value (US$ Million) by Application, 2022 to 2032
Figure 18: North America Market Value (US$ Million) by Country, 2022 to 2032
Figure 19: North America Market Value (US$ Million) Analysis by Country, 2017 to 2032
Figure 20: North America Market Value Share (%) and BPS Analysis by Country, 2022 to 2032
Figure 21: North America Market Y-o-Y Growth (%) Projections by Country, 2022 to 2032
Figure 22: North America Market Value (US$ Million) Analysis by Service Type, 2017 to 2032
Figure 23: North America Market Value Share (%) and BPS Analysis by Service Type, 2022 to 2032
Figure 24: North America Market Y-o-Y Growth (%) Projections by Service Type, 2022 to 2032
Figure 25: North America Market Value (US$ Million) Analysis by Application, 2017 to 2032
Figure 26: North America Market Value Share (%) and BPS Analysis by Application, 2022 to 2032
Figure 27: North America Market Y-o-Y Growth (%) Projections by Application, 2022 to 2032
Figure 28: North America Market Attractiveness by Service Type, 2022 to 2032
Figure 29: North America Market Attractiveness by Application, 2022 to 2032
Figure 30: North America Market Attractiveness by Country, 2022 to 2032
Figure 31: Latin America Market Value (US$ Million) by Service Type, 2022 to 2032
Figure 32: Latin America Market Value (US$ Million) by Application, 2022 to 2032
Figure 33: Latin America Market Value (US$ Million) by Country, 2022 to 2032
Figure 34: Latin America Market Value (US$ Million) Analysis by Country, 2017 to 2032
Figure 35: Latin America Market Value Share (%) and BPS Analysis by Country, 2022 to 2032
Figure 36: Latin America Market Y-o-Y Growth (%) Projections by Country, 2022 to 2032
Figure 37: Latin America Market Value (US$ Million) Analysis by Service Type, 2017 to 2032
Figure 38: Latin America Market Value Share (%) and BPS Analysis by Service Type, 2022 to 2032
Figure 39: Latin America Market Y-o-Y Growth (%) Projections by Service Type, 2022 to 2032
Figure 40: Latin America Market Value (US$ Million) Analysis by Application, 2017 to 2032
Figure 41: Latin America Market Value Share (%) and BPS Analysis by Application, 2022 to 2032
Figure 42: Latin America Market Y-o-Y Growth (%) Projections by Application, 2022 to 2032
Figure 43: Latin America Market Attractiveness by Service Type, 2022 to 2032
Figure 44: Latin America Market Attractiveness by Application, 2022 to 2032
Figure 45: Latin America Market Attractiveness by Country, 2022 to 2032
Figure 46: Europe Market Value (US$ Million) by Service Type, 2022 to 2032
Figure 47: Europe Market Value (US$ Million) by Application, 2022 to 2032
Figure 48: Europe Market Value (US$ Million) by Country, 2022 to 2032
Figure 49: Europe Market Value (US$ Million) Analysis by Country, 2017 to 2032
Figure 50: Europe Market Value Share (%) and BPS Analysis by Country, 2022 to 2032
Figure 51: Europe Market Y-o-Y Growth (%) Projections by Country, 2022 to 2032
Figure 52: Europe Market Value (US$ Million) Analysis by Service Type, 2017 to 2032
Figure 53: Europe Market Value Share (%) and BPS Analysis by Service Type, 2022 to 2032
Figure 54: Europe Market Y-o-Y Growth (%) Projections by Service Type, 2022 to 2032
Figure 55: Europe Market Value (US$ Million) Analysis by Application, 2017 to 2032
Figure 56: Europe Market Value Share (%) and BPS Analysis by Application, 2022 to 2032
Figure 57: Europe Market Y-o-Y Growth (%) Projections by Application, 2022 to 2032
Figure 58: Europe Market Attractiveness by Service Type, 2022 to 2032
Figure 59: Europe Market Attractiveness by Application, 2022 to 2032
Figure 60: Europe Market Attractiveness by Country, 2022 to 2032
Figure 61: Asia Pacific Market Value (US$ Million) by Service Type, 2022 to 2032
Figure 62: Asia Pacific Market Value (US$ Million) by Application, 2022 to 2032
Figure 63: Asia Pacific Market Value (US$ Million) by Country, 2022 to 2032
Figure 64: Asia Pacific Market Value (US$ Million) Analysis by Country, 2017 to 2032
Figure 65: Asia Pacific Market Value Share (%) and BPS Analysis by Country, 2022 to 2032
Figure 66: Asia Pacific Market Y-o-Y Growth (%) Projections by Country, 2022 to 2032
Figure 67: Asia Pacific Market Value (US$ Million) Analysis by Service Type, 2017 to 2032
Figure 68: Asia Pacific Market Value Share (%) and BPS Analysis by Service Type, 2022 to 2032
Figure 69: Asia Pacific Market Y-o-Y Growth (%) Projections by Service Type, 2022 to 2032
Figure 70: Asia Pacific Market Value (US$ Million) Analysis by Application, 2017 to 2032
Figure 71: Asia Pacific Market Value Share (%) and BPS Analysis by Application, 2022 to 2032
Figure 72: Asia Pacific Market Y-o-Y Growth (%) Projections by Application, 2022 to 2032
Figure 73: Asia Pacific Market Attractiveness by Service Type, 2022 to 2032
Figure 74: Asia Pacific Market Attractiveness by Application, 2022 to 2032
Figure 75: Asia Pacific Market Attractiveness by Country, 2022 to 2032
Figure 76: Middle East and Africa Market Value (US$ Million) by Service Type, 2022 to 2032
Figure 77: Middle East and Africa Market Value (US$ Million) by Application, 2022 to 2032
Figure 78: Middle East and Africa Market Value (US$ Million) by Country, 2022 to 2032
Figure 79: Middle East and Africa Market Value (US$ Million) Analysis by Country, 2017 to 2032
Figure 80: Middle East and Africa Market Value Share (%) and BPS Analysis by Country, 2022 to 2032
Figure 81: Middle East and Africa Market Y-o-Y Growth (%) Projections by Country, 2022 to 2032
Figure 82: Middle East and Africa Market Value (US$ Million) Analysis by Service Type, 2017 to 2032
Figure 83: Middle East and Africa Market Value Share (%) and BPS Analysis by Service Type, 2022 to 2032
Figure 84: Middle East and Africa Market Y-o-Y Growth (%) Projections by Service Type, 2022 to 2032
Figure 85: Middle East and Africa Market Value (US$ Million) Analysis by Application, 2017 to 2032
Figure 86: Middle East and Africa Market Value Share (%) and BPS Analysis by Application, 2022 to 2032
Figure 87: Middle East and Africa Market Y-o-Y Growth (%) Projections by Application, 2022 to 2032
Figure 88: Middle East and Africa Market Attractiveness by Service Type, 2022 to 2032
Figure 89: Middle East and Africa Market Attractiveness by Application, 2022 to 2032
Figure 90: Middle East and Africa Market Attractiveness by Country, 2022 to 2032


Full Research Suite comprises of:
Market outlook & trends analysis
Interviews & case studies
Strategic recommendations
Vendor profiles & capabilities analysis
5-year forecasts
8 regions and 60+ country-level data splits
Market segment data splits
12 months of continuous data updates
DELIVERED AS:
PDF EXCEL ONLINE
Assessing Wireless Telecommunication Services Market Share & Industry Trends
UK Wireless Telecommunication Services Market Insights – Growth & Demand 2025-2035
USA Wireless Telecommunication Services Market Growth – Trends, Demand & Forecast 2025-2035
Japan Wireless Telecommunication Services Market Insights – Demand, Growth & Forecast 2025-2035
Germany Wireless Telecommunication Services Market Analysis – Size, Growth & Forecast 2025-2035
GCC Countries Wireless Telecommunication Services Market Trends – Growth, Demand & Forecast 2025-2035
Wireless EEG Monitoring System Market Size and Share Forecast Outlook 2025 to 2035
Wireless Refrigerant Charging Scale Market Size and Share Forecast Outlook 2025 to 2035
Wireless Hydrometer Market Size and Share Forecast Outlook 2025 to 2035
Wireless HDMI Transmitter and Receiver Market Size and Share Forecast Outlook 2025 to 2035
Wireless Access Point Market Size and Share Forecast Outlook 2025 to 2035
Wireless Video - 2.4/5GHz Market Size and Share Forecast Outlook 2025 to 2035
Wireless Polysomnography Market Size and Share Forecast Outlook 2025 to 2035
Wireless Audio Devices Market Size and Share Forecast Outlook 2025 to 2035
Wireless Communication Technologies In Healthcare Market Size and Share Forecast Outlook 2025 to 2035
Wireless Mesh Network Market Size and Share Forecast Outlook 2025 to 2035
Wireless Sensor Tags Market Size and Share Forecast Outlook 2025 to 2035
Wireless Sensor Network Market Size and Share Forecast Outlook 2025 to 2035
Wireless Power Transmission Market Size and Share Forecast Outlook 2025 to 2035
Wireless Home Security Camera Market Size and Share Forecast Outlook 2025 to 2035

Thank you!
You will receive an email from our Business Development Manager. Please be sure to check your SPAM/JUNK folder too.
Chat With
MaRIA