Reports

- Global Locations -

Headquarters

Future Market Insights, Inc.

Christiana Corporate, 200
Continental Drive, Suite 401,
Newark, Delaware - 19713,
United States

T: +1-845-579-5705

Americas

Future Market Insights, Inc.

616 Corporate Way, Suite 2-9018,
Valley Cottage, NY 10989, United States

T: +1-347-918-3531

MEA

Future Market Insights

1602-6 Jumeirah Bay X2 Tower, Plot No: JLT-PH2-X2A,
Jumeirah Lakes Towers, Dubai,
United Arab Emirates

Europe

Future Market Insights

3rd Floor, 207 Regent Street,
W1B 3HH London
United Kingdom

T: + 44 (0) 20 8123 9659
D: +44 (0) 20 3287 4268

Asia Pacific

Future Market Insights

IndiaLand Global Tech Park, Unit UG-1, Behind Grand HighStreet, Phase 1, Hinjawadi, MH, Pune – 411057, India

Wireless Access Point Market Outlook (2022-2032)

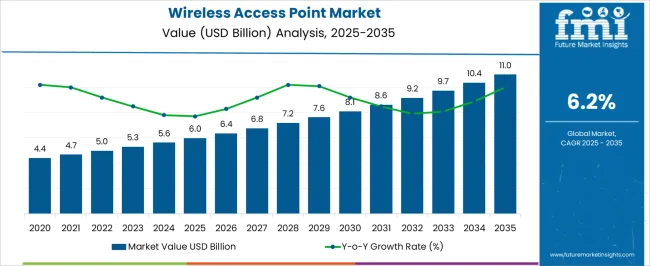
[342 Pages Report] The wireless access point market, which is valued at US$ 4559 million as on 2022, is anticipated to be valued at US$ 8226 million in 2032 and is expected to grow at a CAGR of 6.1% during the forecast period.

Owing to an increase in the number of connected devices in offices, homes, and public places, and many other factors, the sales of wireless access point is expected to increase in the future.

Report Attribute Details
Wireless Access Point Market Valuation as on 2022 US$ 4559 million
Wireless Access Point Market Anticipated Forecast Value (2032) US$ 8226 million
Wireless Access Point Market Projected Growth Rate (2022-2032) 6.1%

The surge in the demand for wireless access point is also attributed to the fact that these can be installed easily in networks in any place, and not much technical expertise is required for their installation.

Moreover, the wireless access point also has an amazing ability to act as a transceiver. It receives the signals from the router and transmits the signal to other devices. This is something which might increase the adoption of wireless access point.

The surge in the sales of wireless access points can also be predicted from the fact that previously, the CAGR for this market was 5.6%. But, with anticipated increase in the usage of wireless point, the CAGR for the forecast period is predicted to be 6.1%.

Don't pay for what you don't need

Customize your report by selecting specific countries or regions and save 30%!

What are the Current Market Dynamics pertaining to Wireless Access Point Market?

Wireless access points allow people, especially employees within an organisation to remain connected to the internet, and provide them the flexibility to access the internet from anywhere within the office premises, irrespective of the size of the office. This is something which is expected to increase the demand for wireless access point.

Moreover, the wireless access points have the ability to handle many devices at a single time, as compared to range extenders, which can’t handle more than 20 devices at a times. Thus, if the access points are installed in the premises of the building, it allows seamless transition from one access point to another for accessing the internet. This is expected to increase the sales of wireless access point.

The layout while installing wireless access point remains simple. Therefore, even if we connect wireless access points with PoE+, which is a combination of ethernet and power cord, there is no need to install an outlet near the access point. This is expected to increase the demand for wireless access point.

The surge in the adoption of wireless access point can also be attributed to the fact that these contain Access Control List (ACL), where we can limit the guest access without compromising on the network security, and managing users within the wi-fi range.

Certain access points are equipped with clustering feature, which is a single point from where the IT administrator can view, deploy, secure and configure wi-fi network as a single entity instead of a series of separate access points. This is anticipated to boost the wireless access point market share.

Increase in the application of cloud computing is expected to increase the wireless access point market size.

Additionally rising application of VoIP across several sectors is also expected to increase the adoption of wireless access point.

However, because of the number of benefits a wireless access point offers, the cost of installation is higher as compared to a wireless router. But it is important to note here that the amount that is invested for the wireless access points is worth every penny.

Regional Analysis

How is the Performance of North American Wireless Access Point Market?

North America, which currently has a market share of 27.9%, is expected to be one of the largest markets for the wireless access point.

A rapid increase in the IT and IoT sector is expected to drive the adoption of wireless access point. Moreover, the companies as well in this region are willing to invest specifically on the wireless access point for the number of benefits they offer.

How is the Performance of European Wireless Access Point Market?

Europe, which currently has a market share of 19.3%, is expected to be a significant market for wireless access point.

Apart from the industries and the benefits, the main reason why wireless access point market is expected to grow in this region is because of the security it provides. The architecture of the entire connection is quite robust, and it is not possible for the hackers to break into the system.

Sudip Saha
Sudip Saha

Principal Consultant

Talk to Analyst

Find your sweet spots for generating winning opportunities in this market.

How is the Start Up Ecosystem in the Wireless Access Point Market?

With more and more emphasis being laid on security, and growth of IT related industries, the start up space of the wireless access point market is dynamic, and looking for ways to improve the wi-fi connectivity.

Some of the notable start-ups are Mimosa, Wi-Fi Dabba, and Zunpai Communication Technology. These start-ups are majorly focusing on testing giga-bit tier fixed wireless services using frequencies which have almost 6 GHz spectrum at a distance of more than 3 miles, and the testing is carried out in real world scenario instead of being carried out in simulation.

This will help deliver fiber quality services using wireless means in rural areas.

Who are Some of the Key Market Players in the Wireless Access Point Market?

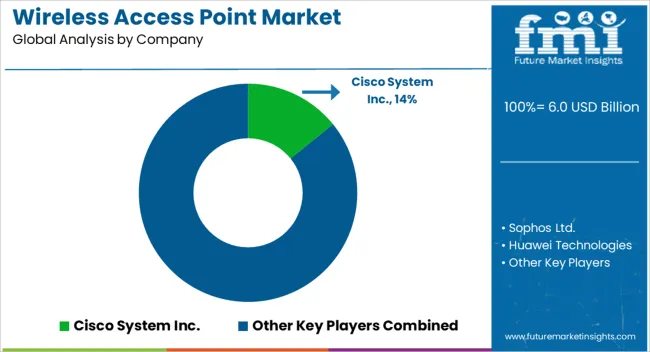
Some of the key players in the wireless access point market are: Sophos Ltd., Huawei Technologies, Cisco System Inc., Avaya Inc., Aerohive networks, Netgear Inc., Zyxel Communications Corp., Oberon Inc., and Kontron AG.

By modernising their communications, the key players are implementing open, collaborative, and secure communications environment across various departments in certain cities, thereby ensuring those cities quickly adjust to keep pace with rapid changes, and ensuring that the costs are cut and the productivity increases.

  • In February 2022, Oberon released Version 2.0 of Web-Based authoring and review tools making collaboration easier with SMEs.
  • In January 2022, Zyxel communications announced that it would be joining Open Networking Foundation aligning with projects focused on broadband transformation.

Get the data you need at a Fraction of the cost

Personalize your report by choosing insights you need
and save 40%!

Report Scope

Report Attribute Details
Growth Rate CAGR of 6.1% from 2022 to 2032
Base Year for Estimation 2021
Historical Data 2015-2021
Forecast Period 2022-2032
Quantitative Units Revenue in USD Million and CAGR from 2022-2032
Report Coverage Revenue Forecast, Volume Forecast, Company Ranking, Competitive Landscape, Growth Factors, Trends and Pricing Analysis
Segments Covered
  • Deployment
  • Services
  • End User
  • Data Standard
  • Region
Regions Covered
  • North America
  • Latin America
  • Europe
  • East Asia
  • South Asia
  • Oceania
  • Middle East and Africa
Key Countries Profiled
  • USA
  • Canada
  • Brazil
  • Argentina
  • Germany
  • UK
  • France
  • Spain
  • Italy
  • Nordics
  • BENELUX
  • Australia & New Zealand
  • China
  • India
  • ASEAN
  • GCC
  • South Africa
Key Companies Profiled
  • Sophos Ltd.
  • Huawei Technologies
  • Cisco System Inc.
  • Avaya Inc.
  • Aerohive networks
  • Netgear Inc.
  • Zyxel Communications Corp.
  • Oberon Inc.
  • Kontron AG.
Customization Available Upon Request

Key Segments Profiled in the Wireless Access Point Market Survey

By Deployment:

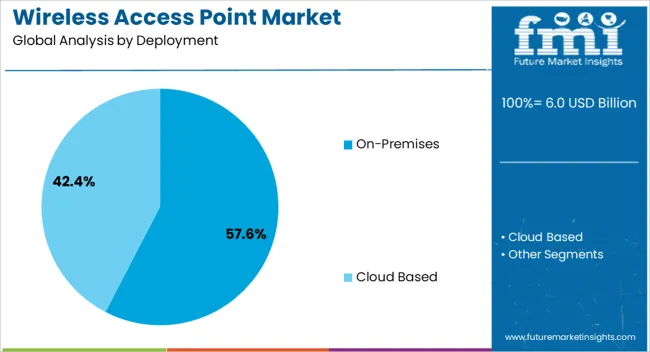
  • On-Premises
  • Cloud Based

By Services:

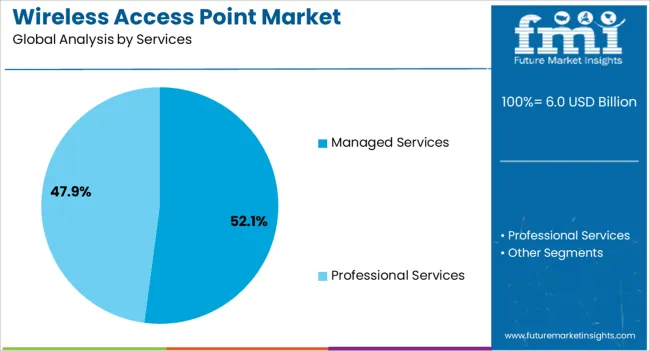
  • Managed Services
  • Professional Services

By End User:

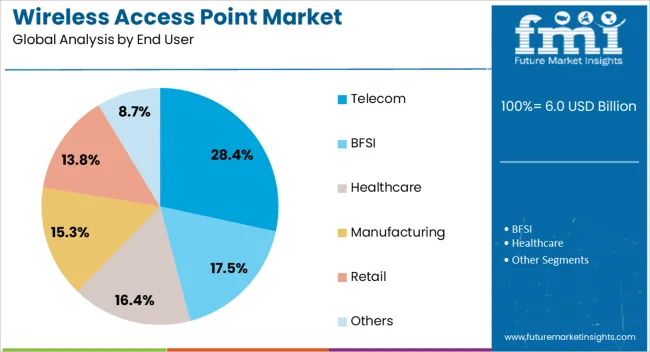
  • BFSI
  • Healthcare
  • Manufacturing
  • Telecom
  • Retail
  • Others

By Data Standard:

  • 802.11n
  • 802.11ac
  • 802.11a/b/g

By Region:

  • North America
  • Latin America
  • Europe
  • East Asia
  • South Asia
  • Oceania
  • Middle East and Africa

Frequently Asked Questions

What is the Growth Outlook for the Wireless Access Point Market?

The wireless access point market is projected to grow at a CAGR of 6.1% during the forecast period (2022-2032).

What is the Valuation of Wireless Access Point Market as on 2022?

The wireless access point market has a valuation of US$ 4559 million as on 2022.

What is the Expected Valuation of Wireless Access Point Market in 2032?

The wireless access point market is expected to be valued US$ 8226 million in 2032.

Table of Content

1. Executive Summary

    1.1. Global Market Outlook

    1.2. Demand-side Trends

    1.3. Supply-side Trends

    1.4. Technology Roadmap Analysis

    1.5. Analysis and Recommendations

2. Market Overview

    2.1. Market Coverage / Taxonomy

    2.2. Market Definition / Scope / Limitations

3. Market Background

    3.1. Market Dynamics

        3.1.1. Drivers

        3.1.2. Restraints

        3.1.3. Opportunity

        3.1.4. Trends

    3.2. Scenario Forecast

        3.2.1. Demand in Optimistic Scenario

        3.2.2. Demand in Likely Scenario

        3.2.3. Demand in Conservative Scenario

    3.3. Opportunity Map Analysis

    3.4. Investment Feasibility Matrix

    3.5. PESTLE and Porter’s Analysis

    3.6. Regulatory Landscape

        3.6.1. By Key Regions

        3.6.2. By Key Countries

    3.7. Regional Parent Market Outlook

4. Global Wireless Access Point Market Analysis 2017-2021 and Forecast, 2022-2032

    4.1. Historical Market Size Value (US$ Mn) Analysis, 2017-2021

    4.2. Current and Future Market Size Value (US$ Mn) Projections, 2022-2032

        4.2.1. Y-o-Y Growth Trend Analysis

        4.2.2. Absolute $ Opportunity Analysis

5. Global Wireless Access Point Market Analysis 2017-2021 and Forecast 2022-2032, By Deployment

    5.1. Introduction / Key Findings

    5.2. Historical Market Size Value (US$ Mn) Analysis By Deployment, 2017-2021

    5.3. Current and Future Market Size Value (US$ Mn) Analysis and Forecast By Deployment, 2022-2032

        5.3.1. On-premises

        5.3.2. Cloud-based

    5.4. Y-o-Y Growth Trend Analysis By Deployment, 2017-2021

    5.5. Absolute $ Opportunity Analysis By Deployment, 2022-2032

6. Global Wireless Access Point Market Analysis 2017-2021 and Forecast 2022-2032, By Service

    6.1. Introduction / Key Findings

    6.2. Historical Market Size Value (US$ Mn) Analysis By Service, 2017-2021

    6.3. Current and Future Market Size Value (US$ Mn) Analysis and Forecast By Service, 2022-2032

        6.3.1. Managed Services

        6.3.2. Professional Services

    6.4. Y-o-Y Growth Trend Analysis By Service, 2017-2021

    6.5. Absolute $ Opportunity Analysis By Service, 2022-2032

7. Global Wireless Access Point Market Analysis 2017-2021 and Forecast 2022-2032, By End User

    7.1. Introduction / Key Findings

    7.2. Historical Market Size Value (US$ Mn) Analysis By End User, 2017-2021

    7.3. Current and Future Market Size Value (US$ Mn) Analysis and Forecast By End User, 2022-2032

        7.3.1. BFSI

        7.3.2. Healthcare

        7.3.3. Manufacturing

        7.3.4. Retail

        7.3.5. Telecom

        7.3.6. Others

    7.4. Y-o-Y Growth Trend Analysis By End User, 2017-2021

    7.5. Absolute $ Opportunity Analysis By End User, 2022-2032

8. Global Wireless Access Point Market Analysis 2017-2021 and Forecast 2022-2032, By Region

    8.1. Introduction

    8.2. Historical Market Size Value (US$ Mn) Analysis By Region, 2017-2021

    8.3. Current Market Size Value (US$ Mn) Analysis and Forecast By Region, 2022-2032

        8.3.1. North America

        8.3.2. Latin America

        8.3.3. Europe

        8.3.4. Asia Pacific

        8.3.5. MEA

    8.4. Market Attractiveness Analysis By Region

9. North America Wireless Access Point Market Analysis 2017-2021 and Forecast 2022-2032, By Country

    9.1. Historical Market Size Value (US$ Mn) Trend Analysis By Market Taxonomy, 2017-2021

    9.2. Market Size Value (US$ Mn) Forecast By Market Taxonomy, 2022-2032

        9.2.1. By Country

            9.2.1.1. US

            9.2.1.2. Canada

        9.2.2. By Deployment

        9.2.3. By Service

        9.2.4. By End User

    9.3. Market Attractiveness Analysis

        9.3.1. By Country

        9.3.2. By Deployment

        9.3.3. By Service

        9.3.4. By End User

    9.4. Key Takeaways

10. Latin America Wireless Access Point Market Analysis 2017-2021 and Forecast 2022-2032, By Country

    10.1. Historical Market Size Value (US$ Mn) Trend Analysis By Market Taxonomy, 2017-2021

    10.2. Market Size Value (US$ Mn) Forecast By Market Taxonomy, 2022-2032

        10.2.1. By Country

            10.2.1.1. Brazil

            10.2.1.2. Mexico

            10.2.1.3. Rest of Latin America

        10.2.2. By Deployment

        10.2.3. By Service

        10.2.4. By End User

    10.3. Market Attractiveness Analysis

        10.3.1. By Country

        10.3.2. By Deployment

        10.3.3. By Service

        10.3.4. By End User

    10.4. Key Takeaways

11. Europe Wireless Access Point Market Analysis 2017-2021 and Forecast 2022-2032, By Country

    11.1. Historical Market Size Value (US$ Mn) Trend Analysis By Market Taxonomy, 2017-2021

    11.2. Market Size Value (US$ Mn) Forecast By Market Taxonomy, 2022-2032

        11.2.1. By Country

            11.2.1.1. Germany

            11.2.1.2. U.K.

            11.2.1.3. France

            11.2.1.4. Spain

            11.2.1.5. Italy

            11.2.1.6. Rest of Europe

        11.2.2. By Deployment

        11.2.3. By Service

        11.2.4. By End User

    11.3. Market Attractiveness Analysis

        11.3.1. By Country

        11.3.2. By Deployment

        11.3.3. By Service

        11.3.4. By End User

    11.4. Key Takeaways

12. Asia Pacific Wireless Access Point Market Analysis 2017-2021 and Forecast 2022-2032, By Country

    12.1. Historical Market Size Value (US$ Mn) Trend Analysis By Market Taxonomy, 2017-2021

    12.2. Market Size Value (US$ Mn) Forecast By Market Taxonomy, 2022-2032

        12.2.1. By Country

            12.2.1.1. China

            12.2.1.2. Japan

            12.2.1.3. South Korea

            12.2.1.4. Rest of Asia Pacific

        12.2.2. By Deployment

        12.2.3. By Service

        12.2.4. By End User

    12.3. Market Attractiveness Analysis

        12.3.1. By Country

        12.3.2. By Deployment

        12.3.3. By Service

        12.3.4. By End User

    12.4. Key Takeaways

13. MEA Wireless Access Point Market Analysis 2017-2021 and Forecast 2022-2032, By Country

    13.1. Historical Market Size Value (US$ Mn) Trend Analysis By Market Taxonomy, 2017-2021

    13.2. Market Size Value (US$ Mn) Forecast By Market Taxonomy, 2022-2032

        13.2.1. By Country

            13.2.1.1. GCC Countries

            13.2.1.2. South Africa

            13.2.1.3. Israel

            13.2.1.4. Rest of MEA

        13.2.2. By Deployment

        13.2.3. By Service

        13.2.4. By End User

    13.3. Market Attractiveness Analysis

        13.3.1. By Country

        13.3.2. By Deployment

        13.3.3. By Service

        13.3.4. By End User

    13.4. Key Takeaways

14. Key Countries Wireless Access Point Market Analysis

    14.1. US

        14.1.1. Pricing Analysis

        14.1.2. Market Share Analysis, 2021

            14.1.2.1. By Deployment

            14.1.2.2. By Service

            14.1.2.3. By End User

    14.2. Canada

        14.2.1. Pricing Analysis

        14.2.2. Market Share Analysis, 2021

            14.2.2.1. By Deployment

            14.2.2.2. By Service

            14.2.2.3. By End User

    14.3. Brazil

        14.3.1. Pricing Analysis

        14.3.2. Market Share Analysis, 2021

            14.3.2.1. By Deployment

            14.3.2.2. By Service

            14.3.2.3. By End User

    14.4. Mexico

        14.4.1. Pricing Analysis

        14.4.2. Market Share Analysis, 2021

            14.4.2.1. By Deployment

            14.4.2.2. By Service

            14.4.2.3. By End User

    14.5. Germany

        14.5.1. Pricing Analysis

        14.5.2. Market Share Analysis, 2021

            14.5.2.1. By Deployment

            14.5.2.2. By Service

            14.5.2.3. By End User

    14.6. U.K.

        14.6.1. Pricing Analysis

        14.6.2. Market Share Analysis, 2021

            14.6.2.1. By Deployment

            14.6.2.2. By Service

            14.6.2.3. By End User

    14.7. France

        14.7.1. Pricing Analysis

        14.7.2. Market Share Analysis, 2021

            14.7.2.1. By Deployment

            14.7.2.2. By Service

            14.7.2.3. By End User

    14.8. Spain

        14.8.1. Pricing Analysis

        14.8.2. Market Share Analysis, 2021

            14.8.2.1. By Deployment

            14.8.2.2. By Service

            14.8.2.3. By End User

    14.9. Italy

        14.9.1. Pricing Analysis

        14.9.2. Market Share Analysis, 2021

            14.9.2.1. By Deployment

            14.9.2.2. By Service

            14.9.2.3. By End User

    14.10. China

        14.10.1. Pricing Analysis

        14.10.2. Market Share Analysis, 2021

            14.10.2.1. By Deployment

            14.10.2.2. By Service

            14.10.2.3. By End User

    14.11. Japan

        14.11.1. Pricing Analysis

        14.11.2. Market Share Analysis, 2021

            14.11.2.1. By Deployment

            14.11.2.2. By Service

            14.11.2.3. By End User

    14.12. South Korea

        14.12.1. Pricing Analysis

        14.12.2. Market Share Analysis, 2021

            14.12.2.1. By Deployment

            14.12.2.2. By Service

            14.12.2.3. By End User

    14.13. GCC Countries

        14.13.1. Pricing Analysis

        14.13.2. Market Share Analysis, 2021

            14.13.2.1. By Deployment

            14.13.2.2. By Service

            14.13.2.3. By End User

    14.14. South Africa

        14.14.1. Pricing Analysis

        14.14.2. Market Share Analysis, 2021

            14.14.2.1. By Deployment

            14.14.2.2. By Service

            14.14.2.3. By End User

    14.15. Israel

        14.15.1. Pricing Analysis

        14.15.2. Market Share Analysis, 2021

            14.15.2.1. By Deployment

            14.15.2.2. By Service

            14.15.2.3. By End User

15. Market Structure Analysis

    15.1. Competition Dashboard

    15.2. Competition Benchmarking

    15.3. Market Share Analysis of Top Players

        15.3.1. By Regional

        15.3.2. By Deployment

        15.3.3. By Service

        15.3.4. By End User

16. Competition Analysis

    16.1. Competition Deep Dive

        16.1.1. Sophos Ltd

            16.1.1.1. Overview

            16.1.1.2. Product Portfolio

            16.1.1.3. Profitability by Market Segments

            16.1.1.4. Sales Footprint

            16.1.1.5. Strategy Overview

                16.1.1.5.1. Marketing Strategy

        16.1.2. Cisco System Inc.

            16.1.2.1. Overview

            16.1.2.2. Product Portfolio

            16.1.2.3. Profitability by Market Segments

            16.1.2.4. Sales Footprint

            16.1.2.5. Strategy Overview

                16.1.2.5.1. Marketing Strategy

        16.1.3. Avaya Inc.

            16.1.3.1. Overview

            16.1.3.2. Product Portfolio

            16.1.3.3. Profitability by Market Segments

            16.1.3.4. Sales Footprint

            16.1.3.5. Strategy Overview

                16.1.3.5.1. Marketing Strategy

        16.1.4. Netgear Inc.

            16.1.4.1. Overview

            16.1.4.2. Product Portfolio

            16.1.4.3. Profitability by Market Segments

            16.1.4.4. Sales Footprint

            16.1.4.5. Strategy Overview

                16.1.4.5.1. Marketing Strategy

        16.1.5. Zyxel Communications Corp

            16.1.5.1. Overview

            16.1.5.2. Product Portfolio

            16.1.5.3. Profitability by Market Segments

            16.1.5.4. Sales Footprint

            16.1.5.5. Strategy Overview

                16.1.5.5.1. Marketing Strategy

        16.1.6. Oberon Inc.

            16.1.6.1. Overview

            16.1.6.2. Product Portfolio

            16.1.6.3. Profitability by Market Segments

            16.1.6.4. Sales Footprint

            16.1.6.5. Strategy Overview

                16.1.6.5.1. Marketing Strategy

        16.1.7. Kontron AG

            16.1.7.1. Overview

            16.1.7.2. Product Portfolio

            16.1.7.3. Profitability by Market Segments

            16.1.7.4. Sales Footprint

            16.1.7.5. Strategy Overview

                16.1.7.5.1. Marketing Strategy

17. Assumptions & Acronyms Used

18. Research Methodology

Don't pay for what you don't need

Customize your report by selecting specific countries or regions and save 30%!

List of Tables

Table 1: Global Wireless Access Point Market Value (US$ Mn) Forecast by Region, 2017-2032

Table 2: Global Wireless Access Point Market Value (US$ Mn) Forecast by Deployment, 2017-2032

Table 3: Global Wireless Access Point Market Value (US$ Mn) Forecast by Service, 2017-2032

Table 4: Global Wireless Access Point Market Value (US$ Mn) Forecast by End User, 2017-2032

Table 5: North America Wireless Access Point Market Value (US$ Mn) Forecast by Country, 2017-2032

Table 6: North America Wireless Access Point Market Value (US$ Mn) Forecast by Deployment, 2017-2032

Table 7: North America Wireless Access Point Market Value (US$ Mn) Forecast by Service, 2017-2032

Table 8: North America Wireless Access Point Market Value (US$ Mn) Forecast by End User, 2017-2032

Table 9: Latin America Wireless Access Point Market Value (US$ Mn) Forecast by Country, 2017-2032

Table 10: Latin America Wireless Access Point Market Value (US$ Mn) Forecast by Deployment, 2017-2032

Table 11: Latin America Wireless Access Point Market Value (US$ Mn) Forecast by Service, 2017-2032

Table 12: Latin America Wireless Access Point Market Value (US$ Mn) Forecast by End User, 2017-2032

Table 13: Europe Wireless Access Point Market Value (US$ Mn) Forecast by Country, 2017-2032

Table 14: Europe Wireless Access Point Market Value (US$ Mn) Forecast by Deployment, 2017-2032

Table 15: Europe Wireless Access Point Market Value (US$ Mn) Forecast by Service, 2017-2032

Table 16: Europe Wireless Access Point Market Value (US$ Mn) Forecast by End User, 2017-2032

Table 17: Asia Pacific Wireless Access Point Market Value (US$ Mn) Forecast by Country, 2017-2032

Table 18: Asia Pacific Wireless Access Point Market Value (US$ Mn) Forecast by Deployment, 2017-2032

Table 19: Asia Pacific Wireless Access Point Market Value (US$ Mn) Forecast by Service, 2017-2032

Table 20: Asia Pacific Wireless Access Point Market Value (US$ Mn) Forecast by End User, 2017-2032

Table 21: MEA Wireless Access Point Market Value (US$ Mn) Forecast by Country, 2017-2032

Table 22: MEA Wireless Access Point Market Value (US$ Mn) Forecast by Deployment, 2017-2032

Table 23: MEA Wireless Access Point Market Value (US$ Mn) Forecast by Service, 2017-2032

Table 24: MEA Wireless Access Point Market Value (US$ Mn) Forecast by End User, 2017-2032
Sudip Saha
Sudip Saha

Principal Consultant

Talk to Analyst

Find your sweet spots for generating winning opportunities in this market.

List of Charts

Figure 1: Global Wireless Access Point Market Value (US$ Mn) by Deployment, 2022-2032

Figure 2: Global Wireless Access Point Market Value (US$ Mn) by Service, 2022-2032

Figure 3: Global Wireless Access Point Market Value (US$ Mn) by End User, 2022-2032

Figure 4: Global Wireless Access Point Market Value (US$ Mn) by Region, 2022-2032

Figure 5: Global Wireless Access Point Market Value (US$ Mn) Analysis by Region, 2017-2032

Figure 6: Global Wireless Access Point Market Value Share (%) and BPS Analysis by Region, 2022-2032

Figure 7: Global Wireless Access Point Market Y-o-Y Growth (%) Projections by Region, 2022-2032

Figure 8: Global Wireless Access Point Market Value (US$ Mn) Analysis by Deployment, 2017-2032

Figure 9: Global Wireless Access Point Market Value Share (%) and BPS Analysis by Deployment, 2022-2032

Figure 10: Global Wireless Access Point Market Y-o-Y Growth (%) Projections by Deployment, 2022-2032

Figure 11: Global Wireless Access Point Market Value (US$ Mn) Analysis by Service, 2017-2032

Figure 12: Global Wireless Access Point Market Value Share (%) and BPS Analysis by Service, 2022-2032

Figure 13: Global Wireless Access Point Market Y-o-Y Growth (%) Projections by Service, 2022-2032

Figure 14: Global Wireless Access Point Market Value (US$ Mn) Analysis by End User, 2017-2032

Figure 15: Global Wireless Access Point Market Value Share (%) and BPS Analysis by End User, 2022-2032

Figure 16: Global Wireless Access Point Market Y-o-Y Growth (%) Projections by End User, 2022-2032

Figure 17: Global Wireless Access Point Market Attractiveness by Deployment, 2022-2032

Figure 18: Global Wireless Access Point Market Attractiveness by Service, 2022-2032

Figure 19: Global Wireless Access Point Market Attractiveness by End User, 2022-2032

Figure 20: Global Wireless Access Point Market Attractiveness by Region, 2022-2032

Figure 21: North America Wireless Access Point Market Value (US$ Mn) by Deployment, 2022-2032

Figure 22: North America Wireless Access Point Market Value (US$ Mn) by Service, 2022-2032

Figure 23: North America Wireless Access Point Market Value (US$ Mn) by End User, 2022-2032

Figure 24: North America Wireless Access Point Market Value (US$ Mn) by Country, 2022-2032

Figure 25: North America Wireless Access Point Market Value (US$ Mn) Analysis by Country, 2017-2032

Figure 26: North America Wireless Access Point Market Value Share (%) and BPS Analysis by Country, 2022-2032

Figure 27: North America Wireless Access Point Market Y-o-Y Growth (%) Projections by Country, 2022-2032

Figure 28: North America Wireless Access Point Market Value (US$ Mn) Analysis by Deployment, 2017-2032

Figure 29: North America Wireless Access Point Market Value Share (%) and BPS Analysis by Deployment, 2022-2032

Figure 30: North America Wireless Access Point Market Y-o-Y Growth (%) Projections by Deployment, 2022-2032

Figure 31: North America Wireless Access Point Market Value (US$ Mn) Analysis by Service, 2017-2032

Figure 32: North America Wireless Access Point Market Value Share (%) and BPS Analysis by Service, 2022-2032

Figure 33: North America Wireless Access Point Market Y-o-Y Growth (%) Projections by Service, 2022-2032

Figure 34: North America Wireless Access Point Market Value (US$ Mn) Analysis by End User, 2017-2032

Figure 35: North America Wireless Access Point Market Value Share (%) and BPS Analysis by End User, 2022-2032

Figure 36: North America Wireless Access Point Market Y-o-Y Growth (%) Projections by End User, 2022-2032

Figure 37: North America Wireless Access Point Market Attractiveness by Deployment, 2022-2032

Figure 38: North America Wireless Access Point Market Attractiveness by Service, 2022-2032

Figure 39: North America Wireless Access Point Market Attractiveness by End User, 2022-2032

Figure 40: North America Wireless Access Point Market Attractiveness by Country, 2022-2032

Figure 41: Latin America Wireless Access Point Market Value (US$ Mn) by Deployment, 2022-2032

Figure 42: Latin America Wireless Access Point Market Value (US$ Mn) by Service, 2022-2032

Figure 43: Latin America Wireless Access Point Market Value (US$ Mn) by End User, 2022-2032

Figure 44: Latin America Wireless Access Point Market Value (US$ Mn) by Country, 2022-2032

Figure 45: Latin America Wireless Access Point Market Value (US$ Mn) Analysis by Country, 2017-2032

Figure 46: Latin America Wireless Access Point Market Value Share (%) and BPS Analysis by Country, 2022-2032

Figure 47: Latin America Wireless Access Point Market Y-o-Y Growth (%) Projections by Country, 2022-2032

Figure 48: Latin America Wireless Access Point Market Value (US$ Mn) Analysis by Deployment, 2017-2032

Figure 49: Latin America Wireless Access Point Market Value Share (%) and BPS Analysis by Deployment, 2022-2032

Figure 50: Latin America Wireless Access Point Market Y-o-Y Growth (%) Projections by Deployment, 2022-2032

Figure 51: Latin America Wireless Access Point Market Value (US$ Mn) Analysis by Service, 2017-2032

Figure 52: Latin America Wireless Access Point Market Value Share (%) and BPS Analysis by Service, 2022-2032

Figure 53: Latin America Wireless Access Point Market Y-o-Y Growth (%) Projections by Service, 2022-2032

Figure 54: Latin America Wireless Access Point Market Value (US$ Mn) Analysis by End User, 2017-2032

Figure 55: Latin America Wireless Access Point Market Value Share (%) and BPS Analysis by End User, 2022-2032

Figure 56: Latin America Wireless Access Point Market Y-o-Y Growth (%) Projections by End User, 2022-2032

Figure 57: Latin America Wireless Access Point Market Attractiveness by Deployment, 2022-2032

Figure 58: Latin America Wireless Access Point Market Attractiveness by Service, 2022-2032

Figure 59: Latin America Wireless Access Point Market Attractiveness by End User, 2022-2032

Figure 60: Latin America Wireless Access Point Market Attractiveness by Country, 2022-2032

Figure 61: Europe Wireless Access Point Market Value (US$ Mn) by Deployment, 2022-2032

Figure 62: Europe Wireless Access Point Market Value (US$ Mn) by Service, 2022-2032

Figure 63: Europe Wireless Access Point Market Value (US$ Mn) by End User, 2022-2032

Figure 64: Europe Wireless Access Point Market Value (US$ Mn) by Country, 2022-2032

Figure 65: Europe Wireless Access Point Market Value (US$ Mn) Analysis by Country, 2017-2032

Figure 66: Europe Wireless Access Point Market Value Share (%) and BPS Analysis by Country, 2022-2032

Figure 67: Europe Wireless Access Point Market Y-o-Y Growth (%) Projections by Country, 2022-2032

Figure 68: Europe Wireless Access Point Market Value (US$ Mn) Analysis by Deployment, 2017-2032

Figure 69: Europe Wireless Access Point Market Value Share (%) and BPS Analysis by Deployment, 2022-2032

Figure 70: Europe Wireless Access Point Market Y-o-Y Growth (%) Projections by Deployment, 2022-2032

Figure 71: Europe Wireless Access Point Market Value (US$ Mn) Analysis by Service, 2017-2032

Figure 72: Europe Wireless Access Point Market Value Share (%) and BPS Analysis by Service, 2022-2032

Figure 73: Europe Wireless Access Point Market Y-o-Y Growth (%) Projections by Service, 2022-2032

Figure 74: Europe Wireless Access Point Market Value (US$ Mn) Analysis by End User, 2017-2032

Figure 75: Europe Wireless Access Point Market Value Share (%) and BPS Analysis by End User, 2022-2032

Figure 76: Europe Wireless Access Point Market Y-o-Y Growth (%) Projections by End User, 2022-2032

Figure 77: Europe Wireless Access Point Market Attractiveness by Deployment, 2022-2032

Figure 78: Europe Wireless Access Point Market Attractiveness by Service, 2022-2032

Figure 79: Europe Wireless Access Point Market Attractiveness by End User, 2022-2032

Figure 80: Europe Wireless Access Point Market Attractiveness by Country, 2022-2032

Figure 81: Asia Pacific Wireless Access Point Market Value (US$ Mn) by Deployment, 2022-2032

Figure 82: Asia Pacific Wireless Access Point Market Value (US$ Mn) by Service, 2022-2032

Figure 83: Asia Pacific Wireless Access Point Market Value (US$ Mn) by End User, 2022-2032

Figure 84: Asia Pacific Wireless Access Point Market Value (US$ Mn) by Country, 2022-2032

Figure 85: Asia Pacific Wireless Access Point Market Value (US$ Mn) Analysis by Country, 2017-2032

Figure 86: Asia Pacific Wireless Access Point Market Value Share (%) and BPS Analysis by Country, 2022-2032

Figure 87: Asia Pacific Wireless Access Point Market Y-o-Y Growth (%) Projections by Country, 2022-2032

Figure 88: Asia Pacific Wireless Access Point Market Value (US$ Mn) Analysis by Deployment, 2017-2032

Figure 89: Asia Pacific Wireless Access Point Market Value Share (%) and BPS Analysis by Deployment, 2022-2032

Figure 90: Asia Pacific Wireless Access Point Market Y-o-Y Growth (%) Projections by Deployment, 2022-2032

Figure 91: Asia Pacific Wireless Access Point Market Value (US$ Mn) Analysis by Service, 2017-2032

Figure 92: Asia Pacific Wireless Access Point Market Value Share (%) and BPS Analysis by Service, 2022-2032

Figure 93: Asia Pacific Wireless Access Point Market Y-o-Y Growth (%) Projections by Service, 2022-2032

Figure 94: Asia Pacific Wireless Access Point Market Value (US$ Mn) Analysis by End User, 2017-2032

Figure 95: Asia Pacific Wireless Access Point Market Value Share (%) and BPS Analysis by End User, 2022-2032

Figure 96: Asia Pacific Wireless Access Point Market Y-o-Y Growth (%) Projections by End User, 2022-2032

Figure 97: Asia Pacific Wireless Access Point Market Attractiveness by Deployment, 2022-2032

Figure 98: Asia Pacific Wireless Access Point Market Attractiveness by Service, 2022-2032

Figure 99: Asia Pacific Wireless Access Point Market Attractiveness by End User, 2022-2032

Figure 100: Asia Pacific Wireless Access Point Market Attractiveness by Country, 2022-2032

Figure 101: MEA Wireless Access Point Market Value (US$ Mn) by Deployment, 2022-2032

Figure 102: MEA Wireless Access Point Market Value (US$ Mn) by Service, 2022-2032

Figure 103: MEA Wireless Access Point Market Value (US$ Mn) by End User, 2022-2032

Figure 104: MEA Wireless Access Point Market Value (US$ Mn) by Country, 2022-2032

Figure 105: MEA Wireless Access Point Market Value (US$ Mn) Analysis by Country, 2017-2032

Figure 106: MEA Wireless Access Point Market Value Share (%) and BPS Analysis by Country, 2022-2032

Figure 107: MEA Wireless Access Point Market Y-o-Y Growth (%) Projections by Country, 2022-2032

Figure 108: MEA Wireless Access Point Market Value (US$ Mn) Analysis by Deployment, 2017-2032

Figure 109: MEA Wireless Access Point Market Value Share (%) and BPS Analysis by Deployment, 2022-2032

Figure 110: MEA Wireless Access Point Market Y-o-Y Growth (%) Projections by Deployment, 2022-2032

Figure 111: MEA Wireless Access Point Market Value (US$ Mn) Analysis by Service, 2017-2032

Figure 112: MEA Wireless Access Point Market Value Share (%) and BPS Analysis by Service, 2022-2032

Figure 113: MEA Wireless Access Point Market Y-o-Y Growth (%) Projections by Service, 2022-2032

Figure 114: MEA Wireless Access Point Market Value (US$ Mn) Analysis by End User, 2017-2032

Figure 115: MEA Wireless Access Point Market Value Share (%) and BPS Analysis by End User, 2022-2032

Figure 116: MEA Wireless Access Point Market Y-o-Y Growth (%) Projections by End User, 2022-2032

Figure 117: MEA Wireless Access Point Market Attractiveness by Deployment, 2022-2032

Figure 118: MEA Wireless Access Point Market Attractiveness by Service, 2022-2032

Figure 119: MEA Wireless Access Point Market Attractiveness by End User, 2022-2032

Figure 120: MEA Wireless Access Point Market Attractiveness by Country, 2022-2032

Recommendations

Technology

Wireless Fire Detection Market

Published : July 2022

Explore Technology Insights

View Reports

Wireless Access Point Market