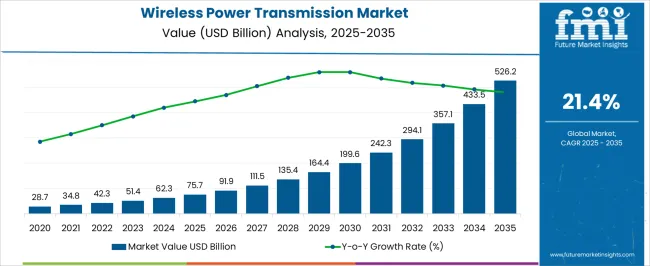
The Wireless Power Transmission Market is estimated to be valued at USD 75.7 billion in 2025 and is projected to reach USD 526.2 billion by 2035, registering a compound annual growth rate (CAGR) of 21.4% over the forecast period.
| Metric | Value |
|---|---|
| Wireless Power Transmission Market Estimated Value in (2025 E) | USD 75.7 billion |
| Wireless Power Transmission Market Forecast Value in (2035 F) | USD 526.2 billion |
| Forecast CAGR (2025 to 2035) | 21.4% |
The wireless power transmission market is experiencing rapid growth, supported by the increasing adoption of wireless charging solutions across consumer electronics, automotive, and industrial applications. The market is being driven by the demand for convenience, reduced cable dependency, and advancements in energy efficiency technologies. Growing consumer preference for seamless device charging and the integration of wireless solutions into smart devices are further accelerating adoption.
Advancements in semiconductor technology, resonant inductive coupling, and radio frequency transmission are enhancing efficiency levels and expanding the range of applications. Standardization initiatives and regulatory support across major economies are providing a strong foundation for market expansion, while strategic collaborations between technology providers and device manufacturers are enabling faster commercialization. Rising demand for compact, portable, and energy-efficient consumer devices is also acting as a key driver.
With the continuous evolution of the Internet of Things and the deployment of connected infrastructure, the market outlook remains highly positive The ability of wireless power transmission to provide safe, reliable, and user-friendly energy transfer solutions is expected to pave the way for sustained growth globally.
The wireless power transmission market is segmented by product type, technology, end use industry, and geographic regions. By product type, wireless power transmission market is divided into Mobile Charging Pads, EV Chargers, Laptop/Notebook Charging Pads, Industrial Charging Systems, and Others. In terms of technology, wireless power transmission market is classified into Near-field Technology and Far-field Technology. Based on end use industry, wireless power transmission market is segmented into Consumer Electronics, Automotive, Industrial, Medical Devices, Home & Building Automation, and Others. Regionally, the wireless power transmission industry is classified into North America, Latin America, Western Europe, Eastern Europe, Balkan & Baltic Countries, Russia & Belarus, Central Asia, East Asia, South Asia & Pacific, and the Middle East & Africa.
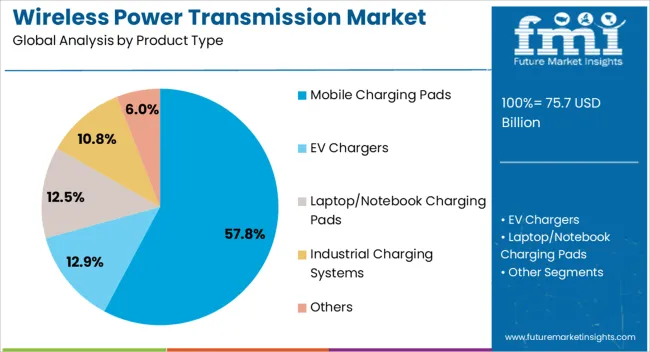
The mobile charging pads segment is projected to account for 57.8% of the wireless power transmission market revenue share in 2025, making it the dominant product type. This leadership is being reinforced by the growing demand for consumer convenience, as mobile charging pads allow effortless charging without physical connectors. Their widespread compatibility with smartphones, wearable devices, and accessories has positioned them as the most accessible and cost-effective solution for wireless charging adoption.
Increasing integration of charging pads in households, offices, and public spaces is expanding their use, supported by growing investments from device manufacturers to standardize wireless charging interfaces. Enhanced efficiency achieved through innovations in inductive and resonant charging is improving charging speed and reliability, further driving consumer acceptance.
The segment is also benefiting from the ability of charging pads to support multi-device charging, making them highly versatile As the consumer electronics market continues to expand, mobile charging pads are expected to remain the most widely adopted product type, ensuring their sustained leadership in the wireless power transmission industry.
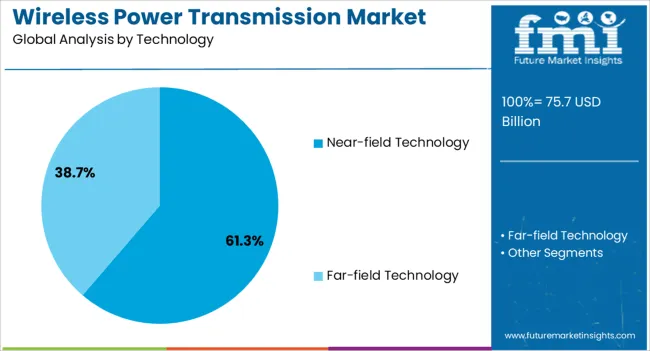
The near-field technology segment is anticipated to capture 61.3% of the wireless power transmission market revenue share in 2025, securing its position as the leading technology. Its dominance is being supported by proven efficiency, short-range safety, and widespread adoption in consumer electronics charging applications. The ability to provide stable energy transfer with minimal energy loss has made near-field technology the preferred choice for everyday portable devices.
Increasing adoption in smartphones, earbuds, tablets, and wearable devices is reinforcing its position, while continuous improvements in magnetic resonance and inductive coupling are expanding its application scope. Regulatory bodies are also promoting near-field wireless charging through safety certifications and interoperability standards, further accelerating adoption.
The segment is being strengthened by its ability to support standardized platforms, ensuring compatibility across multiple device brands As demand rises for user-friendly and compact charging solutions, near-field technology is expected to maintain its leadership, providing a strong foundation for mass deployment in both consumer and commercial applications.
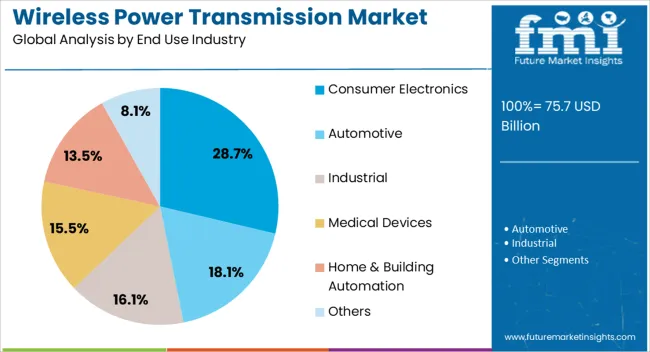
The consumer electronics segment is expected to hold 28.7% of the wireless power transmission market revenue share in 2025, making it the leading end use industry. Its leadership is being driven by the surging global demand for smartphones, wearables, and portable devices that require frequent charging. The growing consumer preference for cable-free convenience and enhanced user experiences is accelerating the integration of wireless charging technologies in electronic devices.
Device manufacturers are increasingly embedding wireless power solutions into product designs to enhance competitiveness and meet rising expectations for seamless functionality. Strategic alliances between electronics companies and wireless technology providers are supporting ecosystem development and boosting adoption rates.
The segment is also benefiting from ongoing advancements in compact design, faster charging speeds, and multi-device charging capabilities, which directly address consumer needs With the expansion of connected ecosystems and the Internet of Things, consumer electronics will remain the largest adopter of wireless power transmission technologies, reinforcing its position as the primary growth driver in the global market.
Wireless power transmission is the development in the method of charging electronic supplies, which may be consumer or industrial in nature. This technology implements electromagnetic waves to transfer power to the electronic devices, eliminating the need of wires.
Allowing power transfer to various devices from the same charging unit as well as identifying which device needs to be charged for what duration of time are features introduced by the wireless power transmission technology.
The wireless power transmission market consists of about 20% of the power transmission market.
The wireless power transmission market is estimated to grow at a CAGR of 21.4% for the forecast period of 2025 to 2035.
The reasons for this growth are that wireless power transmission technologies are becoming widely available for consumer purposes and for various types of electronic devices.
Miniaturized and multifunctional IMDs (Implantable Medical Devices) are becoming increasingly important as they enable continuous monitoring, early detection, and initial treatment of dysfunctional organs. However, the power requirements associated with some of these devices are a major challenge. For deeper IMDs, percutaneous wire-based power is a medically unacceptable solution because it leaves significant scarring on the tissue surrounding the IMD.
Packaged batteries, which are limited by their operating life and require repeated surgical procedures to replace. Additionally, a leaking battery can pose a serious risk to patient health. Batteries also take up a significant portion of the available internal volume of these miniaturised IMDs, which can reduce the functionality of such devices. So the power requirements, lifespan, and size of the power supply dictate today's specs for his latest IMD.
The rise of Internet of Things (IoT) applications such as smart cities, homes, industrial IoT (IIoT), and machine-to-machine (M2M) communications is accelerating the market. Wireless power transfer has become very relevant due to its benefits such as portability, convenience, increased reliability, and no need for batteries or cables.
The demand for wireless power transmission is driven by the benefits it offers, which helps in eliminating cables while providing clutter-free charging. Wireless chargers can sense how much power each electronic device requires, so the consumer’s battery won't be overcharged.
Also, wireless power transmission has less power loss than wired power transmission because there are no AT&C losses in wireless power transmission. This is expected to further promote the adoption of wireless power transfer and expand the global wireless power transfer market.
North America is the region that had the largest market share in 2025, with a market share of 32.9%. and the region with the fastest growth rate is South Asia & Pacific with a CAGR of 22.5%.
North America has a large number of people who have smartphones. Several large electronic companies are based in this region, and it is often the region where any new technological advancement occurs before any other region globally. The presence of people with disposable income acts as a factor allowing the growth of the wireless power transmission market since people also have several consumer electronic devices.
For these reasons, the South Asia & Pacific region has one of the largest number of smartphone users globally and the penetration of consumer electronic devices is increasing in the urban areas of this region. Economic growth is occurring in this region much faster than in other regions, and for these reasons, the South Asia & Pacific region has the highest CAGR of 22.5%.
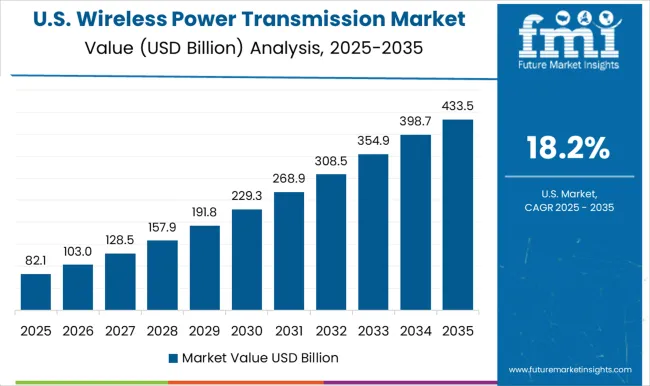
The United States is supposed to overwhelm the development of the remote power transmission market because of the rising requirement for battery-fuelled gear. The interest in convenient gadgets has been expanding. High-energy beats and a battery can make cell phones three-fifths less expensive than ordinary cell phones.
The key factor in the wireless power transmission market in the United States is rising usage, which includes increased adoption of gadgets like cameras, digital MP3, smartphones, notebooks, and players among consumer electronics. Therefore, customers want to replace complicated wired connectivity with wireless technology as it offers easy and enhanced operations and mobility and this country is estimated to witness a growth of 13.8% for the forecast period, for the wireless power transmission market.
Large populations and urbanisation always have a demand for machinery and electronics. As a result, China's large market size in the worldwide wireless power transmission technology market may be linked to large customer electronics industries.
China is a base for assembling different electronic items like tablets, cell phones, workstations, and wearable customer hardware. As the assembling and work costs are low around here, a large portion of the electronic items purchased are created here. The gigantic population base and fast development in urbanisation around here have prompted the critical interest in electronic gadgets. Additionally, the entrance of the web has likewise upgraded the usage of electronic machines, for example, cell phones, PCs, iPads, etc.
This makes hardware the biggest product that sends out workers in their domain. The majority of the items were cutting-edge, such as PCs, semiconductors, and broadcast communications equipment. For these reasons China is estimated to grow at a CAGR of 19.2% during the forecast period for wireless power transmission market.
Germany is at the focal point of Europe. Germany is one of the largest European economies, with several technological advancements taking place, as well as the implementation of these developing technologies.
This country also has several large industries that implement developing technologies. For these reasons, the implementation of wireless power transmission technologies is estimated to be adopted quicker as well as earlier in this region.
Global warming and climate change are encouraging people to take up solutions and methods that have fewer carbon emissions. The United Nations sustainable development goal for taking actions against climate change and air pollution is encouraging more countries globally to shift towards electronic vehicles.
Several large transport and vehicle companies have begun offering electric vehicles for rent and purchase, and governments across the globe are taking initiatives to make EVs more accessible to the public.
Wireless EV chargers are not only expected to witness growth because of the growing number of electric vehicles, but also because they can make vehicle charging much more convenient. They can be deployed in private and public parking, encouraging individuals to even buy EVs since they do not have to worry about charging in locations far from home and, in some cases, they may not have to bother about purchasing one either.
For this reason, wireless EV chargers are estimated to grow at a CAGR of 23.3%.
Far-field wireless power transmission allows the electronic device to be placed at a distance from the charger or the charging point and allows the device to charge via radio waves.
This can allow multiple devices as well as multiple types of devices to be charged via the far-field wireless charger, and this can act as a strong driver for these types of wireless power transmitters, which indirectly will allow the wireless power transmission market to grow as well.
This segment is estimated to grow at a CAGR of 22.7% for the forecast period.
Consumer electronics account for a major market share in the global electronic market. These products are also manufactured on large scales, and the demand for these products is often constant globally.
Wireless charging is a concept that can even appeal more to the consumer base in this segment because of aspects like the ability to charge multiple devices, avoid the hassle of incompatible charging points and managing the cables, and something as simple as the attractive factor of being tech-savvy.
It is also possible to charge several consumer products wirelessly, and the two electronic devices that are dominating the wireless power transmission market are smartphones and EVs. Both are consumer electronic products.
For this reason, consumer electronics had the largest market share in the year 2025 at 28.7%.

Wireless power transmission technology is currently being offered by various companies which specialise in the development of electronic devices like computer processors and integrated circuits. Apart from these, companies which offer consumer electronic devices are entering this market as well.
| Country | CAGR |
|---|---|
| China | 28.9% |
| India | 26.8% |
| Germany | 24.6% |
| France | 22.5% |
| UK | 20.3% |
| USA | 18.2% |
| Brazil | 16.1% |
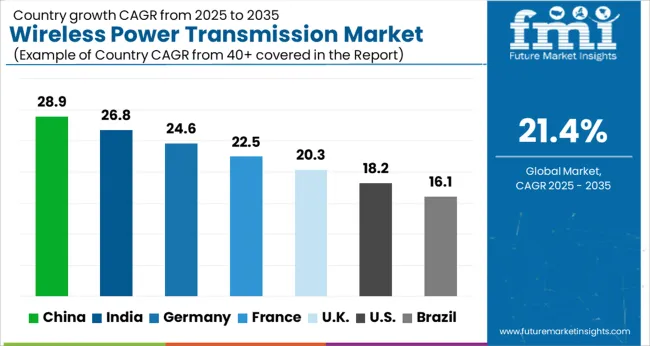
The Wireless Power Transmission Market is expected to register a CAGR of 21.4% during the forecast period, exhibiting varied country level momentum. China leads with the highest CAGR of 28.9%, followed by India at 26.8%. Developed markets such as Germany, France, and the UK continue to expand steadily, while the USA is likely to grow at consistent rates. Brazil posts the lowest CAGR at 16.1%, yet still underscores a broadly positive trajectory for the global Wireless Power Transmission Market. In 2024, Germany held a dominant revenue in the Western Europe market and is expected to grow with a CAGR of 24.6%. The USA Wireless Power Transmission Market is estimated to be valued at USD 28.6 billion in 2025 and is anticipated to reach a valuation of USD 152.1 billion by 2035. Sales are projected to rise at a CAGR of 18.2% over the forecast period between 2025 and 2035. While Japan and South Korea markets are estimated to be valued at USD 4.1 billion and USD 2.3 billion respectively in 2025.
| Item | Value |
|---|---|
| Quantitative Units | USD 75.7 Billion |
| Product Type | Mobile Charging Pads, EV Chargers, Laptop/Notebook Charging Pads, Industrial Charging Systems, and Others |
| Technology | Near-field Technology and Far-field Technology |
| End Use Industry | Consumer Electronics, Automotive, Industrial, Medical Devices, Home & Building Automation, and Others |
| Regions Covered | North America, Europe, Asia-Pacific, Latin America, Middle East & Africa |
| Country Covered | United States, Canada, Germany, France, United Kingdom, China, Japan, India, Brazil, South Africa |
| Key Companies Profiled | Wiferion, WiTricity, Samsung Electronics Co. Ltd, Texas Instruments Inc, Qualcomm, Inc., TDK Corporation, Emrod, Energous Corporation, Energysquare, Humavox LTD., Powercast, and Ossia |
The global wireless power transmission market is estimated to be valued at USD 75.7 billion in 2025.
The market size for the wireless power transmission market is projected to reach USD 526.2 billion by 2035.
The wireless power transmission market is expected to grow at a 21.4% CAGR between 2025 and 2035.
The key product types in wireless power transmission market are mobile charging pads, ev chargers, laptop/notebook charging pads, industrial charging systems and others.
In terms of technology, near-field technology segment to command 61.3% share in the wireless power transmission market in 2025.


Our Research Products

The "Full Research Suite" delivers actionable market intel, deep dives on markets or technologies, so clients act faster, cut risk, and unlock growth.

The Leaderboard benchmarks and ranks top vendors, classifying them as Established Leaders, Leading Challengers, or Disruptors & Challengers.

Locates where complements amplify value and substitutes erode it, forecasting net impact by horizon

We deliver granular, decision-grade intel: market sizing, 5-year forecasts, pricing, adoption, usage, revenue, and operational KPIs—plus competitor tracking, regulation, and value chains—across 60 countries broadly.

Spot the shifts before they hit your P&L. We track inflection points, adoption curves, pricing moves, and ecosystem plays to show where demand is heading, why it is changing, and what to do next across high-growth markets and disruptive tech

Real-time reads of user behavior. We track shifting priorities, perceptions of today’s and next-gen services, and provider experience, then pace how fast tech moves from trial to adoption, blending buyer, consumer, and channel inputs with social signals (#WhySwitch, #UX).

Partner with our analyst team to build a custom report designed around your business priorities. From analysing market trends to assessing competitors or crafting bespoke datasets, we tailor insights to your needs.
Supplier Intelligence
Discovery & Profiling
Capacity & Footprint
Performance & Risk
Compliance & Governance
Commercial Readiness
Who Supplies Whom
Scorecards & Shortlists
Playbooks & Docs
Category Intelligence
Definition & Scope
Demand & Use Cases
Cost Drivers
Market Structure
Supply Chain Map
Trade & Policy
Operating Norms
Deliverables
Buyer Intelligence
Account Basics
Spend & Scope
Procurement Model
Vendor Requirements
Terms & Policies
Entry Strategy
Pain Points & Triggers
Outputs
Pricing Analysis
Benchmarks
Trends
Should-Cost
Indexation
Landed Cost
Commercial Terms
Deliverables
Brand Analysis
Positioning & Value Prop
Share & Presence
Customer Evidence
Go-to-Market
Digital & Reputation
Compliance & Trust
KPIs & Gaps
Outputs
Full Research Suite comprises of:
Market outlook & trends analysis
Interviews & case studies
Strategic recommendations
Vendor profiles & capabilities analysis
5-year forecasts
8 regions and 60+ country-level data splits
Market segment data splits
12 months of continuous data updates
DELIVERED AS:
PDF EXCEL ONLINE
Wireless EEG Monitoring System Market Size and Share Forecast Outlook 2025 to 2035
Wireless Refrigerant Charging Scale Market Size and Share Forecast Outlook 2025 to 2035
Wireless Hydrometer Market Size and Share Forecast Outlook 2025 to 2035
Wireless HDMI Transmitter and Receiver Market Size and Share Forecast Outlook 2025 to 2035
Wireless Access Point Market Size and Share Forecast Outlook 2025 to 2035
Wireless Video - 2.4/5GHz Market Size and Share Forecast Outlook 2025 to 2035
Wireless Polysomnography Market Size and Share Forecast Outlook 2025 to 2035
Wireless Audio Devices Market Size and Share Forecast Outlook 2025 to 2035
Wireless Communication Technologies In Healthcare Market Size and Share Forecast Outlook 2025 to 2035
Wireless Mesh Network Market Size and Share Forecast Outlook 2025 to 2035
Wireless Sensor Tags Market Size and Share Forecast Outlook 2025 to 2035
Wireless Sensor Network Market Size and Share Forecast Outlook 2025 to 2035
Wireless Home Security Camera Market Size and Share Forecast Outlook 2025 to 2035
Wireless Testing Market Size and Share Forecast Outlook 2025 to 2035
Wireless Battery Monitoring System Market Size and Share Forecast Outlook 2025 to 2035
Wireless Printer Market Size and Share Forecast Outlook 2025 to 2035
Wireless Headphones Market Size and Share Forecast Outlook 2025 to 2035
Wireless Sensors Market Size and Share Forecast Outlook 2025 to 2035
Wireless Display Market Size and Share Forecast Outlook 2025 to 2035
Wireless Paging Systems Market Size and Share Forecast Outlook 2025 to 2035

Thank you!
You will receive an email from our Business Development Manager. Please be sure to check your SPAM/JUNK folder too.
Chat With
MaRIA