Reports
- Global Locations -
Headquarters
Future Market Insights, Inc.
Christiana Corporate, 200
Continental Drive, Suite 401,
Newark, Delaware - 19713,
United States
Americas
Future Market Insights, Inc.
616 Corporate Way, Suite 2-9018,
Valley Cottage, NY 10989, United States
MEA
Future Market Insights
1602-6 Jumeirah Bay X2 Tower, Plot No: JLT-PH2-X2A,
Jumeirah Lakes Towers, Dubai,
United Arab Emirates
Europe
Future Market Insights
3rd Floor, 207 Regent Street,
W1B 3HH London
United Kingdom
Asia Pacific
Future Market Insights
Office No. 401-A, 4th Floor,
VANTAGE 9, S.No. 36/1/1,
Baner, Pune 411045, India
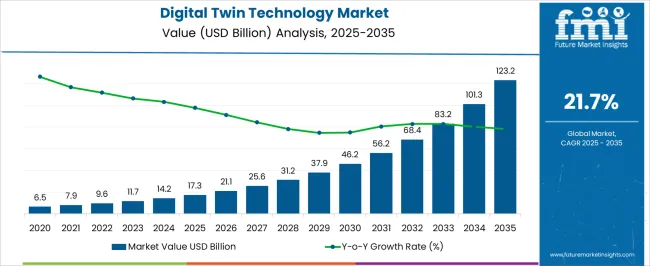
The global digital twin technology market is anticipated to expand at an outstanding CAGR of 22.7% during the forecast period. The market is projected to be worth US$ 89,145.1 million by 2033, up from US$ 11,494.0 million in 2023.
Several factors, such as the introduction of smart technology, optimized products, abolishment of obsolete technology, and digitization of records, are expected to surge the demand for digital twin technology. The rising cyber-attacks and lack of awareness of the proper adoption of digital twin technology in rural areas are certain factors that are likely to impede global market growth. Conversely, new opportunities are expected to open up with increased investments in research and development activities.
Attribute | Details |
---|---|
Digital Twin Technology Market Size (2023) | US$ 11,494.0 million |
Digital Twin Technology Market Size (2033) | US$ 89,145.1 million |
Digital Twin Technology Market CAGR | 22.7% |
Digital twin service is utilized for trending applications such as monitoring, smart cities, and diagnostics. Likewise, a few modern applications, wind and aircraft engines, are considering the adoption of digital twin technology. Aircraft engines are considering the adoption of digital twin technology.
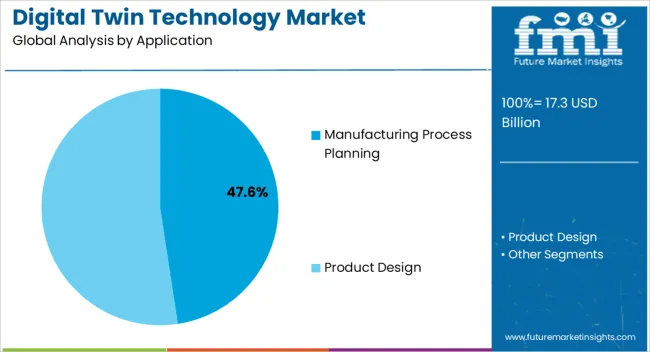
Product design and manufacturing process planning embrace the digital twin service as an application since the Internet of Things (IoT) makes it cost-effective to deploy. Likewise, owing to a crucial bridge forming between the physical and virtual worlds, the digital twin infrastructure has gained enormous traction with the emergence of big data and IoT. and IoT.
Stimulating the effects of changes to various processes to improve supply chain design tests, monitor risk test probabilities, and aid firms in recognizing trends can all be achieved by deploying the digital twin process. Moreover, 3D printing production processes can be imitated with the help of a digital twin service.
Don't pay for what you don't need
Customize your report by selecting specific countries or regions and save 30%!
The digital twin technology industry could benefit from the widespread use of the technology across various end-use industries. As a result, the digital twin technology market stands to benefit from its increasing prevalence in fields such as supply chain management, warehouse management, and smart city projects. The benefits of these technologies in coordinating the parts, boosting the operations, and improving the performance have attracted a lot of customers.
supply chain management, warehouse management, and smart city projects. The benefits of these technologies in coordinating the parts, boosting the operations, and improving the performance, have attracted a lot of customers.
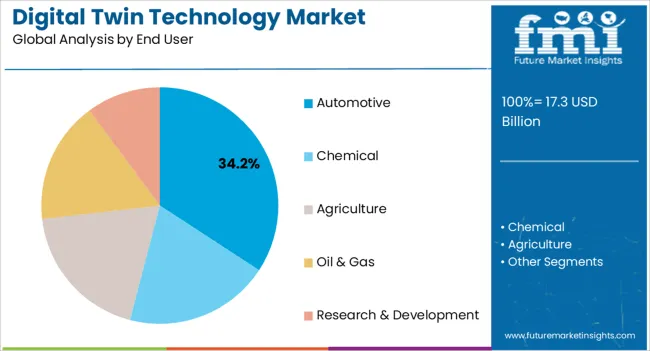
Digital twin infrastructure has improved the offerings of the thriving automotive industry. It is also possible that the rising use of simulation software may help propel the digital twin technology market forward. Growth in the digital twin technology industry is forecast to skyrocket thanks to the increasing popularity of autonomous and connected vehicles, including amenities like electrification and shared mobility.
Increases in healthcare provision can be directly attributed to the pandemic. On the other hand, the digital twin process has proven useful in researching patients' medical records and creating realistic practice runs of their treatments. In addition, the construction industry is enhancing 3D models utilizing digital twin technologies for smart city projects in emerging economies. Moreover, the telecom industry embraces new solutions and modernizes its network infrastructure by adopting digital twin technology. The demand for digital twin technology can be predicted to increase for several reasons.
The integration of multiple IoT sensors and other digital technologies is the solution to developing the physical twin. However, there is an augmented security risk, compliance, and data protection with the increasing number of IoT sensors and programmable electronic devices deployed.
On the contrary, major corporations in the field are focusing on inventing innovative technology solutions to enhance their presence in the digital twin technology market share. Additionally, the strong growth for related technologies in the pharmaceutical and healthcare enterprises, increased usage of 3D printing technology, and the increasing proclivity to adopt IoT technologies across multiple industries are expected to drive such acceptance throughout the forecast timeframe.On the contrary, major corporations in the field are focusing on inventing innovative technology solutions to enhance their presence in the digital twin technology market share. Additionally, the strong growth for related technologies in the pharmaceutical and healthcare enterprises, increased usage of 3D printing technology, and the increasing proclivity to adopt IoT technologies across multiple industries are expected to drive such technology acceptances throughout the forecast timeframe.
Countries | Details |
---|---|
North America | North America is the largest digital twin technology market, with 34.5%. Several end-users across industries in this area are investing in parts twin and product twin, which should fuel the worldwide digital twin technology market. The presence of Microsoft, Cisco, IBM, Oracle, etc., in this area, is likely to boost the global digital twin technology market. As market participants merge and form alliances to extend their client base and product offerings, demand for digital twin technology is set to rise. |
Europe | Europe's digital twin technology market revenue is 21%. This is due to large investments in R&D by the automotive and manufacturing sectors and the biotechnology industry's anticipated expansion.Europe's digital twin technology market revenue is 21%. This is due to large investments in R&D by the automotive and manufacturing sectors and the biotechnology industry's anticipated expansion. This region's automotive and transportation industries are implementing this technology across processes, which is likely to grow the global digital twin technology market. This region also demands virtual twin technology.This region's automotive and transportation industries are implementing this technology across processes, which is likely grow the global digital twin technology market. This region also demands virtual twin technology. |
Manufacturers can better understand processes by considering multiple production parameters through the adoption of digital twin technology. These include digital maintenance tasks, equipment monitoring, and process optimization. Start-up companies are implementing innovations to improve the digital twin process landscape.
Get the data you need at a Fraction of the cost
Personalize your report by choosing insights you need
and save 40%!
Introducing innovative and advanced products is encouraging companies to invest in the R&D of automation of processes and products, which are the result of intense competition among leading players. Improving customer engagement by using interactive automobile dashboards on websites, where customers can customize vehicles at their convenience, is being carried out by several automotive brands through the adoption of digital twin technology.
Key Market Participants of the Digital Twin Technology Market:
Siemens Ltd. | It is a German multinational conglomerate corporation and Europe's largest industrial manufacturing company headquartered in Munich with branch offices abroad. |
---|---|
General Electric Company | It is an American multinational company. For more than 125 years, GE has invented the industry's future. Today, GE is best known for its work in the Power, Renewable Energy, Aviation and Healthcare industries. |
TIBCO Software Inc. | It is an American business intelligence software company founded in 1997 in Palo Alto, California. It has headquarters in Palo Alto, California, and offices in North America, Europe, Asia, the Middle East, Africa and South America. |
SAP SE | It is a German multinational software company based in Walldorf, Baden-Württemberg. It develops enterprise software to manage business operations and customer relations. The company is the world's leading enterprise resource planning software vendor. |
Microsoft Corporation | It is an American multinational technology corporation that produces computer software, consumer electronics, personal computers, and related services headquartered at the Microsoft Redmond campus located in Redmond, Washington, United States.It is an American multinational technology corporation which produces computer software, consumer electronics, personal computers, and related services headquartered at the Microsoft Redmond campus located in Redmond, Washington, United States. |
Some of the recent developments in the digital twin technology market are
Attribute | Details |
---|---|
Growth Rate | CAGR of 22.7% from 2023 to 2033 |
The base year for estimation | 2022 |
Historical data | 2018 to 2022 |
Forecast period | 2023 to 2033 |
Quantitative units | Revenue in US$ million and CAGR from 2023 to 2033 |
Report Coverage | Revenue forecast, volume forecast, company ranking, competitive landscape, growth factors and trends, Pricing Analysis |
Segments Covered | Application, End User, and Region. |
Regional scope | North America; Western Europe, Eastern Europe, Middle East, Africa, ASEAN, South Asia, Rest of Asia, Australia and New Zealand |
Country scope | United States.; Canada; Mexico; Germany; United Kingdom; France; Italy; Spain; Russia; Belgium; Poland; Czech Republic; China; India; Japan; Australia; Brazil; Argentina; Colombia; Saudi Arabia; UAE; Iran; South Africa |
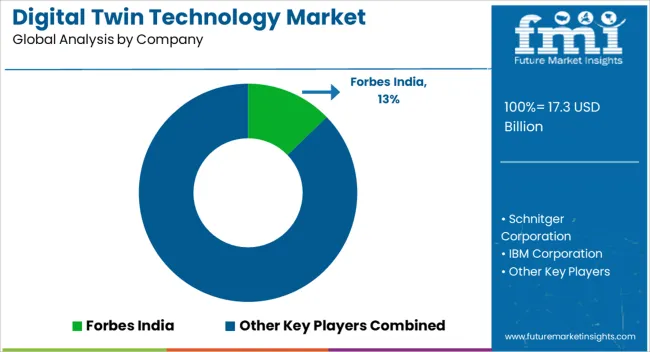
Key companies profiled | Siemens Ltd., General Electric Company, Tibco Software Inc., SAP SE, Microsoft Corporation, Forbes India, Schnitger Corporation, IBM Corporation, Hexagon AB, AVEVA Group plc, Bosch Software Innovations GmbH, etc. |
Customization scope | Free report customization (equivalent to 8 analysts' working days) with purchase. Addition or alteration to country, regional & segment scope.Free report customization (equivalent to up to 8 analysts working days) with purchase. Addition or alteration to country, regional & segment scope. |
Pricing and purchase options | Avail customized purchase options to meet your exact research needs. |
1. Executive Summary 1.1. Global Market Outlook 1.2. Demand-side Trends 1.3. Supply-side Trends 1.4. Technology Roadmap Analysis 1.5. Analysis and Recommendations 2. Market Overview 2.1. Market Coverage / Taxonomy 2.2. Market Definition / Scope / Limitations 3. Market Background 3.1. Market Dynamics 3.1.1. Drivers 3.1.2. Restraints 3.1.3. Opportunity 3.1.4. Trends 3.2. Scenario Forecast 3.2.1. Demand in Optimistic Scenario 3.2.2. Demand in Likely Scenario 3.2.3. Demand in Conservative Scenario 3.3. Opportunity Map Analysis 3.4. Investment Feasibility Matrix 3.5. PESTLE and Porter’s Analysis 3.6. Regulatory Landscape 3.6.1. By Key Regions 3.6.2. By Key Countries 3.7. Regional Parent Market Outlook 4. Global Market Analysis 2018 to 2022 and Forecast, 2023 to 2033 4.1. Historical Market Size Value (US$ Million) Analysis, 2018 to 2022 4.2. Current and Future Market Size Value (US$ Million) Projections, 2023 to 2033 4.2.1. Y-o-Y Growth Trend Analysis 4.2.2. Absolute $ Opportunity Analysis 5. Global Market Analysis 2018 to 2022 and Forecast 2023 to 2033, By Application 5.1. Introduction / Key Findings 5.2. Historical Market Size Value (US$ Million) Analysis By Application, 2018 to 2022 5.3. Current and Future Market Size Value (US$ Million) Analysis and Forecast By Application, 2023 to 2033 5.3.1. Manufacturing Process Planning 5.3.2. Product Design 5.4. Y-o-Y Growth Trend Analysis By Application, 2018 to 2022 5.5. Absolute $ Opportunity Analysis By Application, 2023 to 2033 6. Global Market Analysis 2018 to 2022 and Forecast 2023 to 2033, By End User 6.1. Introduction / Key Findings 6.2. Historical Market Size Value (US$ Million) Analysis By End User, 2018 to 2022 6.3. Current and Future Market Size Value (US$ Million) Analysis and Forecast By End User, 2023 to 2033 6.3.1. Automotive 6.3.2. Chemical 6.3.3. Agriculture 6.3.4. Oil & Gas 6.3.5. Research & Development 6.4. Y-o-Y Growth Trend Analysis By End User, 2018 to 2022 6.5. Absolute $ Opportunity Analysis By End User, 2023 to 2033 7. Global Market Analysis 2018 to 2022 and Forecast 2023 to 2033, By Region 7.1. Introduction 7.2. Historical Market Size Value (US$ Million) Analysis By Region, 2018 to 2022 7.3. Current Market Size Value (US$ Million) Analysis and Forecast By Region, 2023 to 2033 7.3.1. North America 7.3.2. Latin America 7.3.3. Western Europe 7.3.4. Eastern Europe 7.3.5. South Asia and Pacific 7.3.6. East Asia 7.3.7. Middle East and Africa 7.4. Market Attractiveness Analysis By Region 8. North America Market Analysis 2018 to 2022 and Forecast 2023 to 2033, By Country 8.1. Historical Market Size Value (US$ Million) Trend Analysis By Market Taxonomy, 2018 to 2022 8.2. Market Size Value (US$ Million) Forecast By Market Taxonomy, 2023 to 2033 8.2.1. By Country 8.2.1.1. The USA 8.2.1.2. Canada 8.2.2. By Application 8.2.3. By End User 8.3. Market Attractiveness Analysis 8.3.1. By Country 8.3.2. By Application 8.3.3. By End User 8.4. Key Takeaways 9. Latin America Market Analysis 2018 to 2022 and Forecast 2023 to 2033, By Country 9.1. Historical Market Size Value (US$ Million) Trend Analysis By Market Taxonomy, 2018 to 2022 9.2. Market Size Value (US$ Million) Forecast By Market Taxonomy, 2023 to 2033 9.2.1. By Country 9.2.1.1. Brazil 9.2.1.2. Mexico 9.2.1.3. Rest of Latin America 9.2.2. By Application 9.2.3. By End User 9.3. Market Attractiveness Analysis 9.3.1. By Country 9.3.2. By Application 9.3.3. By End User 9.4. Key Takeaways 10. Western Europe Market Analysis 2018 to 2022 and Forecast 2023 to 2033, By Country 10.1. Historical Market Size Value (US$ Million) Trend Analysis By Market Taxonomy, 2018 to 2022 10.2. Market Size Value (US$ Million) Forecast By Market Taxonomy, 2023 to 2033 10.2.1. By Country 10.2.1.1. Germany 10.2.1.2. United Kingdom 10.2.1.3. France 10.2.1.4. Spain 10.2.1.5. Italy 10.2.1.6. Rest of Western Europe 10.2.2. By Application 10.2.3. By End User 10.3. Market Attractiveness Analysis 10.3.1. By Country 10.3.2. By Application 10.3.3. By End User 10.4. Key Takeaways 11. Eastern Europe Market Analysis 2018 to 2022 and Forecast 2023 to 2033, By Country 11.1. Historical Market Size Value (US$ Million) Trend Analysis By Market Taxonomy, 2018 to 2022 11.2. Market Size Value (US$ Million) Forecast By Market Taxonomy, 2023 to 2033 11.2.1. By Country 11.2.1.1. Poland 11.2.1.2. Russia 11.2.1.3. Czech Republic 11.2.1.4. Romania 11.2.1.5. Rest of Eastern Europe 11.2.2. By Application 11.2.3. By End User 11.3. Market Attractiveness Analysis 11.3.1. By Country 11.3.2. By Application 11.3.3. By End User 11.4. Key Takeaways 12. South Asia and Pacific Market Analysis 2018 to 2022 and Forecast 2023 to 2033, By Country 12.1. Historical Market Size Value (US$ Million) Trend Analysis By Market Taxonomy, 2018 to 2022 12.2. Market Size Value (US$ Million) Forecast By Market Taxonomy, 2023 to 2033 12.2.1. By Country 12.2.1.1. India 12.2.1.2. Bangladesh 12.2.1.3. Australia 12.2.1.4. New Zealand 12.2.1.5. Rest of South Asia and Pacific 12.2.2. By Application 12.2.3. By End User 12.3. Market Attractiveness Analysis 12.3.1. By Country 12.3.2. By Application 12.3.3. By End User 12.4. Key Takeaways 13. East Asia Market Analysis 2018 to 2022 and Forecast 2023 to 2033, By Country 13.1. Historical Market Size Value (US$ Million) Trend Analysis By Market Taxonomy, 2018 to 2022 13.2. Market Size Value (US$ Million) Forecast By Market Taxonomy, 2023 to 2033 13.2.1. By Country 13.2.1.1. China 13.2.1.2. Japan 13.2.1.3. South Korea 13.2.2. By Application 13.2.3. By End User 13.3. Market Attractiveness Analysis 13.3.1. By Country 13.3.2. By Application 13.3.3. By End User 13.4. Key Takeaways 14. Middle East and Africa Market Analysis 2018 to 2022 and Forecast 2023 to 2033, By Country 14.1. Historical Market Size Value (US$ Million) Trend Analysis By Market Taxonomy, 2018 to 2022 14.2. Market Size Value (US$ Million) Forecast By Market Taxonomy, 2023 to 2033 14.2.1. By Country 14.2.1.1. GCC Countries 14.2.1.2. South Africa 14.2.1.3. Israel 14.2.1.4. Rest of MEA 14.2.2. By Application 14.2.3. By End User 14.3. Market Attractiveness Analysis 14.3.1. By Country 14.3.2. By Application 14.3.3. By End User 14.4. Key Takeaways 15. Key Countries Market Analysis 15.1. USA 15.1.1. Pricing Analysis 15.1.2. Market Share Analysis, 2022 15.1.2.1. By Application 15.1.2.2. By End User 15.2. Canada 15.2.1. Pricing Analysis 15.2.2. Market Share Analysis, 2022 15.2.2.1. By Application 15.2.2.2. By End User 15.3. Brazil 15.3.1. Pricing Analysis 15.3.2. Market Share Analysis, 2022 15.3.2.1. By Application 15.3.2.2. By End User 15.4. Mexico 15.4.1. Pricing Analysis 15.4.2. Market Share Analysis, 2022 15.4.2.1. By Application 15.4.2.2. By End User 15.5. Germany 15.5.1. Pricing Analysis 15.5.2. Market Share Analysis, 2022 15.5.2.1. By Application 15.5.2.2. By End User 15.6. United Kingdom 15.6.1. Pricing Analysis 15.6.2. Market Share Analysis, 2022 15.6.2.1. By Application 15.6.2.2. By End User 15.7. France 15.7.1. Pricing Analysis 15.7.2. Market Share Analysis, 2022 15.7.2.1. By Application 15.7.2.2. By End User 15.8. Spain 15.8.1. Pricing Analysis 15.8.2. Market Share Analysis, 2022 15.8.2.1. By Application 15.8.2.2. By End User 15.9. Italy 15.9.1. Pricing Analysis 15.9.2. Market Share Analysis, 2022 15.9.2.1. By Application 15.9.2.2. By End User 15.10. Poland 15.10.1. Pricing Analysis 15.10.2. Market Share Analysis, 2022 15.10.2.1. By Application 15.10.2.2. By End User 15.11. Russia 15.11.1. Pricing Analysis 15.11.2. Market Share Analysis, 2022 15.11.2.1. By Application 15.11.2.2. By End User 15.12. Czech Republic 15.12.1. Pricing Analysis 15.12.2. Market Share Analysis, 2022 15.12.2.1. By Application 15.12.2.2. By End User 15.13. Romania 15.13.1. Pricing Analysis 15.13.2. Market Share Analysis, 2022 15.13.2.1. By Application 15.13.2.2. By End User 15.14. India 15.14.1. Pricing Analysis 15.14.2. Market Share Analysis, 2022 15.14.2.1. By Application 15.14.2.2. By End User 15.15. Bangladesh 15.15.1. Pricing Analysis 15.15.2. Market Share Analysis, 2022 15.15.2.1. By Application 15.15.2.2. By End User 15.16. Australia 15.16.1. Pricing Analysis 15.16.2. Market Share Analysis, 2022 15.16.2.1. By Application 15.16.2.2. By End User 15.17. New Zealand 15.17.1. Pricing Analysis 15.17.2. Market Share Analysis, 2022 15.17.2.1. By Application 15.17.2.2. By End User 15.18. China 15.18.1. Pricing Analysis 15.18.2. Market Share Analysis, 2022 15.18.2.1. By Application 15.18.2.2. By End User 15.19. Japan 15.19.1. Pricing Analysis 15.19.2. Market Share Analysis, 2022 15.19.2.1. By Application 15.19.2.2. By End User 15.20. South Korea 15.20.1. Pricing Analysis 15.20.2. Market Share Analysis, 2022 15.20.2.1. By Application 15.20.2.2. By End User 15.21. GCC Countries 15.21.1. Pricing Analysis 15.21.2. Market Share Analysis, 2022 15.21.2.1. By Application 15.21.2.2. By End User 15.22. South Africa 15.22.1. Pricing Analysis 15.22.2. Market Share Analysis, 2022 15.22.2.1. By Application 15.22.2.2. By End User 15.23. Israel 15.23.1. Pricing Analysis 15.23.2. Market Share Analysis, 2022 15.23.2.1. By Application 15.23.2.2. By End User 16. Market Structure Analysis 16.1. Competition Dashboard 16.2. Competition Benchmarking 16.3. Market Share Analysis of Top Players 16.3.1. By Regional 16.3.2. By Application 16.3.3. By End User 17. Competition Analysis 17.1. Competition Deep Dive 17.1.1. Forbes India 17.1.1.1. Overview 17.1.1.2. Product Portfolio 17.1.1.3. Profitability by Market Segments 17.1.1.4. Sales Footprint 17.1.1.5. Strategy Overview 17.1.1.5.1. Marketing Strategy 17.1.2. Schnitger Corporation 17.1.2.1. Overview 17.1.2.2. Product Portfolio 17.1.2.3. Profitability by Market Segments 17.1.2.4. Sales Footprint 17.1.2.5. Strategy Overview 17.1.2.5.1. Marketing Strategy 17.1.3. IBM Corporation 17.1.3.1. Overview 17.1.3.2. Product Portfolio 17.1.3.3. Profitability by Market Segments 17.1.3.4. Sales Footprint 17.1.3.5. Strategy Overview 17.1.3.5.1. Marketing Strategy 17.1.4. Hexagon AB 17.1.4.1. Overview 17.1.4.2. Product Portfolio 17.1.4.3. Profitability by Market Segments 17.1.4.4. Sales Footprint 17.1.4.5. Strategy Overview 17.1.4.5.1. Marketing Strategy 17.1.5. AVEVA Group plc 17.1.5.1. Overview 17.1.5.2. Product Portfolio 17.1.5.3. Profitability by Market Segments 17.1.5.4. Sales Footprint 17.1.5.5. Strategy Overview 17.1.5.5.1. Marketing Strategy 17.1.6. Bosch Software Innovations GmbH 17.1.6.1. Overview 17.1.6.2. Product Portfolio 17.1.6.3. Profitability by Market Segments 17.1.6.4. Sales Footprint 17.1.6.5. Strategy Overview 17.1.6.5.1. Marketing Strategy 17.1.7. Siemens Ltd 17.1.7.1. Overview 17.1.7.2. Product Portfolio 17.1.7.3. Profitability by Market Segments 17.1.7.4. Sales Footprint 17.1.7.5. Strategy Overview 17.1.7.5.1. Marketing Strategy 17.1.8. Tibco Software Inc 17.1.8.1. Overview 17.1.8.2. Product Portfolio 17.1.8.3. Profitability by Market Segments 17.1.8.4. Sales Footprint 17.1.8.5. Strategy Overview 17.1.8.5.1. Marketing Strategy 17.1.9. Microsoft Corporation 17.1.9.1. Overview 17.1.9.2. Product Portfolio 17.1.9.3. Profitability by Market Segments 17.1.9.4. Sales Footprint 17.1.9.5. Strategy Overview 17.1.9.5.1. Marketing Strategy 17.1.10. PTC Inc. 17.1.10.1. Overview 17.1.10.2. Product Portfolio 17.1.10.3. Profitability by Market Segments 17.1.10.4. Sales Footprint 17.1.10.5. Strategy Overview 17.1.10.5.1. Marketing Strategy 18. Assumptions & Acronyms Used 19. Research Methodology
Don't pay for what you don't need
Customize your report by selecting specific countries or regions and save 30%!
Table 1: Global Market Value (US$ Million) Forecast by Region, 2018 to 2033 Table 2: Global Market Value (US$ Million) Forecast by Application, 2018 to 2033 Table 3: Global Market Value (US$ Million) Forecast by End User, 2018 to 2033 Table 4: North America Market Value (US$ Million) Forecast by Country, 2018 to 2033 Table 5: North America Market Value (US$ Million) Forecast by Application, 2018 to 2033 Table 6: North America Market Value (US$ Million) Forecast by End User, 2018 to 2033 Table 7: Latin America Market Value (US$ Million) Forecast by Country, 2018 to 2033 Table 8: Latin America Market Value (US$ Million) Forecast by Application, 2018 to 2033 Table 9: Latin America Market Value (US$ Million) Forecast by End User, 2018 to 2033 Table 10: Western Europe Market Value (US$ Million) Forecast by Country, 2018 to 2033 Table 11: Western Europe Market Value (US$ Million) Forecast by Application, 2018 to 2033 Table 12: Western Europe Market Value (US$ Million) Forecast by End User, 2018 to 2033 Table 13: Eastern Europe Market Value (US$ Million) Forecast by Country, 2018 to 2033 Table 14: Eastern Europe Market Value (US$ Million) Forecast by Application, 2018 to 2033 Table 15: Eastern Europe Market Value (US$ Million) Forecast by End User, 2018 to 2033 Table 16: South Asia and Pacific Market Value (US$ Million) Forecast by Country, 2018 to 2033 Table 17: South Asia and Pacific Market Value (US$ Million) Forecast by Application, 2018 to 2033 Table 18: South Asia and Pacific Market Value (US$ Million) Forecast by End User, 2018 to 2033 Table 19: East Asia Market Value (US$ Million) Forecast by Country, 2018 to 2033 Table 20: East Asia Market Value (US$ Million) Forecast by Application, 2018 to 2033 Table 21: East Asia Market Value (US$ Million) Forecast by End User, 2018 to 2033 Table 22: Middle East and Africa Market Value (US$ Million) Forecast by Country, 2018 to 2033 Table 23: Middle East and Africa Market Value (US$ Million) Forecast by Application, 2018 to 2033 Table 24: Middle East and Africa Market Value (US$ Million) Forecast by End User, 2018 to 2033
Figure 1: Global Market Value (US$ Million) by Application, 2023 to 2033 Figure 2: Global Market Value (US$ Million) by End User, 2023 to 2033 Figure 3: Global Market Value (US$ Million) by Region, 2023 to 2033 Figure 4: Global Market Value (US$ Million) Analysis by Region, 2018 to 2033 Figure 5: Global Market Value Share (%) and BPS Analysis by Region, 2023 to 2033 Figure 6: Global Market Y-o-Y Growth (%) Projections by Region, 2023 to 2033 Figure 7: Global Market Value (US$ Million) Analysis by Application, 2018 to 2033 Figure 8: Global Market Value Share (%) and BPS Analysis by Application, 2023 to 2033 Figure 9: Global Market Y-o-Y Growth (%) Projections by Application, 2023 to 2033 Figure 10: Global Market Value (US$ Million) Analysis by End User, 2018 to 2033 Figure 11: Global Market Value Share (%) and BPS Analysis by End User, 2023 to 2033 Figure 12: Global Market Y-o-Y Growth (%) Projections by End User, 2023 to 2033 Figure 13: Global Market Attractiveness by Application, 2023 to 2033 Figure 14: Global Market Attractiveness by End User, 2023 to 2033 Figure 15: Global Market Attractiveness by Region, 2023 to 2033 Figure 16: North America Market Value (US$ Million) by Application, 2023 to 2033 Figure 17: North America Market Value (US$ Million) by End User, 2023 to 2033 Figure 18: North America Market Value (US$ Million) by Country, 2023 to 2033 Figure 19: North America Market Value (US$ Million) Analysis by Country, 2018 to 2033 Figure 20: North America Market Value Share (%) and BPS Analysis by Country, 2023 to 2033 Figure 21: North America Market Y-o-Y Growth (%) Projections by Country, 2023 to 2033 Figure 22: North America Market Value (US$ Million) Analysis by Application, 2018 to 2033 Figure 23: North America Market Value Share (%) and BPS Analysis by Application, 2023 to 2033 Figure 24: North America Market Y-o-Y Growth (%) Projections by Application, 2023 to 2033 Figure 25: North America Market Value (US$ Million) Analysis by End User, 2018 to 2033 Figure 26: North America Market Value Share (%) and BPS Analysis by End User, 2023 to 2033 Figure 27: North America Market Y-o-Y Growth (%) Projections by End User, 2023 to 2033 Figure 28: North America Market Attractiveness by Application, 2023 to 2033 Figure 29: North America Market Attractiveness by End User, 2023 to 2033 Figure 30: North America Market Attractiveness by Country, 2023 to 2033 Figure 31: Latin America Market Value (US$ Million) by Application, 2023 to 2033 Figure 32: Latin America Market Value (US$ Million) by End User, 2023 to 2033 Figure 33: Latin America Market Value (US$ Million) by Country, 2023 to 2033 Figure 34: Latin America Market Value (US$ Million) Analysis by Country, 2018 to 2033 Figure 35: Latin America Market Value Share (%) and BPS Analysis by Country, 2023 to 2033 Figure 36: Latin America Market Y-o-Y Growth (%) Projections by Country, 2023 to 2033 Figure 37: Latin America Market Value (US$ Million) Analysis by Application, 2018 to 2033 Figure 38: Latin America Market Value Share (%) and BPS Analysis by Application, 2023 to 2033 Figure 39: Latin America Market Y-o-Y Growth (%) Projections by Application, 2023 to 2033 Figure 40: Latin America Market Value (US$ Million) Analysis by End User, 2018 to 2033 Figure 41: Latin America Market Value Share (%) and BPS Analysis by End User, 2023 to 2033 Figure 42: Latin America Market Y-o-Y Growth (%) Projections by End User, 2023 to 2033 Figure 43: Latin America Market Attractiveness by Application, 2023 to 2033 Figure 44: Latin America Market Attractiveness by End User, 2023 to 2033 Figure 45: Latin America Market Attractiveness by Country, 2023 to 2033 Figure 46: Western Europe Market Value (US$ Million) by Application, 2023 to 2033 Figure 47: Western Europe Market Value (US$ Million) by End User, 2023 to 2033 Figure 48: Western Europe Market Value (US$ Million) by Country, 2023 to 2033 Figure 49: Western Europe Market Value (US$ Million) Analysis by Country, 2018 to 2033 Figure 50: Western Europe Market Value Share (%) and BPS Analysis by Country, 2023 to 2033 Figure 51: Western Europe Market Y-o-Y Growth (%) Projections by Country, 2023 to 2033 Figure 52: Western Europe Market Value (US$ Million) Analysis by Application, 2018 to 2033 Figure 53: Western Europe Market Value Share (%) and BPS Analysis by Application, 2023 to 2033 Figure 54: Western Europe Market Y-o-Y Growth (%) Projections by Application, 2023 to 2033 Figure 55: Western Europe Market Value (US$ Million) Analysis by End User, 2018 to 2033 Figure 56: Western Europe Market Value Share (%) and BPS Analysis by End User, 2023 to 2033 Figure 57: Western Europe Market Y-o-Y Growth (%) Projections by End User, 2023 to 2033 Figure 58: Western Europe Market Attractiveness by Application, 2023 to 2033 Figure 59: Western Europe Market Attractiveness by End User, 2023 to 2033 Figure 60: Western Europe Market Attractiveness by Country, 2023 to 2033 Figure 61: Eastern Europe Market Value (US$ Million) by Application, 2023 to 2033 Figure 62: Eastern Europe Market Value (US$ Million) by End User, 2023 to 2033 Figure 63: Eastern Europe Market Value (US$ Million) by Country, 2023 to 2033 Figure 64: Eastern Europe Market Value (US$ Million) Analysis by Country, 2018 to 2033 Figure 65: Eastern Europe Market Value Share (%) and BPS Analysis by Country, 2023 to 2033 Figure 66: Eastern Europe Market Y-o-Y Growth (%) Projections by Country, 2023 to 2033 Figure 67: Eastern Europe Market Value (US$ Million) Analysis by Application, 2018 to 2033 Figure 68: Eastern Europe Market Value Share (%) and BPS Analysis by Application, 2023 to 2033 Figure 69: Eastern Europe Market Y-o-Y Growth (%) Projections by Application, 2023 to 2033 Figure 70: Eastern Europe Market Value (US$ Million) Analysis by End User, 2018 to 2033 Figure 71: Eastern Europe Market Value Share (%) and BPS Analysis by End User, 2023 to 2033 Figure 72: Eastern Europe Market Y-o-Y Growth (%) Projections by End User, 2023 to 2033 Figure 73: Eastern Europe Market Attractiveness by Application, 2023 to 2033 Figure 74: Eastern Europe Market Attractiveness by End User, 2023 to 2033 Figure 75: Eastern Europe Market Attractiveness by Country, 2023 to 2033 Figure 76: South Asia and Pacific Market Value (US$ Million) by Application, 2023 to 2033 Figure 77: South Asia and Pacific Market Value (US$ Million) by End User, 2023 to 2033 Figure 78: South Asia and Pacific Market Value (US$ Million) by Country, 2023 to 2033 Figure 79: South Asia and Pacific Market Value (US$ Million) Analysis by Country, 2018 to 2033 Figure 80: South Asia and Pacific Market Value Share (%) and BPS Analysis by Country, 2023 to 2033 Figure 81: South Asia and Pacific Market Y-o-Y Growth (%) Projections by Country, 2023 to 2033 Figure 82: South Asia and Pacific Market Value (US$ Million) Analysis by Application, 2018 to 2033 Figure 83: South Asia and Pacific Market Value Share (%) and BPS Analysis by Application, 2023 to 2033 Figure 84: South Asia and Pacific Market Y-o-Y Growth (%) Projections by Application, 2023 to 2033 Figure 85: South Asia and Pacific Market Value (US$ Million) Analysis by End User, 2018 to 2033 Figure 86: South Asia and Pacific Market Value Share (%) and BPS Analysis by End User, 2023 to 2033 Figure 87: South Asia and Pacific Market Y-o-Y Growth (%) Projections by End User, 2023 to 2033 Figure 88: South Asia and Pacific Market Attractiveness by Application, 2023 to 2033 Figure 89: South Asia and Pacific Market Attractiveness by End User, 2023 to 2033 Figure 90: South Asia and Pacific Market Attractiveness by Country, 2023 to 2033 Figure 91: East Asia Market Value (US$ Million) by Application, 2023 to 2033 Figure 92: East Asia Market Value (US$ Million) by End User, 2023 to 2033 Figure 93: East Asia Market Value (US$ Million) by Country, 2023 to 2033 Figure 94: East Asia Market Value (US$ Million) Analysis by Country, 2018 to 2033 Figure 95: East Asia Market Value Share (%) and BPS Analysis by Country, 2023 to 2033 Figure 96: East Asia Market Y-o-Y Growth (%) Projections by Country, 2023 to 2033 Figure 97: East Asia Market Value (US$ Million) Analysis by Application, 2018 to 2033 Figure 98: East Asia Market Value Share (%) and BPS Analysis by Application, 2023 to 2033 Figure 99: East Asia Market Y-o-Y Growth (%) Projections by Application, 2023 to 2033 Figure 100: East Asia Market Value (US$ Million) Analysis by End User, 2018 to 2033 Figure 101: East Asia Market Value Share (%) and BPS Analysis by End User, 2023 to 2033 Figure 102: East Asia Market Y-o-Y Growth (%) Projections by End User, 2023 to 2033 Figure 103: East Asia Market Attractiveness by Application, 2023 to 2033 Figure 104: East Asia Market Attractiveness by End User, 2023 to 2033 Figure 105: East Asia Market Attractiveness by Country, 2023 to 2033 Figure 106: Middle East and Africa Market Value (US$ Million) by Application, 2023 to 2033 Figure 107: Middle East and Africa Market Value (US$ Million) by End User, 2023 to 2033 Figure 108: Middle East and Africa Market Value (US$ Million) by Country, 2023 to 2033 Figure 109: Middle East and Africa Market Value (US$ Million) Analysis by Country, 2018 to 2033 Figure 110: Middle East and Africa Market Value Share (%) and BPS Analysis by Country, 2023 to 2033 Figure 111: Middle East and Africa Market Y-o-Y Growth (%) Projections by Country, 2023 to 2033 Figure 112: Middle East and Africa Market Value (US$ Million) Analysis by Application, 2018 to 2033 Figure 113: Middle East and Africa Market Value Share (%) and BPS Analysis by Application, 2023 to 2033 Figure 114: Middle East and Africa Market Y-o-Y Growth (%) Projections by Application, 2023 to 2033 Figure 115: Middle East and Africa Market Value (US$ Million) Analysis by End User, 2018 to 2033 Figure 116: Middle East and Africa Market Value Share (%) and BPS Analysis by End User, 2023 to 2033 Figure 117: Middle East and Africa Market Y-o-Y Growth (%) Projections by End User, 2023 to 2033 Figure 118: Middle East and Africa Market Attractiveness by Application, 2023 to 2033 Figure 119: Middle East and Africa Market Attractiveness by End User, 2023 to 2033 Figure 120: Middle East and Africa Market Attractiveness by Country, 2023 to 2033
Recommendations
Explore Technology Insights
View Reports