Digital Therapeutics Market Outlook (2022 to 2032)

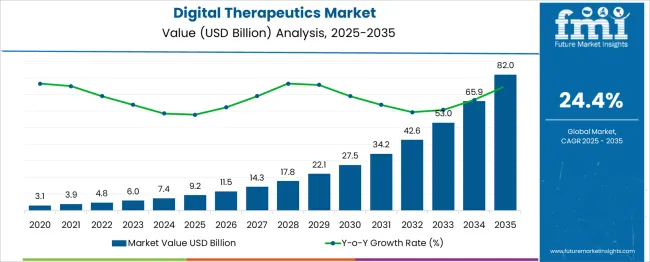
The global Digital Therapeutics Market is set to reach a valuation of USD 4.8 Billion in 2022. Expanding at an impressive 24.4% CAGR over the forecast period, total sales in the digital therapeutics market will reach USD 42.5 Billion by 2032.

Data Points Market Insights
Digital Therapeutics Market Value (2021) USD 3.9 Billion
Estimated Market Value (2022) USD 4.8 Billion
Projected Market Size (2032) USD 42.5 Billion
Value-based CAGR (2022 to 2032) 24.4%
Market Share of Top 5 Countries 44.4%

Digital therapies are software solutions used in the treatment of medical disorders, and they are a new trend emerging from the rapidly progressing mobile health market. These products are similar to consumer wellness applications in which they allow consumers to have more control over their care, but with one major difference: digital therapies are focused on providing enhanced clinical outcomes.

Digital treatments can provide aid to patients at many stages of their health care journey, in addition to addressing specific medical disorders. Through the process, digital treatment (DTx) gather, synthesizes, and analyse patient data so clinical professionals can fabricate treatment options and work with the patient to wean off complications. Better outcomes and fewer medical interventions are the end results.

2017 to 2021 Digital Therapeutics Market Historic Outlook Vs Forecast for 2022 to 2032

The digital therapeutics market grew at a CAGR of 22.0% between 2017 and 2021. The market value for global digital therapeutics held nearly 2.7% of the overall USD 146 Billion digital health market in 2021.

The power of mobile technology to capture and hold people's attention is well known. A rising number of start-ups and established technology players are betting on that power to help people enhance their health outcomes in measurable ways.

These companies are driving software and health-care convergence in ways that can potentially change how the conventional approach of the life sciences industry, which involves both large pharma companies and medical technology or medical device companies, supports the patient health-care journey from beginning to end, spawning a new branch of medicine known as digital therapeutics.

Conventional therapies and treatments are still unable to meet unmet patient demand, while digital medicines offer the potential to do so. Enterprises that use digital therapies to close these gaps, together with substantially shorter product development timetables, may have a considerable edge over traditional life sciences companies.

Rising prevalence of preventable chronic diseases, the pressing need to regulate the cost of health care, a need for safe and accessible workarounds for the treatment of chronic and mental health diseases, a growing focus on predictive, preventative, personalised, and participatory healthcare, increasing investments in digital therapeutics are driving growth in the digital therapeutics market.

Digital therapeutics provide patient-oriented solutions through aspects such as digital behavioural interventions to devise evidence-based solutions on patient data, artificial intelligence and machine learning interventions, mobile health applications, gamification, and virtual reality. Driven by this, the market is expected to grow at a 24.4% CAGR and offer an absolute $ opportunity of nearly USD 1 Billion between 2023 and 2022.

What are the Key Opportunities Propelling the Demand for Digital Therapeutics?

Numerous start-ups and existing technology companies are banking on the ability of mobile technology to help people improve their health in quantifiable ways. Manufacturers are driving software and healthcare convergence in ways that are expected to change the life sciences industry's traditional approach, which includes both large pharma and medical technology or medical device companies, supports the patient's medical journey. This has spawned a new branch of medicine known as digital therapeutics and will provide lucrative opportunities for growth over the forecast period.

Furthermore, digital therapeutics provide pharmaceutical and MedTech businesses with a low-cost approach to differentiate products, especially when compared to the research and development costs generally involved with traditional medicine or medical device.

Many businesses are refocusing their R&D efforts away from core product lines and toward revolutionary innovation. Digital medicines also have the potential to lengthen product life cycles, differentiate in-development goods, and cover market gaps that traditional medicine may not be able to fill. All these factors are expected to augment the growth in the market over the assessment period.

What Factors are Limiting Sales in the Digital Therapeutics Market?

Wearable healthcare faces several challenges, including the fact that the data provided cannot always be used to track, diagnose, and treat health disorders due to ongoing concerns about data accuracy, consistency, and privacy.

Additionally, stakeholder awareness, acceptance, and engagement are issues for many firms that have joined the DTx industry. Most DTx solutions have entered the market with product-centric revenue models and go-to-market strategies to date.

Instead of satisfying unmet requirements of patients and other essential stakeholders across the end-to-end continuum of care, their focus has been on selling more products. As a result, the market for isolated digital point solutions is fragmented, confused, and overcrowded. There is no genuinely comprehensive, patient-centric experience to assist patients in navigating the present complex healthcare system.

As a result of the additional time and money spent on product development, the marketing and commercial sales teams are underp ressure to produce successful go-to-market plans for DTx launch, scale-up, and growth. These factors, together, induce a restrictive impact upon the growth of the overall digital therapeutics market.
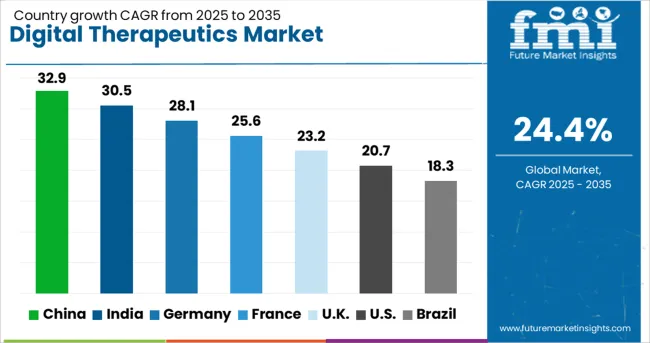
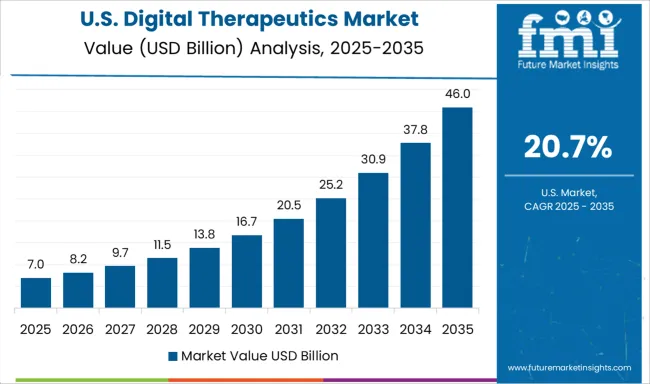
Country-wise Insights

What Makes the USA the Largest Market for Digital Therapeutics?

Rapid Adoption of Connective Technology-Based Medical Equipment Will Fuel Sales of Digital Therapeutics

The U.S. dominated the North America digital therapeutics market in 2021, holding about 90.3% of the market share. As per FMI, the trend is projected to continue over the forecast period. Growth is associated with the high burden of chronic disease in the general population within the country.

Increasing incidence of gastrointestinal and central nervous system diseases is underpinning the demand for digital therapeutics. With growing adoption of telemedicine, integration and adoption of mobile health analytics in the USA, sales are expected to increase over the forecast period.

Why is China Considered a Lucrative Market for Digital Therapeutics?

Growing Demand for Digital Therapeutics for Insomnia Will Augment Growth

China is expected to account for 48.0% of the East Asia digital therapeutics market share in 2022. After the third wave of automation and digital technology integration propelled by the advent of the COVID-19 pandemic, China has established full automation solutions for medical and production facilities.

The local government has joined forces with leading DTx organisations with a joint commitment of 20 billion RMB ($32 billion) in funding support to formalise a massive DTx Industrial Park project, which is a promising indicator of Chinese DTx market progress. The project's details and funding proposal have yet to be revealed, but a newly built DTx Industrial Park in Zhejiang Province will soon serve as the DTx industrial flagship in China.
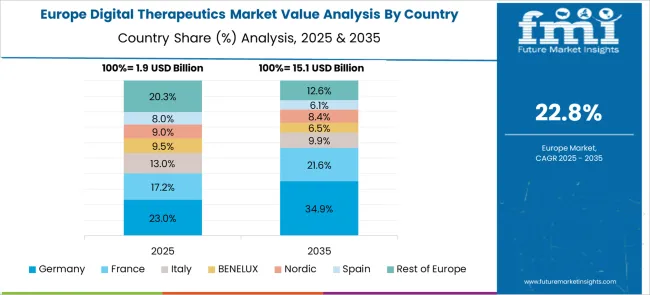
What is Driving the Germany Digital Therapeutics Market?

Rising Awareness Regarding Digital Therapeutics Technology Will Boost Sales in Germany

With a high volume of the disease burden associated with chronic ailments such as cardiovascular diseases, diabetes, and cancer, demand for digital therapeutics in Germany is anticipated to remain high. As per the report, the Germany digital therapeutics market will expand at a 20.6% CAGR over the forecast period.

In 2019, the German Parliament passed the Digital Healthcare Act (DigitaleVersorgung-Gesetz, or DVG), allowing all German doctors to prescribe digital treatments to publicly-insured patients in Germany. This has enhanced the accessibility of safe digital solutions for the treatment of chronic and mental health diseases.

Category-wise Insights

Which Digital Therapeutics Solution is Widely Adopted?

Demand for Combination Therapy Will Gain Traction

Based on solution, the combination therapy segment is projected to account for 68.4% of the total market share in 2022. Combination therapy with biopharmaceuticals, or “smart drugs” offers an exciting way to improve patient adherence and outcomes. Pharmaceutical companies can assist patients in improving their health outcomes by digitising drugs and utilising digital interventions to encourage their proper usage.

Which Applications of Digital Therapeutics are Driving the Market?

Adoption of Digital Therapeutics for Disease Prevention Will Rise

In terms of applications, the prevention segment is forecast to hold 35.8% of the total market share in 2022. For patients at risk of developing more serious ailments, digital therapeutics are routinely used as a prophylactic measure. These prevention measures provide approaches and solutions that could delay the onset of the chronic disease.

Which Indication is More in Focus in the Digital Therapeutics Market?

Sales of Digital Therapeutics for Central Nervous Systems Disorders Will Boost Demand

By indication, sales in the central nervous system disorders segment will increase at a CAGR of 29.2% over the assessment period. Several drugs that are now in use were discovered as a result of drug discovery research intended to treat central nervous system (CNS) illnesses.

However, not all drugs can relieve patients of the symptoms of their disorders, and CNS dysfunction is still a medical area with many unmet needs. Medical solutions which utilize digital technologies can address these unmet needs.

Which Business Model is Most Preferred For Digital Therapeutics?

Sales of Digital Therapeutics Direct to Patients Will Gain Momentum

Based on distribution channel, the direct-to-patients/consumers segment will hold about 60.1% of the total market share over the forecast period. With the products being sold directly to the consumer, the availability of mobile health solutions provide customers with solutions linked to enhanced patient compliance and better clinical outcomes.
Competitive Landscape

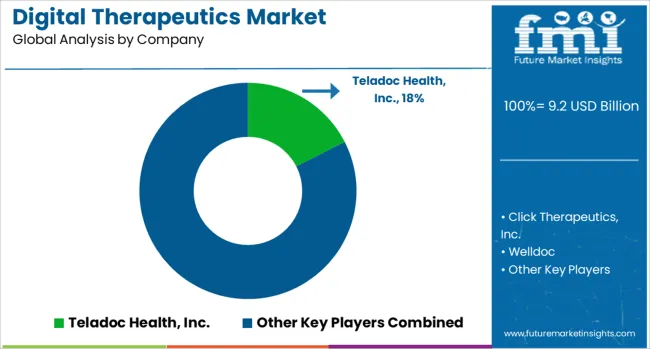
The market for digital therapeutics is a fragmented. With the emergence of start-ups and other market players, the global market is likely to witness the heavy competition. Companies are aiming to launch digital health campaigns and software solutions for a comprehensive patient care regimen. For instance:

  • Teladoc Health in February 2022 launched the “Chronic Care Complete” management solution aimed at improving health outcomes for patients living with chronic conditions.
  • • In September 2020, Boehringer Ingelheim and Click Therapeutics agreed to collaborate on the development and commercialization of CT-155, a novel prescription digital therapy for schizophrenia.

Report Scope as per Digital Therapeutics Industry Analysis

Attribute Details
Forecast Period 2022 to 2032
Historical Data Available for 2017 to 2021
Market Analysis USD Billion for Value
Key Regions Covered North America, Latin America, Europe, South Asia, East Asia, Oceania, Middle East and Africa (MEA)
Key Countries Covered The USA., Canada, Brazil, Mexico, Argentina, Germany, Italy, France, Spain, the UK., Russia, BENELUX, China, Japan, South Korea, India, Indonesia, Thailand, Malaysia, Australia, New Zealand, GCC Countries and Turkey
Key Companies Covered Teladoc Health ;Inc.; Click Therapeutics, Inc.; Welldoc; HYGIEIA; DarioHealth Corp; BigHealth; Orexo AB; Akili Interactive Labs, Inc.; Freespira; Voluntis; Kaia Health; Kaiku Health; Theranica Bio-Electronics Ltd.; Propeller Health; Orexo US, Inc.; TALi Digital Limited; Limbix Health, Inc.
Key Market Segments Covered Solution, Application, Indication, Business Model and Region

Key Market Segments Covered in Digital Therapeutics Industry Research

By Solution:

  • Monotherapy
  • Combination Therapy

By Application:

  • Prevention
  • Management
  • Treatment

By Indication:

  • Diabetes
  • Obesity
  • Gastrointestinal Disorders
  • Cardiovascular Disease
  • Central Nervous Systems
  • Others

By Business Model:

  • Direct to consumer
  • Fee-for-service

By Region:

  • North America
  • Latin America
  • Europe
  • South Asia
  • East Asia
  • Oceania
  • Middle East & Africa (MEA)

Table of Content

  • 1. Executive Summary
  • 2. Market Overview
  • 3. Key Market Trends
  • 4. Key Success Factors
  • 5. Market Background
  • 6. Global Market Demand (in Value or Size in USD Billion) Analysis 2017 to 2021 and Forecast 2022 to 2032
  • 7. Global Market Analysis 2017 to 2021 and Forecast 2022 to 2032, By Solution
    • 7.1. Monotherapy
    • 7.2. Combination Therapy
  • 8. Global Market Analysis 2017 to 2021 and Forecast 2022 to 2032, By Application
    • 8.1. Prevention
    • 8.2. Management
    • 8.3. Treatment
  • 9. Global Market Analysis 2017 to 2021 and Forecast 2022 to 2032, By Indication
    • 9.1. Diabetes
    • 9.2. Obesity
    • 9.3. Gastrointestinal Disorders
    • 9.4. Cardiovascular Disease
    • 9.5. Central Nervous Systems
    • 9.6. Others
  • 10. Global Market Analysis 2017 to 2021 and Forecast 2022 to 2032, By Business Model
    • 10.1. Direct to consumer
    • 10.2. Fee-for-service
  • 11. Global Market Analysis 2017 to 2021 and Forecast 2022 to 2032, By Region
    • 11.1. North America
    • 11.2. Latin America
    • 11.3. Europe
    • 11.4. East Asia
    • 11.5. South Asia
    • 11.6. Oceania
    • 11.7. Middle East and Africa (MEA)
  • 12. North America Market Analysis 2017 to 2021 and Forecast 2022 to 2032
  • 13. Latin America Market Analysis 2017 to 2021 and Forecast 2022 to 2032
  • 14. Europe Market Analysis 2017 to 2021 and Forecast 2022 to 2032
  • 15. East Asia Market Analysis 2017 to 2021 and Forecast 2022 to 2032
  • 16. South Asia Market Analysis 2017 to 2021 and Forecast 2022 to 2032
  • 17. Oceania Market Analysis 2017 to 2021 and Forecast 2022 to 2032
  • 18. Middle East and Africa (MEA) Market Analysis 2017 to 2021 and Forecast 2022 to 2032
  • 19. Market Structure Analysis
  • 20. Competition Analysis
    • 20.1. Teladoc Health, Inc.
    • 20.2. Click Therapeutics, Inc.
    • 20.3. Welldoc
    • 20.4. HYGIEIA
    • 20.5. DarioHealth Corp
    • 20.6. BigHealth
    • 20.7. Orexo AB
    • 20.8. Akili Interactive Labs, Inc.
    • 20.9. Freespira
    • 20.10. Voluntis
    • 20.11. Kaia Health
    • 20.12. Kaiku Health
    • 20.13. Theranica Bio-Electronics Ltd.
    • 20.14. Propeller Health
    • 20.15. Orexo US, Inc.
    • 20.16. TALi Digital Limited
    • 20.17. Limbix Health, Inc.
  • 21. Assumptions and Acronyms Used
  • 22. Research Methodology

List of Tables

Table 01: Global Market Analysis 2017–2021 and Forecast 2022-2032

Table 02: Global Market Analysis 2017–2021 and Forecast 2022-2032, by Solution

Table 03: Global Market Analysis 2017–2021 and Forecast 2022-2032, by Application

Table 04: Global Market Analysis 2017–2021 and Forecast 2022-2032, by Indication

Table 05: Global Market Analysis 2017–2021 and Forecast 2022-2032, by Business Model

Table 06: Global Market Application (US$ Bn) Analysis 2017–2021 and Forecast 2022-2032, by Region

Table 07: North America Market Application (US$ Bn) Analysis 2017-2021 and Forecast 2022-2032, by Country

Table 08: North America Market Analysis 2017–2021 and Forecast 2022-2032, by Solution

Table 09: North America Market Analysis 2017–2021 and Forecast 2022-2032, by Solution

Table 10: North America Market Application (US$ Bn) Analysis 2017-2021 and Forecast 2022-2032, by Application

Table 11: North America Market Application (US$ Bn) Analysis 2017-2021 and Forecast 2022-2032, by Indication

Table 12: North America Market Application (US$ Bn) Analysis 2017-2021 and Forecast 2022-2032, by Business Model

Table 13: Latin America Market Application (US$ Bn) Analysis 2017-2021 and Forecast 2022-2032, by Country

Table 14: Latin America Market Analysis 2017–2021 and Forecast 2022-2032, by Solution

Table 15: Latin America Market Analysis 2017–2021 and Forecast 2022-2032, by Solution

Table 16: Latin America Market Application (US$ Bn) Analysis 2017-2021 and Forecast 2022-2032, by Application

Table 17: Latin America Market Application (US$ Bn) Analysis 2017-2021 and Forecast 2022-2032, by Indication

Table 18: Latin America Market Application (US$ Bn) Analysis 2017-2021 and Forecast 2022-2032, by Business Model

Table 19: Europe Market Application (US$ Bn) Analysis 2017-2021 and Forecast 2022-2032, by Country

Table 20: Europe Market Analysis 2017–2021 and Forecast 2022-2032, by Solution

Table 21: Europe Market Analysis 2017–2021 and Forecast 2022-2032, by Solution

Table 22: Europe Market Application (US$ Bn) Analysis 2017-2021 and Forecast 2022-2032, by Application

Table 23: Europe Market Application (US$ Bn) Analysis 2017-2021 and Forecast 2022-2032, by Indication

Table 24: Europe Market Application (US$ Bn) Analysis 2017-2021 and Forecast 2022-2032, by Business Model

Table 25: South Asia Market Application (US$ Bn) Analysis 2017-2021 and Forecast 2022-2032, by Country

Table 26: South Asia Market Analysis 2017–2021 and Forecast 2022-2032, by Solution

Table 27: South Asia Market Analysis 2017–2021 and Forecast 2022-2032, by Solution

Table 28: South Asia Market Application (US$ Bn) Analysis 2017-2021 and Forecast 2022-2032, by Application

Table 29: South Asia Market Application (US$ Bn) Analysis 2017-2021 and Forecast 2022-2032, by Indication

Table 30: South Asia Market Application (US$ Bn) Analysis 2017-2021 and Forecast 2022-2032, by Business Model

Table 31: East Asia Market Application (US$ Bn) Analysis 2017-2021 and Forecast 2022-2032, by Country

Table 32: East Asia Market Analysis 2017–2021 and Forecast 2022-2032, by Solution

Table 33: East Asia Market Analysis 2017–2021 and Forecast 2022-2032, by Solution

Table 34: East Asia Market Application (US$ Bn) Analysis 2017-2021 and Forecast 2022-2032, by Application

Table 35: East Asia Market Application (US$ Bn) Analysis 2017-2021 and Forecast 2022-2032, by Indication

Table 36: East Asia Market Application (US$ Bn) Analysis 2017-2021 and Forecast 2022-2032, by Business Model

Table 37: Oceania Market Application (US$ Bn) Analysis 2017-2021 and Forecast 2022-2032, by Country

Table 38: Oceania Market Analysis 2017–2021 and Forecast 2022-2032, by Solution

Table 39: Oceania Market Analysis 2017–2021 and Forecast 2022-2032, by Solution

Table 40: Oceania Market Application (US$ Bn) Analysis 2017-2021 and Forecast 2022-2032, by Application

Table 41: Oceania Market Application (US$ Bn) Analysis 2017-2021 and Forecast 2022-2032, by Indication

Table 42: Oceania Market Application (US$ Bn) Analysis 2017-2021 and Forecast 2022-2032, by Business Model

Table 43: MEA Market Application (US$ Bn) Analysis 2017-2021 and Forecast 2022-2032, by Country

Table 44: MEA Market Analysis 2017–2021 and Forecast 2022-2032, by Solution

Table 45: MEA Market Analysis 2017–2021 and Forecast 2022-2032, by Solution

Table 46: MEA Market Application (US$ Bn) Analysis 2017-2021 and Forecast 2022-2032, by Application

Table 47: MEA Market Application (US$ Bn) Analysis 2017-2021 and Forecast 2022-2032, by Indication

Table 48: MEA Market Application (US$ Bn) Analysis 2017-2021 and Forecast 2022-2032, by Business Model

List of Figures

Figure 01: Global Market Value Share, by Solution 2022(E)

Figure 02: Global Market Value Share, by Application 2022(E)

Figure 03: Global Market Value Share, by Indication 2022(E)

Figure 04: Global Market Value Share, by Business Model 2022(E)

Figure 05: Global Market Value (US$ Mn) Analysis, 2017–2021

Figure 06: Global Market Value (US$ Mn) Forecast, 2021–2032

Figure 07: Global Market Absolute $ Opportunity, 2022 - 2032

Figure 08: Global Market Value Share (%) Analysis 2022 & 2032, by Solution

Figure 09: Global Market Y-o-Y Growth (%) Analysis 2022-2032, by Solution

Figure 10: Global Market Attractiveness Analysis, by Solution

Figure 11: Global Market Value Share (%) Analysis 2022 & 2032, by Application

Figure 12: Global Market Y-o-Y Growth (%) Analysis 2022-2032, by Application

Figure 13: Global Market Attractiveness Analysis, by Application

Figure 14: Global Market Value Share (%) Analysis 2022 & 2032, by Indication

Figure 15: Global Market Y-o-Y Growth (%) Analysis 2022-2032, by Indication

Figure 16: Global Market Attractiveness Analysis, by Indication

Figure 17: Global Market Value Share (%) Analysis 2022 & 2032, by Business Model

Figure 18: Global Market Y-o-Y Growth (%) Analysis 2022-2032, by Business Model

Figure 19: Global Market Attractiveness Analysis, by Business Model

Figure 20: Global Market Share, by Region, 2022 & 2032

Figure 21: Global Market Attractiveness Analysis by Region, 2022-2032

Figure 22: Global Market Attractiveness Analysis by Region, 2021-2031

Figure 23: North America Market Share, by Country (2022)

Figure 24: North America Market Share, by Solution (2022)

Figure 25: North America Market Share, by Application (2022)

Figure 26: North America Market Share, by Indication (2022)

Figure 27: North America Market Share, by Business Model (2022)

Figure 28: North America Market Application (US$ Mn) Analysis, 2017-2021

Figure 29: North America Market Application (US$ Mn) & Y-o-Y Growth (%) Analysis, 2022-2032

Figure 30: North America Market Attractiveness Analysis, by Country

Figure 31: North America Market Attractiveness Analysis, by Solution

Figure 32: North America Market Attractiveness Analysis, by Application

Figure 33: North America Market Attractiveness Analysis, by Indication

Figure 34: North America Market Attractiveness Analysis, by Business Model

Figure 35: Latin America Market Share, by Country (2022)

Figure 36: Latin America Market Share, by Solution (2022)

Figure 37: Latin America Market Share, by Application (2022)

Figure 38: Latin America Market Share, by Indication (2022)

Figure 39: Latin America Market Share, by Business Model (2022)

Figure 40: Latin America Market Application (US$ Mn) Analysis, 2017-2021

Figure 41: Latin America Market Application (US$ Mn) & Y-o-Y Growth (%) Analysis, 2022-2032

Figure 42: Latin America Market Attractiveness Analysis, by Country

Figure 43: Latin America Market Attractiveness Analysis, by Solution

Figure 44: Latin America Market Attractiveness Analysis, by Application

Figure 45: Latin America Market Attractiveness Analysis, by Indication

Figure 46: Latin America Market Attractiveness Analysis, by Business Model

Figure 47: Europe Market Share, by Country (2022)

Figure 48: Europe Market Share, by Solution (2022)

Figure 49: Europe Market Share, by Application (2022)

Figure 50: Europe Market Share, by Indication (2022)

Figure 51: Europe Market Share, by Business Model (2022)

Figure 52: Europe Market Application (US$ Mn) Analysis, 2017-2021

Figure 53: Europe Market Application (US$ Mn) & Y-o-Y Growth (%) Analysis, 2022-2032

Figure 54: Europe Market Attractiveness Analysis, by Country

Figure 55: Europe Market Attractiveness Analysis, by Solution

Figure 56: Europe Market Attractiveness Analysis, by Application

Figure 57: Europe Market Attractiveness Analysis, by Indication

Figure 58: Europe Market Attractiveness Analysis, by Business Model

Figure 59: South Asia Market Share, by Country (2022)

Figure 60: South Asia Market Share, by Solution (2022)

Figure 61: South Asia Market Share, by Application (2022)

Figure 62: South Asia Market Share, by Indication (2022)

Figure 63: South Asia Market Share, by Business Model (2022)

Figure 64: South Asia Market Application (US$ Mn) Analysis, 2017-2021

Figure 65: South Asia Market Application (US$ Mn) & Y-o-Y Growth (%) Analysis, 2022-2032

Figure 66: South Asia Market Attractiveness Analysis, by Country

Figure 67: South Asia Market Attractiveness Analysis, by Solution

Figure 68: South Asia Market Attractiveness Analysis, by Application

Figure 69: South Asia Market Attractiveness Analysis, by Indication

Figure 70: South Asia Market Attractiveness Analysis, by Business Model

Figure 71: East Asia Market Share, by Country (2022)

Figure 72: East Asia Market Share, by Solution (2022)

Figure 73: East Asia Market Share, by Application (2022)

Figure 74: East Asia Market Share, by Indication (2022)

Figure 75: East Asia Market Share, by Business Model (2022)

Figure 76: East Asia Market Application (US$ Mn) Analysis, 2017-2021

Figure 77: East Asia Market Application (US$ Mn) & Y-o-Y Growth (%) Analysis, 2022-2032

Figure 78: East Asia Market Attractiveness Analysis, by Country

Figure 79: East Asia Market Attractiveness Analysis, by Solution

Figure 80: East Asia Market Attractiveness Analysis, by Application

Figure 81: East Asia Market Attractiveness Analysis, by Indication

Figure 82: East Asia Market Attractiveness Analysis, by Business Model

Figure 83: Oceania Market Share, by Country (2022)

Figure 84: Oceania Market Share, by Solution (2022)

Figure 85: Oceania Market Share, by Application (2022)

Figure 86: Oceania Market Share, by Indication (2022)

Figure 87: Oceania Market Share, by Business Model (2022)

Figure 88: Oceania Market Application (US$ Mn) Analysis, 2017-2021

Figure 89: Oceania Market Application (US$ Mn) & Y-o-Y Growth (%) Analysis, 2022-2032

Figure 90: Oceania Market Attractiveness Analysis, by Country

Figure 91: Oceania Market Attractiveness Analysis, by Solution

Figure 92: Oceania Market Attractiveness Analysis, by Application

Figure 93: Oceania Market Attractiveness Analysis, by Indication

Figure 94: Oceania Market Attractiveness Analysis, by Business Model

Figure 95: MEA Market Share, by Country (2022)

Figure 96: MEA Market Share, by Solution (2022)

Figure 97: MEA Market Share, by Application (2022)

Figure 98: MEA Market Share, by Indication (2022)

Figure 99: MEA Market Share, by Business Model (2022)

Figure 100: MEA Market Application (US$ Mn) Analysis, 2017-2021

Figure 101: MEA Market Application (US$ Mn) & Y-o-Y Growth (%) Analysis, 2022-2032

Figure 102: MEA Market Attractiveness Analysis, by Country

Figure 103: MEA Market Attractiveness Analysis, by Solution

Figure 104: MEA Market Attractiveness Analysis, by Application

Figure 105: MEA Market Attractiveness Analysis, by Indication

Figure 106: MEA Market Attractiveness Analysis, by Business Model

Figure 107: Global Market Value Proportion Analysis, by Countries, 2022

Figure 108: Global Market, Global Vs. Country Growth Y-o-Y (%) Comparison, 2022-2032

Figure 109: U.S. Market Value Proportion Analysis, 2022

Figure 110: Global Vs. U.S. Growth Comparison

Figure 111: U.S. Market Share Analysis (%) by Solution, 2022 & 2032

Figure 112: U.S. Market Share Analysis (%) by Application, 2022 & 2032

Figure 113: U.S. Market Share Analysis (%) by Indication, 2022 & 2032

Figure 114: U.S. Market Share Analysis (%) by Business Model, 2022 & 2032

Figure 115: Canada Market Value Proportion Analysis, 2022

Figure 116: Global Vs. Canada Growth Comparison

Figure 117: Canada Market Share Analysis (%) by Solution, 2022 & 2032

Figure 118: Canada Market Share Analysis (%) by Application, 2022 & 2032

Figure 119: Canada Market Share Analysis (%) by Indication, 2022 & 2032

Figure 120: Canada Market Share Analysis (%) by Business Model, 2022 & 2032

Figure 121: Brazil Market Value Proportion Analysis, 2022

Figure 122: Global Vs. Brazil Growth Comparison

Figure 123: Brazil Market Share Analysis (%) by Solution, 2022 & 2032

Figure 124: Brazil Market Share Analysis (%) by Application, 2022 & 2032

Figure 125: Brazil Market Share Analysis (%) by Indication, 2022 & 2032

Figure 126: Brazil Market Share Analysis (%) by Business Model, 2022 & 2032

Figure 127: Mexico Market Value Proportion Analysis, 2022

Figure 128: Global Vs. Mexico Growth Comparison

Figure 129: Mexico Market Share Analysis (%) by Solution, 2022 & 2032

Figure 130: Mexico Market Share Analysis (%) by Application, 2022 & 2032

Figure 131: Mexico Market Share Analysis (%) by Indication, 2022 & 2032

Figure 132: Mexico Market Share Analysis (%) by Business Model, 2022 & 2032

Figure 133: Germany Market Value Proportion Analysis, 2022

Figure 134: Global Vs. Germany Growth Comparison

Figure 135: Germany Market Share Analysis (%) by Solution, 2022 & 2032

Figure 136: Germany Market Share Analysis (%) by Application, 2022 & 2032

Figure 137: Germany Market Share Analysis (%) by Indication, 2022 & 2032

Figure 138: Germany Market Share Analysis (%) by Business Model, 2022 & 2032

Figure 139: Italy Market Value Proportion Analysis, 2022

Figure 140: Global Vs. Italy Growth Comparison

Figure 141: Italy Market Share Analysis (%) by Solution, 2022 & 2032

Figure 142: Italy Market Share Analysis (%) by Application, 2022 & 2032

Figure 143: Italy Market Share Analysis (%) by Indication, 2022 & 2032

Figure 144: Italy Market Share Analysis (%) by Business Model, 2022 & 2032

Figure 145: France Market Value Proportion Analysis, 2022

Figure 146: Global Vs. France Growth Comparison

Figure 147: France Market Share Analysis (%) by Solution, 2022 & 2032

Figure 148: France Market Share Analysis (%) by Application, 2022 & 2032

Figure 149: France Market Share Analysis (%) by Indication, 2022 & 2032

Figure 150: France Market Share Analysis (%) by Business Model, 2022 & 2032

Figure 151: U.K Market Value Proportion Analysis, 2022

Figure 152: Global Vs. U.K Growth Comparison

Figure 153: U.K Market Share Analysis (%) by Solution, 2022 & 2032

Figure 154: U.K Market Share Analysis (%) by Application, 2022 & 2032

Figure 155: U.K Market Share Analysis (%) by Indication, 2022 & 2032

Figure 156: U.K Market Share Analysis (%) by Business Model, 2022 & 2032

Figure 157: Spain Market Value Proportion Analysis, 2022

Figure 158: Global Vs. Spain Growth Comparison

Figure 159: Spain Market Share Analysis (%) by Solution, 2022 & 2032

Figure 160: Spain Market Share Analysis (%) by Application, 2022 & 2032

Figure 161: Spain Market Share Analysis (%) by Indication, 2022 & 2032

Figure 162: Spain Market Share Analysis (%) by Business Model, 2022 & 2032

Figure 163: BENELUX Market Value Proportion Analysis, 2022

Figure 164: Global Vs. BENELUX Growth Comparison

Figure 165: BENELUX Market Share Analysis (%) by Solution, 2022 & 2032

Figure 166: BENELUX Market Share Analysis (%) by Application, 2022 & 2032

Figure 167: BENELUX Market Share Analysis (%) by Indication, 2022 & 2032

Figure 168: BENELUX Market Share Analysis (%) by Business Model, 2022 & 2032

Figure 169: Russia Market Value Proportion Analysis, 2022

Figure 170: Global Vs. Russia Growth Comparison

Figure 171: Russia Market Share Analysis (%) by Solution, 2022 & 2032

Figure 172: Russia Market Share Analysis (%) by Application, 2022 & 2032

Figure 173: Russia Market Share Analysis (%) by Indication, 2022 & 2032

Figure 174: Russia Market Share Analysis (%) by Business Model, 2022 & 2032

Figure 175: India Market Value Proportion Analysis, 2022

Figure 176: Global Vs. India Growth Comparison

Figure 177: India Market Share Analysis (%) by Solution, 2022 & 2032

Figure 178: India Market Share Analysis (%) by Application, 2022 & 2032

Figure 179: India Market Share Analysis (%) by Indication, 2022 & 2032

Figure 180: India Market Share Analysis (%) by Business Model, 2022 & 2032

Figure 181: Thailand Market Value Proportion Analysis, 2022

Figure 182: Global Vs. Thailand Growth Comparison

Figure 183: Thailand Market Share Analysis (%) by Solution, 2022 & 2032

Figure 184: Thailand Market Share Analysis (%) by Application, 2022 & 2032

Figure 185: Thailand Market Share Analysis (%) by Indication, 2022 & 2032

Figure 186: Thailand Market Share Analysis (%) by Business Model, 2022 & 2032

Figure 187: Malaysia Market Value Proportion Analysis, 2022

Figure 188: Global Vs. Malaysia Growth Comparison

Figure 189: Malaysia Market Share Analysis (%) by Solution, 2022 & 2032

Figure 190: Malaysia Market Share Analysis (%) by Application, 2022 & 2032

Figure 191: Malaysia Market Share Analysis (%) by Indication, 2022 & 2032

Figure 192: Malaysia Market Share Analysis (%) by Business Model, 2022 & 2032

Figure 193: Indonesia Market Value Proportion Analysis, 2022

Figure 194: Global Vs. Indonesia Growth Comparison

Figure 195: Indonesia Market Share Analysis (%) by Solution, 2022 & 2032

Figure 196: Indonesia Market Share Analysis (%) by Application, 2022 & 2032

Figure 197: Indonesia Market Share Analysis (%) by Indication, 2022 & 2032

Figure 198: Indonesia Market Share Analysis (%) by Business Model, 2022 & 2032

Figure 199: China Market Value Proportion Analysis, 2022

Figure 200: Global Vs. China Growth Comparison

Figure 201: China Market Share Analysis (%) by Solution, 2022 & 2032

Figure 202: China Market Share Analysis (%) by Application, 2022 & 2032

Figure 203: China Market Share Analysis (%) by Indication, 2022 & 2032

Figure 204: China Market Share Analysis (%) by Business Model, 2022 & 2032

Figure 205: Japan Market Value Proportion Analysis, 2022

Figure 206: Global Vs. Japan Growth Comparison

Figure 207: Japan Market Share Analysis (%) by Solution, 2022 & 2032

Figure 208: Japan Market Share Analysis (%) by Application, 2022 & 2032

Figure 209: Japan Market Share Analysis (%) by Indication, 2022 & 2032

Figure 210: Japan Market Share Analysis (%) by Business Model, 2022 & 2032

Figure 211: South Korea Market Value Proportion Analysis, 2022

Figure 212: Global Vs. South Korea Growth Comparison

Figure 213: South Korea Market Share Analysis (%) by Solution, 2022 & 2032

Figure 214: South Korea Market Share Analysis (%) by Application, 2022 & 2032

Figure 215: South Korea Market Share Analysis (%) by Indication, 2022 & 2032

Figure 216: South Korea Market Share Analysis (%) by Business Model, 2022 & 2032

Figure 217: Australia Market Value Proportion Analysis, 2022

Figure 218: Global Vs. Australia Growth Comparison

Figure 219: Australia Market Share Analysis (%) by Solution, 2022 & 2032

Figure 220: Australia Market Share Analysis (%) by Application, 2022 & 2032

Figure 221: Australia Market Share Analysis (%) by Indication, 2022 & 2032

Figure 222: Australia Market Share Analysis (%) by Business Model, 2022 & 2032

Figure 223: New Zealand Market Value Proportion Analysis, 2022

Figure 224: Global Vs. New Zealand Growth Comparison

Figure 225: New Zealand Market Share Analysis (%) by Solution, 2022 & 2032

Figure 226: New Zealand Market Share Analysis (%) by Application, 2022 & 2032

Figure 227: New Zealand Market Share Analysis (%) by Indication, 2022 & 2032

Figure 228: New Zealand Market Share Analysis (%) by Business Model, 2022 & 2032

Figure 229: GCC Countries Market Value Proportion Analysis, 2022

Figure 230: Global Vs. GCC Countries Growth Comparison

Figure 231: GCC Countries Market Share Analysis (%) by Solution, 2022 & 2032

Figure 232: GCC Countries Market Share Analysis (%) by Application, 2022 & 2032

Figure 233: GCC Countries Market Share Analysis (%) by Indication, 2022 & 2032

Figure 234: GCC Countries Market Share Analysis (%) by Business Model, 2022 & 2032

Figure 235: Turkey Market Value Proportion Analysis, 2022

Figure 236: Global Vs. Turkey Growth Comparison

Figure 237: Turkey Market Share Analysis (%) by Solution, 2022 & 2032

Figure 238: Turkey Market Share Analysis (%) by Application, 2022 & 2032

Figure 239: Turkey Market Share Analysis (%) by Indication, 2022 & 2032

Figure 240: Turkey Market Share Analysis (%) by Business Model, 2022 & 2032

Figure 241: Israel Market Value Proportion Analysis, 2022

Figure 242: Global Vs. Israel Growth Comparison

Figure 243: Israel Market Share Analysis (%) by Solution, 2022 & 2032

Figure 244: Israel Market Share Analysis (%) by Application, 2022 & 2032

Figure 245: Israel Market Share Analysis (%) by Indication, 2022 & 2032

Figure 246: Israel Market Share Analysis (%) by Business Model, 2022 & 2032

Figure 247: South Africa Market Value Proportion Analysis, 2022

Figure 248: Global Vs. South Africa Growth Comparison

Figure 249: South Africa Market Share Analysis (%) by Solution, 2022 & 2032

Figure 250: South Africa Market Share Analysis (%) by Application, 2022 & 2032

Figure 251: South Africa Market Share Analysis (%) by Indication, 2022 & 2032

Figure 252: South Africa Market Share Analysis (%) by Business Model, 2022 & 2032

Frequently Asked Questions

How much is the global digital therapeutics market currently worth?

The global digital therapeutics market is worth USD 4.8 Billion in 2022 and is set to expand 8.9X over the next ten years.

What is the sales forecast for global digital therapeutics through 2032?

The global digital therapeutics market is expected to reach USD 42.5 Billion by the end of 2032, with sales revenue expected to register a 24.4% CAGR.

What are the key trends shaping the global digital therapeutics industry?

Some of the significant trends in this market are the reimagined regulatory pathway for software as a medical device (SaMD) products, the rising adoption of medical technology, and the global prevalence of chronic and mental diseases.

Which are the top 5 countries driving demand for global digital therapeutics?

Canada, the USA, France, the UK., and Italy are expected to drive demand for global digital therapeutics products.

What is the USA market outlook for global digital therapeutics?

The U.S. is one of the key markets for global digital therapeutics, accounting for about 86.2% of the overall North American market during the forecast period.

Which are key countries for the global digital therapeutics market?

The USA, Germany and Canada are the key producers in the global digital therapeutics market space.

Explore Similar Insights

Future Market Insights

Digital Therapeutics Market