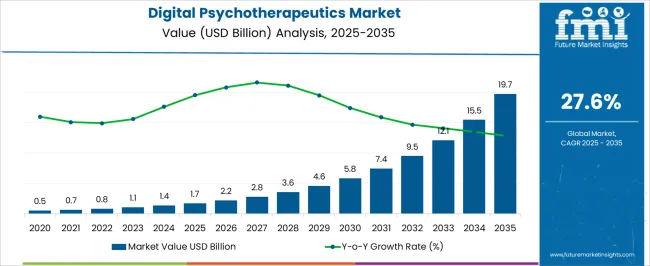
The Digital Psychotherapeutics Market is estimated to be valued at USD 1.7 billion in 2025 and is projected to reach USD 19.7 billion by 2035, registering a compound annual growth rate (CAGR) of 27.6% over the forecast period.
| Metric | Value |
|---|---|
| Digital Psychotherapeutics Market Estimated Value in (2025 E) | USD 1.7 billion |
| Digital Psychotherapeutics Market Forecast Value in (2035 F) | USD 19.7 billion |
| Forecast CAGR (2025 to 2035) | 27.6% |
The digital psychotherapeutics market is experiencing rapid adoption supported by the rising prevalence of mental health conditions, growing awareness of accessible therapy formats, and the shift toward evidence based digital solutions. The ability to deliver scalable, personalized, and cost efficient treatment pathways has positioned digital psychotherapeutics as an integral part of modern healthcare systems.
Integration with smartphones, wearable devices, and telemedicine platforms has enhanced patient engagement while ensuring real time tracking of therapeutic progress. Regulatory acceptance and reimbursement frameworks in several regions are further accelerating adoption.
As healthcare providers focus on reducing treatment gaps and patients increasingly seek stigma free, convenient care, the market outlook remains highly favorable with continued opportunities for innovation and broader application integration.
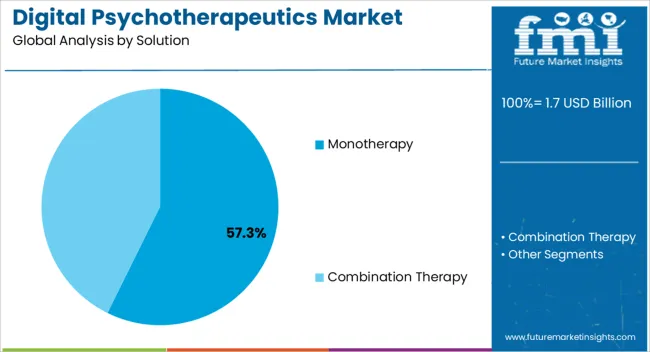
The monotherapy solution segment is projected to hold 57.30% of total market revenue by 2025, making it the leading solution type. Its growth is being driven by the increasing ability of digital interventions to provide stand alone treatment pathways without the need for adjunctive therapies.
This segment has benefited from strong clinical validation, user friendly interfaces, and scalability that enables widespread deployment across diverse patient groups. Improved accessibility for individuals seeking low cost alternatives to in person therapy and enhanced adherence monitoring through digital platforms have also strengthened demand.
As evidence supporting the efficacy of monotherapy applications continues to grow, this solution is anticipated to maintain its leadership within the digital psychotherapeutics market.
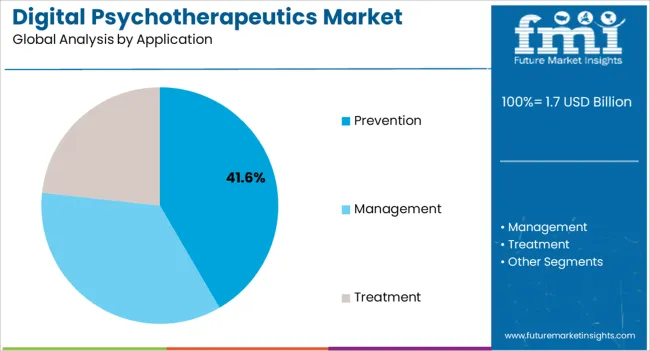
The prevention application segment is expected to account for 41.60% of total revenue by 2025, positioning it as the leading application area. Growth is being supported by increasing awareness of early intervention, lifestyle modification, and proactive management of mental health risks.
Preventive digital psychotherapeutics have been widely adopted to address stress, anxiety, and lifestyle related challenges before progression into severe disorders. The ability to integrate self management tools, cognitive training, and continuous feedback has made prevention focused solutions attractive to both individuals and healthcare systems.
As employers, insurers, and governments emphasize preventive care to reduce long term healthcare costs, this segment is likely to see sustained expansion.
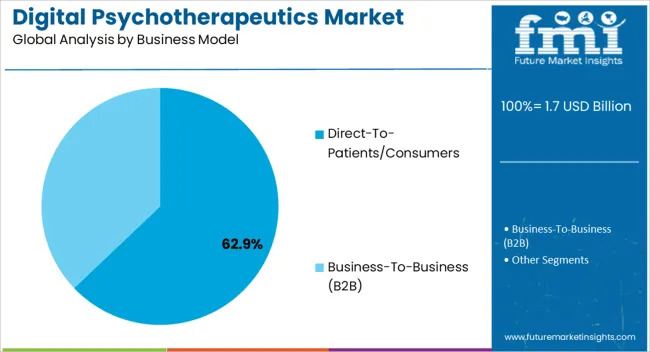
The direct to patients or consumers business model accounts for 62.90% of the total market revenue by 2025, making it the most prominent model. Its dominance is attributed to growing consumer acceptance of app based and subscription based therapeutic platforms that bypass traditional clinical channels.
The convenience of on demand access, flexible pricing, and anonymity in therapy delivery have strengthened adoption across diverse demographics. Increased smartphone penetration and digital literacy have enabled direct engagement with end users, enhancing retention and compliance.
Furthermore, the availability of tailored solutions and multilingual platforms has expanded global reach. This business model continues to thrive as patients seek accessible, independent, and personalized digital psychotherapeutic care.
According to Future Market Insights (FMI), the global market for digital psychotherapeutics experienced a CAGR of 26.8% from 2020 to 2025. It is set to be valued at USD 1.7 billion in 2025.
From 2020 to 2025, the global digital psychotherapeutics industry witnessed high growth. The integration of technologies such as virtual reality and augmented reality had significantly impacted the market, especially during the pandemic.
The historical transformation of digital psychotherapeutics has been marked by advancements in technology, increasing accessibility, and a greater emphasis on personalized interventions.
Integration of virtual reality, artificial intelligence, teleconsultation, and remote therapy has significantly expanded the possibilities for delivering mental health care. It has the potential to improve access, affordability, and effectiveness of psychological interventions.
Future Forecast for Digital Psychotherapeutics Industry:
Looking ahead, the global digital psychotherapeutics industry is anticipated to expand at a CAGR of 27.6% from 2025 to 2035. During the forecast period, the market size is expected to reach USD 19.7 billion in 2035.
The global market is anticipated to expand between 2025 and 2035, driven by the adoption of digital platforms and mobile applications as it has gained popularity for delivering psychotherapy interventions.
Factors such as increasing mental health awareness, technological advancements, and the need for accessible mental health services will also contribute to its expansion.
Several companies have developed and marketed their own digital psychotherapy platforms to meet the growing demand. Further, new players have emerged, offering innovative solutions and technologies to cater to specific mental health needs. These developments are positively impacting the market.
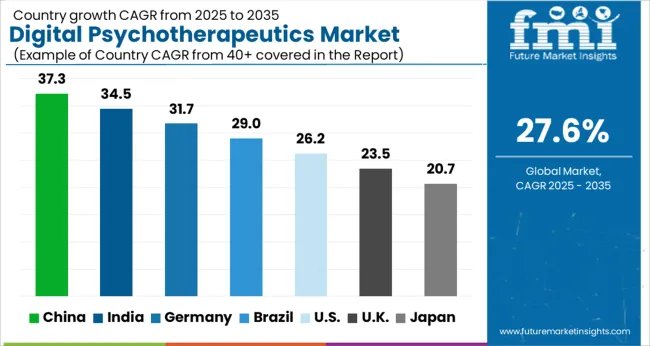
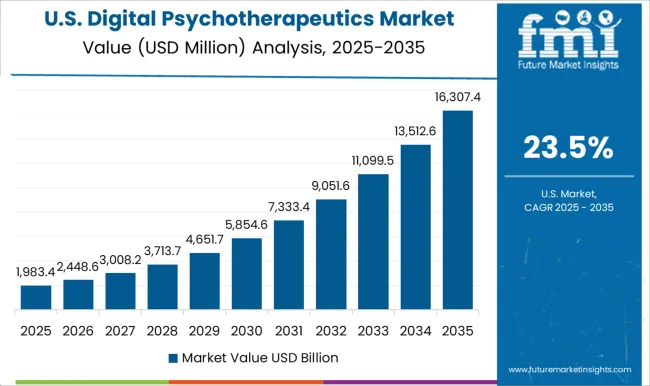
Growing Mental Health Awareness Boosting the United States Digital Psychotherapeutics Industry
| Country | United States |
|---|---|
| Market Size (USD billion) by End of Forecast Period (2035) | USD 19.7.0 million |
| CAGR % from 2025 to the End of Forecast (2035) | 18.5% |
The United States digital psychotherapeutics industry is projected to reach a valuation of USD 19.7.0 million by 2035. From 2025 to 2035, demand for digital psychotherapeutics in the country is likely to rise at 18.5% CAGR.
The digital psychotherapeutics industry in the United States is expected to progress as the country's mental health awareness grows.
Anxiety, depression, and post-traumatic stress disorder (PTSD) are common mental health illnesses in the United States. The growing recognition and understanding of these conditions have led to an increased demand for digital psychotherapeutic services.
Further, the United States has been experiencing a mental health professional shortage, particularly in certain regions. By linking clients with therapists across the country, digital psychotherapy can help overcome this gap.
Government Initiatives to Combat Psychological Health Disorders Propelling Demand in the United Kingdom
| Country | The United Kingdom |
|---|---|
| Market Size (USD billion) by End of Forecast Period (2035) | USD 30.3 million |
| CAGR % from 2025 to the End of Forecast (2035) | 26.5% |
As per Future Market Insights (FMI), digital psychotherapeutic demand in the United Kingdom is forecast to surge at 26.5% during the assessment period. Total market value is expected to reach USD 30.3 million by the end of 2035.
Growth in the market is driven by increasing prevalence of mental health disorders and government initiatives in the region.
Individuals who are enduring psychological anguish can benefit from psychological treatments and contribute more to society. As a result, government is launching various initiatives to provide people access to these various treatments.
The Improving Access to Psychological Therapy (IAPT) program of the United Kingdom's National Health Service (NHS) provides psychological therapy. This effort aims to make evidence-based therapies more broadly available, lowering wait times and ensuring people receive the assistance they require as soon as possible.
Technological Advancements in Digital Health Spurring Growth in China’s Digital Psychotherapeutics Industry
| Country | China |
|---|---|
| Market Size (USD billion) by End of Forecast Period (2035) | USD 50.7 million |
| CAGR % from 2025 to the End of Forecast (2035) | 37.0% |
China digital psychotherapeutics industry is anticipated to reach a valuation of USD 50.7 million. It is likely to exhibit a CAGR of 37.0% during the forecast period. Growth in the market is driven by robust advancements in telemedicine and digital health technology.
China is well-known for its strong technology infrastructure and high smartphone adoption. Telemedicine, mobile health applications, and wearable gadgets have seen tremendous improvements in the country. This technological readiness has created a favorable environment for the development of digital therapeutics.
People are becoming more at ease with using technology to monitor their health and participate in therapeutic activities. As a result, people in the country are increasingly adopting digital health. This is likely to continue pushing growth in the digital psychotherapeutics industry in China.
Favorable Regulatory Scenarios to Support Expansion of Digital Psychotherapeutics Industry in Japan
| Country | Japan |
|---|---|
| Market Size (USD billion) by End of Forecast Period (2035) | USD 38.1 million |
| CAGR % from 2025 to the End of Forecast (2035) | 10.9% |
The digital psychotherapeutics industry in Japan is projected to cross a valuation of USD 38.1 million by 2035. From 2025 to 2035, digital psychotherapeutics sales revenue in the country is expected to rise at 10.9% CAGR. Because of favorable regulatory conditions, Japan market is expected to witness robust growth.
In Japan, the regulatory landscape for digital therapies is changing. The Pharmaceuticals and Medical Devices Agency (PMDA) launched a new regulatory framework for medical devices, including digital therapies, in 2020.
The rules and procedures for obtaining approval and reimbursement for digital therapeutic goods are clarified in this framework. Clear regulations serve to foster an atmosphere conducive to innovation and growth in the industry.
Rising Awareness of Psychological Health to Elevate Digital Therapeutics Demand in Japan
| Country | South Korea |
|---|---|
| Market Size (USD billion) by End of Forecast Period (2035) | USD 16.9 million |
| CAGR % from 2025 to the End of Forecast (2035) | 31.7% |
The digital psychotherapeutics industry in South Korea is forecast to reach a valuation of USD 16.9 million by 2035. Over the next ten years, demand for digital therapeutics in the country is set to accelerate at 31.7% CAGR.
The market in South Korea is expected to develop with increasing awareness regarding importance of mental health.
Public awareness campaigns and educational activities have promoted the benefits associated with psychotherapy. This has significantly contributed to an increased demand for psychological services in the region and the trend is expected to continue through 2035.
Combination Therapy to Dominate the Market Through 2035
The combination therapy is expected to dominate the digital psychotherapeutics industry, exhibiting a CAGR of 28.5% from 2025 to 2035. This segment captures a significant market share in 2025 due to its ease of use.
A patient may benefit from in-person psychotherapy sessions enhanced with digital tools or platforms in a combination therapy approach. This involves using smartphone apps for self-monitoring and self-help tools, joining online support groups, or participating in virtual reality-based exposure therapy.
Management to Remain a Highly Profitable Application
Based on application, the market is segmented into prevention, management, and treatment. Among these, management is expected to remain the most remunerative application. It is likely to progress at a CAGR of 27.0% from 2025 to 2035. This is due to the growing recognition of mental health.
Increased demand for psychological therapy management reflects the growing awareness of mental health issues and the need for effective interventions. As societies continue to prioritize mental health, demand for psychological therapy management is predicted to rise. Providers can focus on refining access to these services to deliver improved mental health outcomes to patients.
Direct-to-Patients/Consumers Business Model to Hold a Mammoth Share
As per Future Market Insights (FMI), the direct-to-patients/consumers segment is expected to hold a prominent share of the market by 2035. Further, the target segment is anticipated to exhibit a CAGR of 29.0% from 2025 to 2035. This segment will capture a significant market share due to the demand for accessible and convenient mental health services.
Many individuals face barriers to accessing traditional in-person therapy, such as long wait times, geographical limitations, stigma, and cost. Digital platforms can overcome some of these barriers by offering therapy with more flexibility, affordability, and availability on-demand. Hence, the convenient use of direct-to-consumer model will boost the target segment.
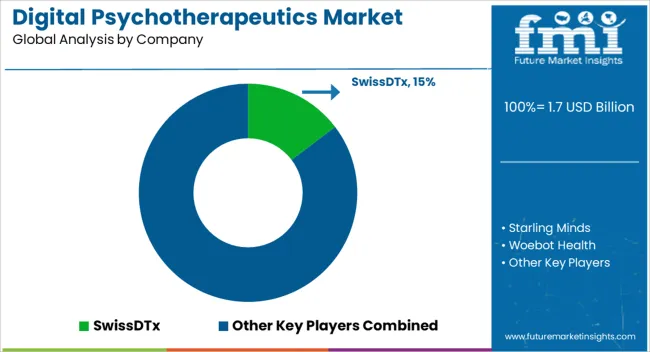
The digital psychotherapeutics industry is becoming highly competitive due to entrance of various new companies. In such a scenario, players must adopt effective strategies to stay ahead of the competition.
Key Strategies Adopted by the Players:
Product Innovation
Companies are focusing on introducing new solutions to differentiate themselves from their competitors and cater to the changing needs of customers. They are also making use of advanced technologies to stay ahead of the competition.
Strategic Partnerships and Collaborations
Key digital psychotherapeutics providers often form strategic partnerships and collaborations with other companies to leverage their strengths and expand their reach in the market.
Expansion into Emerging Markets
Leading digital psychotherapeutics companies are showing inclination towards entering emerging markets such as China and India to gain profits.
Mergers and Acquisitions
Several providers of digital psychotherapeutics are adopting mergers and acquisitions to solidify their market position, expand their product portfolio, and gain access to new markets.
Key Players in the Digital Psychotherapeutics Industry:
Key Developments in the Market:
| Attribute | Details |
|---|---|
| Estimated Market Size (2025) | USD 1.7 billion |
| Projected Market Size (2035) | USD 19.7 billion |
| Anticipated Growth Rate (2025 to 2035) | 27.6% CAGR |
| Forecast Period | 2025 to 2035 |
| Historical Data Available for | 2020 to 2025 |
| Market Analysis | USD billion for Value and MT for Volume |
| Key Regions Covered | North America; Latin America; Europe; Asia Pacific; and Middle East and Africa |
| Key Countries Covered | United States, Canada, Mexico, Brazil, Germany, Italy, France, United Kingdom, Spain, BENELUX, Russia, China, Japan, South Korea, India, ASEAN, Australia and New Zealand, Türkiye, South Africa, GCC Countries, and Others. |
| Key Segments Covered | The solution, Application, Business Model, and Region |
| Key Companies Profiled | SwissDTx; Starling Minds; Woebot Health; Talkspace; Pear Therapeutics; Ginger; Meru; Spring Care, Inc.; AbleTo, Inc.; Novartis; SilverCloud Health; FlyingPepper; BetterHelp |
The global digital psychotherapeutics market is estimated to be valued at USD 1.7 billion in 2025.
The market size for the digital psychotherapeutics market is projected to reach USD 19.7 billion by 2035.
The digital psychotherapeutics market is expected to grow at a 27.6% CAGR between 2025 and 2035.
The key product types in digital psychotherapeutics market are monotherapy and combination therapy.
In terms of application, prevention segment to command 41.6% share in the digital psychotherapeutics market in 2025.


Full Research Suite comprises of:
Market outlook & trends analysis
Interviews & case studies
Strategic recommendations
Vendor profiles & capabilities analysis
5-year forecasts
8 regions and 60+ country-level data splits
Market segment data splits
12 months of continuous data updates
DELIVERED AS:
PDF EXCEL ONLINE
Digital Marketing Analytics Industry Analysis in Latin America Size and Share Forecast Outlook 2025 to 2035
Digital Health Market Forecast and Outlook 2025 to 2035
Digital Pen Market Forecast and Outlook 2025 to 2035
Digital X-ray Market Size and Share Forecast Outlook 2025 to 2035
Digital Elevation Model Market Size and Share Forecast Outlook 2025 to 2035
Digital Pump Controller Market Size and Share Forecast Outlook 2025 to 2035
Digital Textile Printing Market Size and Share Forecast Outlook 2025 to 2035
Digital Printing Paper Market Size and Share Forecast Outlook 2025 to 2035
Digital Battlefield Market Size and Share Forecast Outlook 2025 to 2035
Digital Product Passport Software Market Size and Share Forecast Outlook 2025 to 2035
Digital Lending Platform Market Size and Share Forecast Outlook 2025 to 2035
Digital Shipyard Market Size and Share Forecast Outlook 2025 to 2035
Digital Freight Matching Market Size and Share Forecast Outlook 2025 to 2035
Digital Textile Printer Market Size and Share Forecast Outlook 2025 to 2035
Digital Thermo Anemometer Market Size and Share Forecast Outlook 2025 to 2035
Digital Twins Technologies Market Size and Share Forecast Outlook 2025 to 2035
Digital Servo Motors and Drives Market Size and Share Forecast Outlook 2025 to 2035
Digital Signature Market Size and Share Forecast Outlook 2025 to 2035
Digital Map Market Size and Share Forecast Outlook 2025 to 2035
Digital Credential Management Software Market Size and Share Forecast Outlook 2025 to 2035

Thank you!
You will receive an email from our Business Development Manager. Please be sure to check your SPAM/JUNK folder too.
Chat With
MaRIA