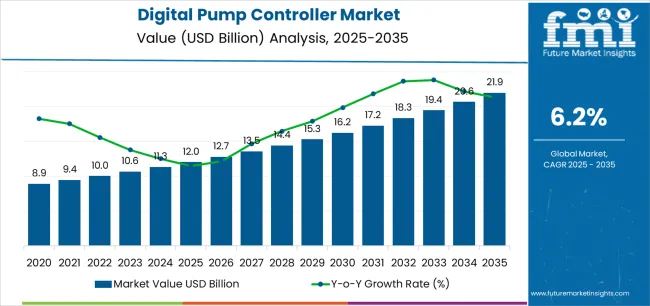
The global digital pump controller market is valued at USD 12.0 billion in 2025, with demand for digital pump controllers projected to reach USD 21.9 billion by 2035. Demand for digital pump controller represents an absolute increase of USD 9.8 billion during the forecast period, translating into total growth of 81.7%. Sales of digital pump controllers are forecast to expand at a compound annual growth rate (CAGR) of 6.2% between 2025 and 2035. The overall industry size is expected to grow by nearly 1.82 times, supported by the rising adoption of industrial automation systems, expanding demand for energy efficiency, and the integration of smart water infrastructure in both developed and emerging economies. Adoption of IoT-enabled monitoring platforms and predictive maintenance technologies is gaining momentum as manufacturers, utilities, and agricultural operators seek to reduce costs, improve reliability, and extend equipment lifecycles.
Demand for digital pump controllers is forecast to grow from USD 12.0 billion to USD 16.2 billion between 2030 to 2035, generating USD 4.2 billion in added value, which equates to 42.9% of the total growth expected through 2035. Sales of digital pump controllers in this period will be shaped by increasing industrial digitalization and the mainstream rollout of Industry 4.0 programs across global manufacturing hubs. Adoption of variable frequency drive integration is expected to rise significantly, enabling pumps to operate with improved energy optimization and reduced wastage. Demand for cloud-based remote monitoring solutions in utilities and agricultural applications will further accelerate adoption, allowing operators to monitor performance, schedule maintenance, and prevent failures from centralized platforms. Manufacturers are broadening product offerings with enhanced diagnostic capabilities, remote fault alerts, and automated shutdown features to meet market expectations for reliability and operational safety.
From 2030 to 2035, sales of digital pump controllers are forecast to rise from USD 16.2 billion to USD 21.9 billion, adding USD 5.7 billion in revenue and accounting for 57.1% of the decade’s expansion. This growth will be driven by widespread adoption of artificial intelligence and machine learning within controller platforms, enabling real-time system optimization and predictive maintenance at scale. Demand for digital twin technology is also projected to expand, with utilities and industrial players increasingly simulating pump operations to predict system behavior and optimize energy use. Adoption of smart water distribution infrastructure across European and Asian cities, coupled with agricultural mechanization in emerging markets, will further strengthen demand for digital controllers. The residential sector is also expected to contribute meaningfully, with adoption of IoT-enabled controllers giving homeowners smartphone access to pump monitoring and control functions.
Based on FMI’s validated data on industrial sensors, motion control, and machine safety systems, by 2035, demand for digital pump controllers will be firmly established across diverse sectors, with sales reflecting the growing emphasis on energy efficiency, reliability, and advanced operational management.
| Metric | Value |
|---|---|
| Estimated Value in (2025E) | USD 12.0 billion |
| Forecast Value in (2035F) | USD 21.9 billion |
| Forecast CAGR (2025 to 2035) | 6.2% |
From 2030 to 2035, the market is forecast to grow from USD 16.2 billion to USD 21.9 billion, adding another USD 5.6 billion, which constitutes 57.1% of the ten-year expansion. This period is expected to be characterized by the expansion of artificial intelligence-powered diagnostics and predictive analytics, the development of over-the-air firmware updates and edge computing capabilities, and the growth of integrated IoT ecosystems and digital twin technologies for comprehensive pump fleet management. The growing adoption of advanced analytics and machine learning algorithms will drive demand for digital pump controllers with enhanced intelligence and autonomous optimization features.
Between 2020 and 2025, the digital pump controller market experienced steady growth, driven by increasing industrial automation requirements and growing recognition of digital pump controllers as essential technologies for enhancing operational efficiency and reducing energy consumption in diverse manufacturing, utilities, agriculture, and building services applications. The market developed as facility managers and process engineers recognized the potential for digital control technology to improve pump performance, enable predictive maintenance, and support sustainability objectives while meeting operational reliability requirements. Technological advancement in wireless connectivity and cloud integration began emphasizing the critical importance of maintaining real-time monitoring and remote control capabilities in complex industrial and infrastructure environments.
Market expansion is being supported by the increasing global emphasis on energy efficiency and carbon emissions reduction driven by sustainability regulations and rising electricity costs, alongside the corresponding need for intelligent control technologies that can optimize pump operations, enable condition-based maintenance, and maintain system reliability across various industrial processes, water distribution, agricultural irrigation, and building management applications. Modern facility operators and utilities are increasingly focused on implementing digital pump controllers that can reduce energy consumption, minimize unplanned downtime, and provide real-time performance visibility in demanding operational environments.
The growing emphasis on predictive maintenance and operational intelligence is driving demand for digital pump controllers that can support advanced analytics, enable remote diagnostics and troubleshooting, and ensure comprehensive asset performance management. Industrial operators' preference for control technologies that combine energy optimization with connectivity capabilities and lifecycle cost reduction is creating opportunities for innovative digital pump controller implementations. The rising influence of smart city initiatives and precision agriculture adoption is also contributing to increased deployment of digital pump controllers that can provide superior operational control without compromising system reliability or maintenance efficiency.
The market is segmented by product type, end-use, pump type, power rating, sales channel, and region. By product type, the market is divided into mobile/remote digital pump controllers and conventional digital pump controllers. Based on end-use, the market is categorized into manufacturing, public sector (water & wastewater, utilities), agriculture, and residential. By pump type, the market includes centrifugal, submersible, diaphragm, gear, screw, and others. Based on power rating, the market comprises low power, medium power, and high power. By sales channel, the market is segmented into OEM, distributors/resellers, direct sales, and online retailers. Regionally, the market is divided into Asia Pacific, North America, Europe, Latin America, and Middle East & Africa.
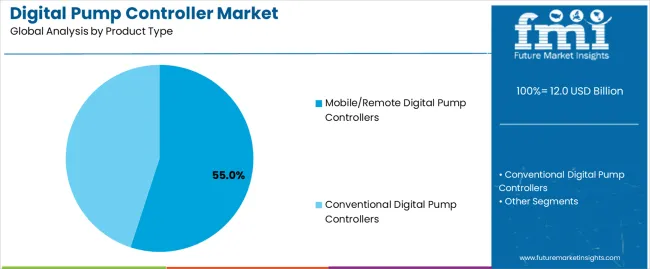
The mobile/remote digital pump controllers segment is projected to maintain its leading position in the digital pump controller market in 2025 with a 55.0% market share, reaffirming its role as the preferred product category for applications requiring remote monitoring, cloud connectivity, and mobile device access capabilities. Facility operators and utilities increasingly utilize mobile/remote digital pump controllers for their superior accessibility characteristics, excellent connectivity performance, and proven effectiveness in enabling off-site management while reducing site visit requirements and operational response times. Mobile/remote controller technology's proven effectiveness and application versatility directly address the industry requirements for distributed asset management and operational efficiency optimization across diverse industrial facilities and infrastructure networks.
This product segment forms the foundation of modern pump automation, as it represents the technology with the greatest contribution to operational visibility improvements and established performance record across multiple industrial applications and infrastructure sectors. Industry investments in IoT-enabled control technologies continue to strengthen adoption among utilities and manufacturing facilities. With operational pressures requiring enhanced efficiency and reduced maintenance costs, mobile/remote digital pump controllers align with both productivity objectives and sustainability requirements, making them the central component of comprehensive pump management strategies.
The conventional digital pump controllers segment maintains a 45.0% market share, serving applications where on-site control interfaces are sufficient, network connectivity is limited, or cybersecurity concerns prioritize standalone operation without cloud connectivity. Conventional controllers remain relevant in facilities requiring basic automation without remote access capabilities and in retrofit applications where existing control infrastructure limits connectivity options.
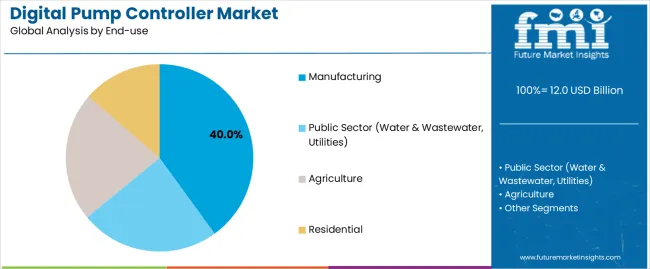
The manufacturing application segment is projected to represent the largest share of digital pump controller demand in 2025 with a 40.0% market share, underscoring its critical role as the primary driver for digital controller adoption across process industries, chemical plants, food and beverage production, pharmaceutical manufacturing, and industrial water treatment applications. Manufacturing operators prefer digital pump controllers for process control due to their exceptional precision capabilities, energy efficiency benefits, and ability to integrate with plant automation systems while supporting production optimization and regulatory compliance. Positioned as essential technologies for modern manufacturing operations, digital pump controllers offer both process control advantages and energy cost reduction benefits.
The segment is supported by continuous innovation in Industry 4.0 integration and the growing availability of advanced controller models that enable superior process control with enhanced connectivity and predictive maintenance capabilities. The manufacturing facilities are investing in comprehensive digital transformation programs to support increasingly automated production processes and energy management requirements. As industrial automation advances and sustainability standards increase, the manufacturing application will continue to dominate the market while supporting advanced analytics utilization and operational efficiency optimization strategies.
Public sector (water & wastewater, utilities) applications represent 25.0% of market demand, driven by water distribution network optimization, wastewater pumping station automation, and utility infrastructure modernization programs addressing leakage reduction and energy efficiency mandates. Agriculture accounts for 20.0%, supported by precision irrigation system adoption, agricultural mechanization initiatives, and smart farming practices requiring automated water management. Residential applications comprise 15.0% of market demand, encompassing domestic water supply systems, pressure boosting applications, and building services automation in residential complexes and individual homes.
The digital pump controller market is advancing steadily due to increasing demand for energy-efficient pump operations driven by sustainability mandates and growing adoption of predictive maintenance technologies that require intelligent control platforms providing enhanced monitoring capabilities and operational cost reduction across diverse industrial, utilities, agriculture, and building services applications. The market faces challenges, including high initial investment costs for advanced controller systems, cybersecurity concerns regarding connected devices and network vulnerabilities, and integration complexity with legacy pump installations and existing control infrastructure. Innovation in artificial intelligence diagnostics and edge computing capabilities continues to influence product development and market expansion patterns.
The growing emphasis on water distribution network efficiency and non-revenue water reduction is driving demand for intelligent pump controllers that address critical operational challenges including pressure optimization, flow balancing, and leak detection through continuous monitoring and adaptive control algorithms. Water utilities face increasing pressure to reduce water losses, minimize energy consumption, and improve infrastructure reliability while managing aging assets and limited capital budgets. Utility operators are increasingly recognizing the essential role of digital pump controllers for achieving performance targets and operational efficiency objectives, creating opportunities for cloud-enabled monitoring platforms specifically designed for distributed water infrastructure and comprehensive network management applications.
Modern digital pump controller manufacturers are incorporating artificial intelligence algorithms and machine learning capabilities to enhance predictive maintenance, optimize energy consumption, and support comprehensive asset management through anomaly detection and performance trend analysis. Leading companies are developing on-controller AI diagnostics with pattern recognition, implementing cloud analytics platforms for fleet-wide optimization, and advancing technologies that predict component failures and enable proactive maintenance interventions. These technologies improve operational reliability while enabling new value propositions, including performance benchmarking, energy consumption forecasting, and intelligent scheduling optimization. Advanced AI integration also allows operators to support comprehensive operational excellence programs and total cost of ownership reduction beyond traditional reactive maintenance approaches.
The expansion of Industrial Internet of Things architectures, smart manufacturing initiatives, and distributed infrastructure management is driving demand for IoT-ready digital pump controllers that provide seamless connectivity, remote configuration capabilities, and over-the-air firmware updates enabling continuous improvement and security patching. These advanced connectivity features create flexible deployment models supporting subscription-based monitoring services, software-defined functionality upgrades, and cyber-resilient architectures that address evolving operational requirements, creating modern market segments with differentiated service propositions. Manufacturers are investing in cybersecurity frameworks and edge computing capabilities to serve increasingly connected industrial environments while supporting digital transformation initiatives and operational technology convergence.
| Country | CAGR (2025-2035) |
|---|---|
| India | 7.1% |
| China | 6.8% |
| United States | 6.5% |
| Germany | 6.2% |
| Brazil | 6.0% |
| Japan | 5.9% |
| United Kingdom | 5.6% |
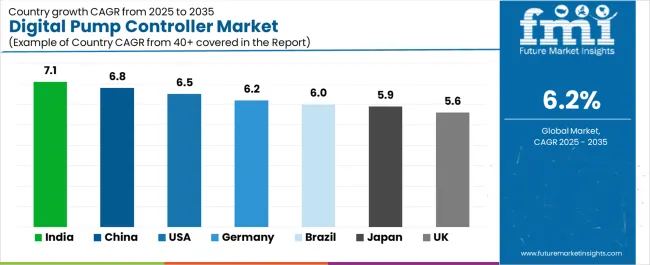
The digital pump controller market is experiencing solid growth globally, with India leading at a 7.1% CAGR through 2035, driven by smart irrigation expansion programs, rapid municipal water infrastructure investments, and strong adoption of mobile/remote controllers in agriculture sector modernization initiatives. China follows at 6.8%, supported by urban water network upgrades under smart city programs, extensive industrial automation spending, and comprehensive infrastructure digitalization initiatives. The United States shows growth at 6.5%, emphasizing energy efficiency retrofits at utilities, predictive maintenance rollouts in manufacturing and oil & gas sectors, and advanced industrial IoT deployment. Germany demonstrates 6.2% growth, supported by Industry 4.0 manufacturing deployments, stringent energy efficiency standards driving VFD-linked controller adoption, and comprehensive industrial digitalization programs. Brazil records 6.0%, focusing on water loss reduction programs at utilities and agricultural mechanization in Cerrado and southern regions. Japan exhibits 5.9% growth, emphasizing aging infrastructure digitization and high uptake of remote monitoring for operational reliability in process industries. The United Kingdom shows 5.6% growth, supported by AMP-period water utility investment cycles and leakage reduction and resilience targets accelerating digital control adoption.
The report covers an in-depth analysis of 40+ countries, Top-performing countries are highlighted below.
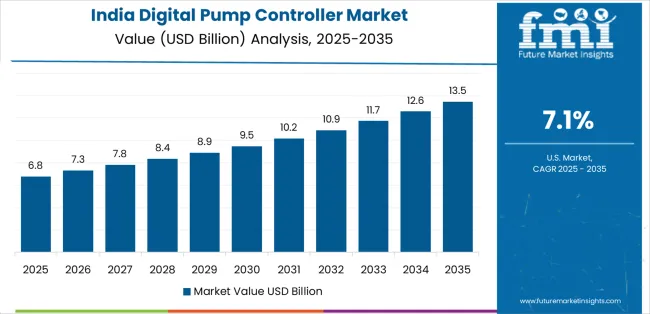
The digital pump controllers market in India is projected to exhibit exceptional growth with a CAGR of 7.1% through 2035, driven by extensive smart irrigation expansion programs and rapidly growing municipal water infrastructure investments supported by government modernization initiatives and agricultural productivity enhancement programs. The country's massive agricultural sector modernization and increasing urbanization are creating substantial demand for digital pump controller solutions. Major pump manufacturers and automation companies are establishing comprehensive digital control capabilities to serve both agricultural markets and expanding urban water infrastructure.
Revenue from digital pump controllers in China is expanding at a CAGR of 6.8%, supported by the country's comprehensive urban water network upgrades under smart city programs, extensive industrial automation spending, and large-scale infrastructure digitalization initiatives driven by government economic development policies and manufacturing competitiveness objectives. The country's coordinated infrastructure modernization and technological advancement are driving sophisticated digital pump controller capabilities throughout industrial and utilities sectors. Leading automation manufacturers and water infrastructure companies are establishing extensive production and deployment facilities to address growing domestic demand and export markets.
Revenue from digital pump controllers in the United States is expanding at a CAGR of 6.5%, supported by the country's extensive energy efficiency retrofit programs at utilities, predictive maintenance rollouts in manufacturing and oil & gas sectors, and advanced Industrial IoT infrastructure enabling comprehensive asset monitoring. The nation's mature industrial base and emphasis on operational excellence are driving demand for sophisticated digital pump controller solutions. Industrial manufacturers and utilities are investing in controller upgrades and analytics platforms to serve both operational efficiency and sustainability objectives.
Revenue from digital pump controllers in Germany is expanding at a CAGR of 6.2%, driven by the country's comprehensive Industry 4.0 manufacturing deployments, stringent energy efficiency standards driving VFD-linked controller adoption, and precision engineering capabilities supporting advanced pump automation technologies. Germany's manufacturing excellence and sustainability leadership are driving sophisticated digital pump controller capabilities throughout industrial sectors. Leading automation companies and pump manufacturers are establishing comprehensive smart manufacturing programs incorporating next-generation digital control technologies.
Revenue from digital pump controllers in Brazil is growing at a CAGR of 6.0%, driven by the country's comprehensive water loss reduction programs at utilities, agricultural mechanization acceleration in Cerrado and southern regions, and infrastructure modernization initiatives supporting operational efficiency improvements. Brazil's extensive agricultural sector and expanding urban water infrastructure are supporting investment in digital pump control technologies. Major utilities and agricultural operators are establishing modernization programs incorporating remote monitoring and intelligent control capabilities.

Revenue from digital pump controllers in Japan is expanding at a CAGR of 5.9%, supported by the country's aging infrastructure digitization requirements, high uptake of remote monitoring for operational reliability in process industries, and emphasis on precision control technologies for critical applications. Japan's technological sophistication and infrastructure challenges are driving demand for advanced digital pump controller products. Leading industrial companies and utilities are investing in comprehensive digitalization programs addressing aging workforce challenges and reliability requirements.
Revenue from digital pump controllers in the United Kingdom is expanding at a CAGR of 5.6%, driven by the country's AMP (Asset Management Period) water utility investment cycles, aggressive leakage reduction and resilience targets, and regulatory pressure accelerating digital control adoption for network performance improvement. The UK's regulated utility sector and stringent performance standards are supporting investment in intelligent pump control technologies. Water companies and industrial facilities are establishing comprehensive digital transformation programs incorporating advanced monitoring and control capabilities.
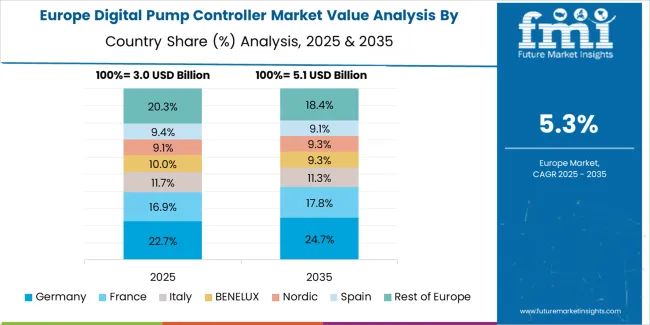
The digital pump controller market in Europe is projected to grow from USD 3.5 billion in 2025 to USD 6.0 billion by 2035, registering a CAGR of 5.6% over the forecast period. Germany is expected to retain leadership with a 22.0% market share in 2025, easing to 21.5% by 2035, supported by continued Industry 4.0 adoption and high efficiency standards across municipal water systems and process industries.
France holds 18.0% in 2025, inching up to 18.5% by 2035, driven by utilities prioritizing leakage reduction programs and energy performance contract implementations. The United Kingdom accounts for 16.0% in 2025, moderating to 15.5% by 2035 as AMP investment cycles normalize following intensive infrastructure upgrade periods. Italy posts 12.0%, supported by water network refurbishment initiatives and irrigation modernization programs throughout agricultural regions. Spain records 9.0%, driven by strong agricultural sector demand and municipal water infrastructure investment. Nordics & Benelux collectively represent 11.0% in 2025, rising to 11.5% by 2035 with advanced smart grid for water rollouts and comprehensive utility digitalization programs. The Rest of Europe region moves from 12.0% to 13.5% by 2035, reflecting accelerated digital control adoption across Eastern European utilities under EU funding programs and infrastructure modernization initiatives.
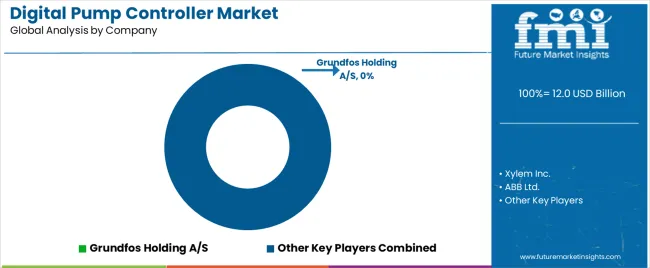
The digital pump controller market is characterized by competition among established pump manufacturers, diversified automation companies, and specialized industrial control system providers. Companies are investing in artificial intelligence algorithm development, cloud platform integration, IoT connectivity enhancement, and predictive analytics capabilities to deliver intelligent, energy-efficient, and remotely manageable digital pump controller solutions. Innovation in edge computing capabilities, cybersecurity frameworks, and over-the-air update technologies is central to strengthening market position and competitive advantage.
Grundfos Holding A/S leads the market with a 10.5% share, offering comprehensive digital pump controller solutions with a focus on cloud-enabled remote monitoring, energy optimization technologies, and integrated pump-controller systems across diverse industrial, utilities, agriculture, and building services applications. The company expanded cloud-enabled remote monitoring subscriptions for utilities and agriculture in 2024, adding anomaly alerts and fleet dashboards. In 2025, Grundfos rolled out firmware enabling on-controller AI diagnostics on selected digital units to reduce unplanned pump downtime. Xylem Inc. provides innovative water technology solutions, having introduced a unified digital platform in 2024 and launched an IoT-ready controller option for submersible wastewater pumps with mobile configuration and over-the-air updates in 2025.
ABB Ltd. delivers high-performance automation solutions, releasing updates in 2024 that tighten integration between water-focused AC drives and digital pump controllers for energy-optimized pressure and flow control. Emerson Electric Co. offers comprehensive process automation technologies with emphasis on predictive analytics. Schneider Electric SE provides integrated automation and energy management solutions. Siemens AG specializes in industrial digitalization technologies. Honeywell International Inc. focuses on building automation and process control. Rockwell Automation, Inc. emphasizes industrial automation platforms. Johnson Controls International provides building management systems. Wilo SE offers pump systems with integrated digital control capabilities.
Digital pump controllers represent a critical industrial automation technology segment within manufacturing, utilities, agriculture, and building services applications, projected to grow from USD 12.0 billion in 2025 to USD 21.9 billion by 2035 at a 6.2% CAGR. These intelligent control systems-encompassing mobile/remote and conventional configurations for diverse pump types-serve as essential operational technologies in process control, water distribution, irrigation management, and HVAC systems where energy efficiency, remote monitoring, and predictive maintenance are essential. Market expansion is driven by increasing industrial digitalization and Industry 4.0 initiatives, growing energy efficiency mandates, expanding smart water infrastructure programs, and rising demand for IoT-enabled monitoring and control capabilities across diverse industrial and infrastructure sectors.
How Industrial Regulators Could Strengthen Efficiency Standards and Cybersecurity Requirements?
How Industry Associations Could Advance Integration Standards and Best Practices?
How Digital Pump Controller Manufacturers Could Drive Innovation and Market Leadership?
How End-User Organizations Could Optimize System Performance and Energy Efficiency?
How Research Institutions Could Enable Technology Advancement?
How Investors and Financial Enablers Could Support Market Growth and Innovation?
| Items | Values |
|---|---|
| Quantitative Units (2025) | USD 12.0 billion |
| Product Type | Mobile/Remote Digital Pump Controllers, Conventional Digital Pump Controllers |
| End-use | Manufacturing, Public Sector (Water & Wastewater, Utilities), Agriculture, Residential |
| Pump Type | Centrifugal, Submersible, Diaphragm, Gear, Screw, Others |
| Power Rating | Low Power, Medium Power, High Power |
| Sales Channel | OEM, Distributors/Resellers, Direct Sales, Online Retailers |
| Regions Covered | Asia Pacific, North America, Europe, Latin America, Middle East & Africa |
| Countries Covered | India, China, United States, Germany, Brazil, Japan, United Kingdom, and 40+ countries |
| Key Companies Profiled | Grundfos Holding A/S, Xylem Inc., ABB Ltd., Emerson Electric Co., Schneider Electric SE, Siemens AG |
| Additional Attributes | Dollar sales by product type, end-use category, pump type, power rating, and sales channel segments, regional demand trends, competitive landscape, technological advancements in AI diagnostics, IoT connectivity, predictive analytics, and energy optimization |
The global digital pump controller market is estimated to be valued at USD 12.0 billion in 2025.
The market size for the digital pump controller market is projected to reach USD 21.9 billion by 2035.
The digital pump controller market is expected to grow at a 6.2% CAGR between 2025 and 2035.
The key product types in digital pump controller market are mobile/remote digital pump controllers and conventional digital pump controllers.
In terms of end-use, manufacturing segment to command 40.0% share in the digital pump controller market in 2025.


Our Research Products

The "Full Research Suite" delivers actionable market intel, deep dives on markets or technologies, so clients act faster, cut risk, and unlock growth.

The Leaderboard benchmarks and ranks top vendors, classifying them as Established Leaders, Leading Challengers, or Disruptors & Challengers.

Locates where complements amplify value and substitutes erode it, forecasting net impact by horizon

We deliver granular, decision-grade intel: market sizing, 5-year forecasts, pricing, adoption, usage, revenue, and operational KPIs—plus competitor tracking, regulation, and value chains—across 60 countries broadly.

Spot the shifts before they hit your P&L. We track inflection points, adoption curves, pricing moves, and ecosystem plays to show where demand is heading, why it is changing, and what to do next across high-growth markets and disruptive tech

Real-time reads of user behavior. We track shifting priorities, perceptions of today’s and next-gen services, and provider experience, then pace how fast tech moves from trial to adoption, blending buyer, consumer, and channel inputs with social signals (#WhySwitch, #UX).

Partner with our analyst team to build a custom report designed around your business priorities. From analysing market trends to assessing competitors or crafting bespoke datasets, we tailor insights to your needs.
Supplier Intelligence
Discovery & Profiling
Capacity & Footprint
Performance & Risk
Compliance & Governance
Commercial Readiness
Who Supplies Whom
Scorecards & Shortlists
Playbooks & Docs
Category Intelligence
Definition & Scope
Demand & Use Cases
Cost Drivers
Market Structure
Supply Chain Map
Trade & Policy
Operating Norms
Deliverables
Buyer Intelligence
Account Basics
Spend & Scope
Procurement Model
Vendor Requirements
Terms & Policies
Entry Strategy
Pain Points & Triggers
Outputs
Pricing Analysis
Benchmarks
Trends
Should-Cost
Indexation
Landed Cost
Commercial Terms
Deliverables
Brand Analysis
Positioning & Value Prop
Share & Presence
Customer Evidence
Go-to-Market
Digital & Reputation
Compliance & Trust
KPIs & Gaps
Outputs
Full Research Suite comprises of:
Market outlook & trends analysis
Interviews & case studies
Strategic recommendations
Vendor profiles & capabilities analysis
5-year forecasts
8 regions and 60+ country-level data splits
Market segment data splits
12 months of continuous data updates
DELIVERED AS:
PDF EXCEL ONLINE
Market Share Distribution Among Digital Pump Controller Manufacturers
Digital Pump Market Growth - Trends & Forecast 2025 to 2035
Digital Signal Controller & Processor Market
Digital Hall Effect Gaussmeter Market Size and Share Forecast Outlook 2025 to 2035
Digital Group Dining Service Market Size and Share Forecast Outlook 2025 to 2035
Digital Pathology Displays Market Size and Share Forecast Outlook 2025 to 2035
Digital Rights Management Market Size and Share Forecast Outlook 2025 to 2035
Digital Liquid Filling Systems Market Size and Share Forecast Outlook 2025 to 2035
Digital Transformation Industry Analysis in MENA Size and Share Forecast Outlook 2025 to 2035
Digital X-Ray Equipment Market Size and Share Forecast Outlook 2025 to 2035
Digital Marketing Analytics Industry Analysis in Latin America Forecast Outlook 2025 to 2035
Pump Jack Market Forecast Outlook 2025 to 2035
Digital Health Market Forecast and Outlook 2025 to 2035
Digital Pen Market Forecast and Outlook 2025 to 2035
Digital X-ray Market Size and Share Forecast Outlook 2025 to 2035
Digital Elevation Model Market Size and Share Forecast Outlook 2025 to 2035
Digital Textile Printing Market Size and Share Forecast Outlook 2025 to 2035
Pump and Dispenser Market Size and Share Forecast Outlook 2025 to 2035
Digital Printing Paper Market Size and Share Forecast Outlook 2025 to 2035
Digital Battlefield Market Size and Share Forecast Outlook 2025 to 2035

Thank you!
You will receive an email from our Business Development Manager. Please be sure to check your SPAM/JUNK folder too.
Chat With
MaRIA