Reports

- Global Locations -

Headquarters

Future Market Insights, Inc.

Christiana Corporate, 200
Continental Drive, Suite 401,
Newark, Delaware - 19713,
United States

T: +1-845-579-5705

Americas

Future Market Insights, Inc.

616 Corporate Way, Suite 2-9018,
Valley Cottage, NY 10989, United States

T: +1-347-918-3531

MEA

Future Market Insights

1602-6 Jumeirah Bay X2 Tower, Plot No: JLT-PH2-X2A,
Jumeirah Lakes Towers, Dubai,
United Arab Emirates

Europe

Future Market Insights

3rd Floor, 207 Regent Street,
W1B 3HH London
United Kingdom

T: + 44 (0) 20 8123 9659
D: +44 (0) 20 3287 4268

Asia Pacific

Future Market Insights

IndiaLand Global Tech Park, Unit UG-1, Behind Grand HighStreet, Phase 1, Hinjawadi, MH, Pune – 411057, India

Digital Map Market Outlook

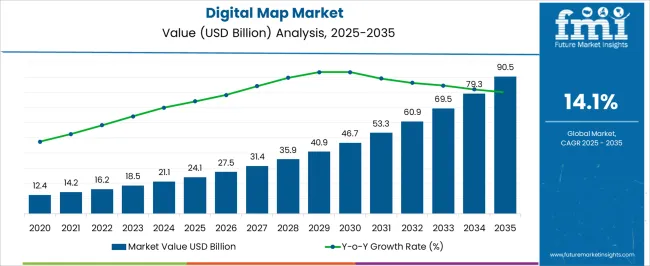
The digital map market is estimated to capture a valuation of US$ 18.3 billion in 2023 and is projected to reach US$ 73.1 billion by 2033. The market is estimated to secure a CAGR of 14.8% from 2023 to 2033.

Increasing adoption of geospatial data and software within different vertical segments, coupled with growing demand for GIS software, are some of the major factors responsible for boosting the growth of this market.

Attributes Details
Market CAGR (2023 to 2033) 14.8%
Market Valuation (2023) US$ 18.3 billion
Market Valuation (2033) US$ 73.1 billion

Don't pay for what you don't need

Customize your report by selecting specific countries or regions and save 30%!

What are the Factors that Drive the Digital Map Market?

Smartphones and tablets are becoming more advanced due to rapid technological change. Smartphones come with preloaded map software, which can locate points of interest. It has been widely reported that smartphone owners use mapping applications for navigation and driving assistance.

These users use Geographic Information System (GIS) applications and GPS technology to access comprehensive geo-referenced database information that helps them locate nearby restaurants, banks, cinema halls, and other landmarks. To capture accurate 3D spatial information, mobile computing devices are widely adopted in the digital maps market.

Digital maps are growing in popularity due to the increasing adoption of digital technology in data collection and analysis and the increasingly widespread use of digital maps in the industrial sector. As digital map technology providers face an increasingly competitive landscape, they are increasing their product portfolios and enhancing their technology to offer customers more detailed and user-friendly maps.

Motorized stations and GPS technology are used in the digital maps market as a substitute for the optical and mechanical instruments used previously for surveying. Increasing the coverage of remote areas and updating the technology on a real-time basis are the latest trends in digital maps.

What are the Major Technological Challenges Faced by Digital Maps in the Market?

Organizations and government agencies that rely on geospatial technologies and analytics are often unable to realize the full potential of these technologies. The lack of experienced professionals familiar with spatial data and related issues has created a problem for the growth of digital maps in the market.

Digital mapping solutions have faced problems with the inadequacy of knowledge and awareness, which has slowed their adoption, as a result of which they are still slow to be adopted in the market. It is, therefore, possible to encourage the market adoption and growth of the global digital maps market by fostering information flow through several channels, such as forums, blogs, seminars, and return on investment studies.

GPS and location mapping have become essential to mobile device users with the help of mobile computing devices. Users can gather information about places they visit frequently, such as their home and office locations.

Hackers can access user accounts using such information and personal details, such as passwords, IP addresses, or files, such as audio or video. Effective methods must be found to limit the dissemination of GPS information and protect the privacy of people who use their phones.

Additionally, GPS data is shared between applications and operating systems, posing a risk of data privacy violations. All these factors are hampering the growth of the market.

Sudip Saha
Sudip Saha

Principal Consultant

Talk to Analyst

Find your sweet spots for generating winning opportunities in this market.

Digital Map Market, 2018 to 2022 Historical Sales, Compared to 2023 to 2033 Future Outlook

The market captured a valuation of US$ 10 billion in 2018 and US$ 16.2 billion in 2022, with a CAGR of 12.7% between 2018 and 2022. Increasing demand for digital images and transportation analysis in areas such as logistics and communications contribute to significant growth in this period.

The demand for improved user-friendly applications and the enhancement of business operations has contributed to the growth of digital maps in the market. With advances in GIS, map analytics, and real-time tracking systems, digital maps represent a potential part of various industries like automotive, mobile & internet, energy & power, logistics, government & utilities, real estate/construction, and others.

Massive fleets have become available to meet consumer demand for on-demand ride services and serve a more diverse delivery service fueled by e-commerce. As part of the mobility services category, moving packages and moving riders rely on efficient drivers who can coordinate multiple parties seamlessly in the real world. As a result, mobile operators rely on geospatial data and technologies from providers like Google Maps Platform to provide all of these features.

Comparative Analysis of Adjacent Markets

Digital Map Market:

Attributes Digital Map Market
CAGR (2023 to 2033) 14.8%
Value (2023) US$ 18.3 billion
Value (2033) US$ 73.1 billion
Trends The rapid development of digital map technologies that provide autonomous vehicles with highly accurate, robust, reliable, and accurate location data also impacts the growth of the market.
Opportunities Data from sensors, devices, and social media feeds can be analyzed and displayed in real-time using real-time mapping.

Software Solutions Digital Map Market:

Attributes Software Solutions Digital Map Market
CAGR (2023 to 2033) 14.5%
Value (2023) US$ 15.65 billion
Value (2033) US$ 60.63 billion
Trends The adoption of digital mapping and surveying technologies has also contributed to the market's growth. This technology is expected to be used more often in the future due to the adoption of 3D modeling and digital elevation models.
Opportunities The automation industry has been experiencing technological growth in the area of maps and viewing the environment around the vehicle to create market opportunities.

Outdoor Maps Market:

Attributes Outdoor Maps Market
CAGR (2023 to 2033) 14%
Value (2023) US$ 18.83 billion
Value (2033) US$ 69.81 billion
Trends The growth of autonomous vehicles and construction activity boosts the demand for digital maps in the market.
Opportunities Mining activities, agriculture, and disaster tracking of the environment, and government & utilities to further expand the market.

Get the data you need at a Fraction of the cost

Personalize your report by choosing insights you need
and save 40%!

Can Software Solutions Be Considered a Catalyst for the Growth of the Digital Maps Market?

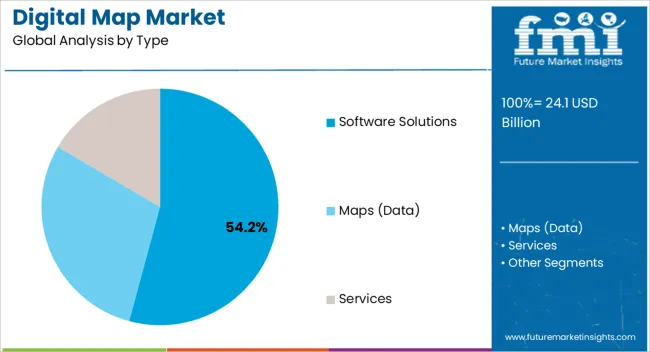
Growing demand for 5G technologies and continuous technological advancements in the IT sector has helped propel the growth of digital maps software solutions in the market. Software solutions are estimated to capture a share of 43.2% during the forecast period.

Increasing adoption of 3-D and 2-D views of geographic locations has increased market growth for software solutions. Various developers constantly compete to provide more detailed and comprehensive maps to consumers on the market to satisfy their customers' demands.

To gain significant financial benefits and added value, digital mapping tools, and software applications have seen an exponential increase in demand as companies of all sizes gain a greater understanding of the capabilities of these tools in the digital map market.

Many companies and businesses, both large and small-sized, in e-commerce, food, automation, etc., are competing in the marketplace to deliver products to customers on time.

As part of the infrastructure life cycle, digital maps play a significant role in the construction and engineering fields. Further, these solutions assist construction engineers in managing and sharing their data, creating reports, and visualizing the data they generate, so that the information can be analyzed and communicated with others. Maps can decrease network maintenance costs as well as improve safety measures.

Which Application Has the Most Potential in the Digital Map Market?

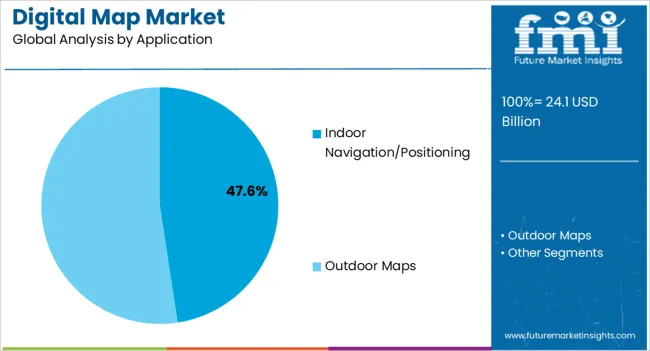
Outdoor mapping dominates the market by securing a maximum share of 75.2% during the forecast period. Automotive is among the well-known verticals that rely on maps for navigation. In addition, many industries, such as logistics, travel, and transportation, make extensive use of navigation software applications. Innovative city initiatives promote the adoption of digital maps on a wide scale through integrated platforms, such as ride-sharing, traffic updates, route updates, and weather forecasts.

The constant development of automobiles has spurred the market for digital maps to grow. As a result of the increasing demand for autonomous vehicles in the market, the need for digital maps continues to rise. Market demand for weather reports, agricultural reports, and mining reports for government and private firms would also contribute to the market demand for outdoor maps.

Smartphone usage has risen dramatically over the past few years. With smartphones, including radio chips, users can access mapping services online and positional information by connecting to satellite navigation systems to find their location automatically.

For instance, people turn to map applications such as Google Maps for directions and location-based searches to find restaurants, banks, pharmacies, gas stations, and ATMs. These trends have been fueled by the growing popularity of smartphones in the market.
How are the Various Regions Affecting the Growth of Digital Map in the Market?

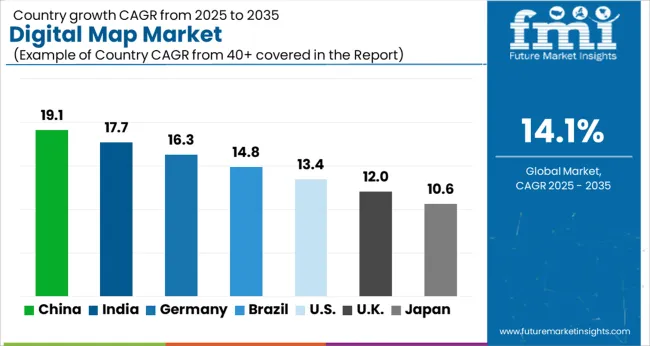
Countries Current Market Share 2023
United States 16.5%
Germany 9.1%
Japan 7.1%
Australia 3.5%
Countries Current Market CAGR 2023
China 16.7%
India 18.7%
United Kingdom 15.4%

North America is expected to hold the maximum share of 24.4% globally by 2033. North America has become a significant market by increasing the adoption of advanced technology in the region, which is one factor favoring the market's growth.

Due to the early adoption of technological advancements and the high amount of Research and Development investment in this region, the United States digital map market is expected to account for a total share of 16.5% by 2033. In addition, the significant number of players operating in the digital map space across regions is estimated to further drive the market forward due to the presence of large automakers in this region and the employment of digital maps.

A rising trend in the development of automatic vehicles on the market has been a critical contributor to the growth of digital maps in this region. According to the forecast, Asia-Pacific is expected to grow significantly during the forecast period. During the forecast period, China is securing a CAGR of 16.7% in the global market.

The constant advancement of technology and the expansion of large IT firms in many developing nations have further created a demand for the digital maps market. A significant shift in technological adoption has occurred in countries including China, India, Japan, and South Korea in recent years.

The increasing adoption of digital maps in all these Asian countries is estimated to be influenced by increasing demand for e-commerce applications, mobile technology, logistic management, and monitoring of the environment. During the forecast period, India is projected to reach a market value of US$ 1.4 billion with a CAGR of 18.7%.

Over the forecast period, Japan is projected to achieve a share of 7.1% in 2033. To handle their logistical demands for the fast movement of raw materials and goods, China and India are developing their road networks to counterbalance the logistic order. Further, the increasing demand for intelligent maps for use in automobiles is also contributing to the growth of the market in the region.

The International Geological Mapping Project (IGME 5000) is a major Europe-wide geological GIS map project that is managed and administered by the Federal Institute for Geosciences and Natural Resources (BGR) under the auspices of the Commission for the Geological Map of the World (CGMW).

BGR and its predecessors have maintained a long tradition of producing international geoscientific maps of Europe. During the forecast period, the digital maps market in the United Kingdom is expected to grow at a compound annual growth rate of 15.4%. The increased potential arising from the growing presence of automation market players has enhanced the use of digital maps.
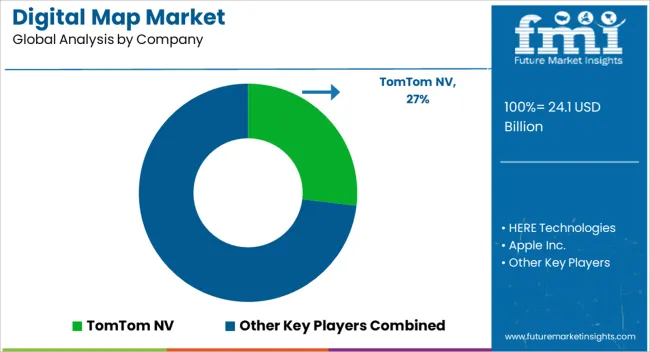
What is the Level of Competition for Digital Maps in the Market?

Manufacturers can increase production and meet consumer demand through strategic partnerships, increasing their revenues and market share. Introducing new products and technologies is estimated to allow end-users to reap the benefits of new technologies. Expanding the company's production capacity is one of the potential benefits of a strategic partnership.

Other Essential Players in the Global Digital Map Market are:

  • TomTom NV
  • HERE Technologies
  • Apple Inc.
  • Alibaba Group
  • Navinfo Co., Ltd
  • INRIX Inc.
  • Baidu, Inc.
  • MapBox Inc.
  • Environmental Systems Research Institute (ESRI)
  • Alphabet Inc.

Recent Developments in the Global Digital Map Market are:

  • In February 2022, the Nuclear Innovation Institute (NII) is estimated to partner with Ecopia AI to provide municipalities with a digital mapping solution to address climate change concerns and keep up with growing communities in Bruce County. MIC member municipalities and their partners are estimated to be able to use state-of-the-art artificial intelligence, cutting-edge machine learning, and aerial imagery to create a 21st Century view of Bruce County, resulting in increased efficiencies and more informed decisions. Continuing to support sustainable growth in the County requires innovative thinking and new tools for monitoring environmental conditions and changes over time.
  • NVIDIA Research is estimated to turn 2-D photos into 3-dimensional scenes in March 2022 with the aid of artificial intelligence. As a result, NVIDIA developed the neural radiance field, or NeRF, a popular new technology. A new NeRF technique called Instant NeRF is the fast NeRF technique to date. In some cases, it can achieve speeds of more than 1,000x. A polygonal mesh can be compared to a vector image, whereas a NeRF is comparable to a bitmap image: it shows the direction light is radiating from an object or scene. The Instant NeRF system was showcased at this week's NVIDIA GTC for creating avatars and scenes, portraying video conference participants and their surroundings in 3D, or reconstructing scenes for 3D digital maps.
  • Apple Maps, the world's most popular mapping, navigation, and traffic solution, now integrates real-time roadway hazard information into the most comprehensive and trusted digital alert platform for highway safety, HAAS Alert. The Safety Cloud alert is estimated to give Apple Maps users a warning of an impending road hazard, such as emergency vehicles, incident responders, or work zones. As part of Apple's Safety Cloud program, Apple Maps is estimated to display digital alerts for upcoming road conditions so that drivers can stay safer while traveling.
  • In April 2022, Avenza Systems Inc., makers of MAPublisher ® cartographic software and Geographic Imager ® geospatial tools, rebranded its award-winning mobile mapping app and digital map store, Avenza Maps ®, to reflect the company's accelerated growth and current brand vision. As Avenza Maps continues to experience rapid adoption in both the professional and recreation market, the company is increasing its global presence to better reflect the capabilities and application of its platform. Business and individuals who subscribe to Avenza Maps can increase their location awareness, improve their safety, and gain access to more advanced mapping tools.
  • Apple's new Maps app is estimated to provide users with better accuracy and a better user experience starting in April 2022. Beginning with Maps maps now feature a host of amazing features, including details about roads, cities, buildings, water, and even land. Commercial areas are highlighted, green space is shown in more detail, 3D buildings are added, and road paths are marked. Users can also navigate directly to the nearby entrance of a mall or store when navigating within carparks with the new Maps app.

Scope of Report

Attributes Details
Forecast Period 2023 to 2033
Historical Data Available for 2018 to 2022
Market Analysis US$ billion for Value
Key Countries Covered United States, United Kingdom, Japan, India, China, Australia, Germany
Key Segments Covered
  • Type
  • Application
  • Region
Key Companies Profiled
  • TomTom NV
  • HERE Technologies
  • Apple Inc.
  • Alibaba Group
  • Navinfo Co., Ltd
  • INRIX Inc.
  • Baidu, Inc.
  • MapBox Inc.
  • Environmental Systems Research Institute (ESRI)
  • Alphabet Inc.
Report Coverage Market Forecast, Company Share Analysis, Competition Intelligence, DROT Analysis, Market Dynamics and Challenges, and Strategic Growth Initiatives
Customization & Pricing Available upon Request

Digital Map Market by Category

By Type:

  • Software Solutions
    • Web-based
    • Desktop
    • Mobile App
  • Maps (data)
  • Services

By Application:

  • Indoor Navigation/Positioning
    • Airports
    • Retail Stores
    • Health Care Facilities
    • Other
      • Educational Institutes
      • Museums
      • Other Commercial Buildings
  • Outdoor Maps
    • Automotive
    • Mobile & Internet
    • Government & Utilities
    • Real Estate/Construction
    • Others
      • Energy & Mining
      • Agriculture

By Region:

  • North America
  • Latin America
  • Europe
  • Asia Pacific
  • Middle East and Africa

Frequently Asked Questions

How is the Digital Map Market Growing?

The digital map market is predicted to expand at a 14.8% CAGR through 2033.

Which Sector Drives the Digital Map Market?

The outdoor mapping sector drives the digital map market.

What is the Future Scope of Growth for the Digital Map Market?

The digital map market is expected to surpass US$ 73.1 billion by 2033.

What is the Digital Map Market Size?

The digital map market is anticipated to be US$ 18.3 billion in 2023.

Which Country Dominates the Digital Map Market?

The United States is dominating the global digital map market by 2033.

What was the Market Value in 2022?

The market was valued at US$ 16.2 million in 2022.

What is the Projected Value of the Market by 2033?

The market will be worth US$ 73.1 million by 2033.

What is the Projected CAGR for software solutions?

The software solutions are expected to record a 43.2% CAGR.

Which Country Holds the majority of share in the Market?

The United States is estimated to hold a 16.5% share of the market.

What is the Forecasted Growth Rate for the Market?

Digital maps are estimated to exhibit a 14.8% CAGR until 2033.

Table of Content

1. Executive Summary

    1.1. Global Market Outlook

    1.2. Demand-side Trends

    1.3. Supply-side Trends

    1.4. Technology Roadmap Analysis

    1.5. Analysis and Recommendations

2. Market Overview

    2.1. Market Coverage / Taxonomy

    2.2. Market Definition / Scope / Limitations

3. Market Background

    3.1. Market Dynamics

        3.1.1. Drivers

        3.1.2. Restraints

        3.1.3. Opportunity

        3.1.4. Trends

    3.2. Scenario Forecast

        3.2.1. Demand in Optimistic Scenario

        3.2.2. Demand in Likely Scenario

        3.2.3. Demand in Conservative Scenario

    3.3. Opportunity Map Analysis

    3.4. Investment Feasibility Matrix

    3.5. PESTLE and Porter’s Analysis

    3.6. Regulatory Landscape

        3.6.1. By Key Regions

        3.6.2. By Key Countries

    3.7. Regional Parent Market Outlook

4. Global Market Analysis 2018 to 2022 and Forecast, 2023 to 2033

    4.1. Historical Market Size Value (US$ Million) Analysis, 2018 to 2022

    4.2. Current and Future Market Size Value (US$ Million) Projections, 2023 to 2033

        4.2.1. Y-o-Y Growth Trend Analysis

        4.2.2. Absolute $ Opportunity Analysis

5. Global Market Analysis 2018 to 2022 and Forecast 2023 to 2033, By Type

    5.1. Introduction / Key Findings

    5.2. Historical Market Size Value (US$ Million) Analysis By Type, 2018 to 2022

    5.3. Current and Future Market Size Value (US$ Million) Analysis and Forecast By Type, 2023 to 2033

        5.3.1. Software Solutions

            5.3.1.1. Web-based

            5.3.1.2. Desktop

            5.3.1.3. Mobile App

        5.3.2. Maps (data)

        5.3.3. Services

    5.4. Y-o-Y Growth Trend Analysis By Type, 2018 to 2022

    5.5. Absolute $ Opportunity Analysis By Type, 2023 to 2033

6. Global Market Analysis 2018 to 2022 and Forecast 2023 to 2033, By Application

    6.1. Introduction / Key Findings

    6.2. Historical Market Size Value (US$ Million) Analysis By Application, 2018 to 2022

    6.3. Current and Future Market Size Value (US$ Million) Analysis and Forecast By Application, 2023 to 2033

        6.3.1. Indoor Navigation/Positioning

            6.3.1.1. Airports

            6.3.1.2. Retail Stores

            6.3.1.3. Health Care Facilities

            6.3.1.4. Educational Institutes

            6.3.1.5. Museums

            6.3.1.6. Other

        6.3.2. Outdoor Maps

            6.3.2.1. Automotive

            6.3.2.2. Mobile & Internet

            6.3.2.3. Government & Utilities

            6.3.2.4. Real Estate/Construction

            6.3.2.5. Energy & Mining

            6.3.2.6. Agriculture

    6.4. Y-o-Y Growth Trend Analysis By Application, 2018 to 2022

    6.5. Absolute $ Opportunity Analysis By Application, 2023 to 2033

7. Global Market Analysis 2018 to 2022 and Forecast 2023 to 2033, By Region

    7.1. Introduction

    7.2. Historical Market Size Value (US$ Million) Analysis By Region, 2018 to 2022

    7.3. Current Market Size Value (US$ Million) Analysis and Forecast By Region, 2023 to 2033

        7.3.1. North America

        7.3.2. Latin America

        7.3.3. Europe

        7.3.4. South Asia

        7.3.5. East Asia

        7.3.6. Oceania

        7.3.7. MEA

    7.4. Market Attractiveness Analysis By Region

8. North America Market Analysis 2018 to 2022 and Forecast 2023 to 2033, By Country

    8.1. Historical Market Size Value (US$ Million) Trend Analysis By Market Taxonomy, 2018 to 2022

    8.2. Market Size Value (US$ Million) Forecast By Market Taxonomy, 2023 to 2033

        8.2.1. By Country

            8.2.1.1. The USA

            8.2.1.2. Canada

        8.2.2. By Type

        8.2.3. By Application

    8.3. Market Attractiveness Analysis

        8.3.1. By Country

        8.3.2. By Type

        8.3.3. By Application

    8.4. Key Takeaways

9. Latin America Market Analysis 2018 to 2022 and Forecast 2023 to 2033, By Country

    9.1. Historical Market Size Value (US$ Million) Trend Analysis By Market Taxonomy, 2018 to 2022

    9.2. Market Size Value (US$ Million) Forecast By Market Taxonomy, 2023 to 2033

        9.2.1. By Country

            9.2.1.1. Brazil

            9.2.1.2. Mexico

            9.2.1.3. Rest of Latin America

        9.2.2. By Type

        9.2.3. By Application

    9.3. Market Attractiveness Analysis

        9.3.1. By Country

        9.3.2. By Type

        9.3.3. By Application

    9.4. Key Takeaways

10. Europe Market Analysis 2018 to 2022 and Forecast 2023 to 2033, By Country

    10.1. Historical Market Size Value (US$ Million) Trend Analysis By Market Taxonomy, 2018 to 2022

    10.2. Market Size Value (US$ Million) Forecast By Market Taxonomy, 2023 to 2033

        10.2.1. By Country

            10.2.1.1. Germany

            10.2.1.2. United Kingdom

            10.2.1.3. France

            10.2.1.4. Spain

            10.2.1.5. Italy

            10.2.1.6. Rest of Europe

        10.2.2. By Type

        10.2.3. By Application

    10.3. Market Attractiveness Analysis

        10.3.1. By Country

        10.3.2. By Type

        10.3.3. By Application

    10.4. Key Takeaways

11. South Asia Market Analysis 2018 to 2022 and Forecast 2023 to 2033, By Country

    11.1. Historical Market Size Value (US$ Million) Trend Analysis By Market Taxonomy, 2018 to 2022

    11.2. Market Size Value (US$ Million) Forecast By Market Taxonomy, 2023 to 2033

        11.2.1. By Country

            11.2.1.1. India

            11.2.1.2. Malaysia

            11.2.1.3. Singapore

            11.2.1.4. Thailand

            11.2.1.5. Rest of South Asia

        11.2.2. By Type

        11.2.3. By Application

    11.3. Market Attractiveness Analysis

        11.3.1. By Country

        11.3.2. By Type

        11.3.3. By Application

    11.4. Key Takeaways

12. East Asia Market Analysis 2018 to 2022 and Forecast 2023 to 2033, By Country

    12.1. Historical Market Size Value (US$ Million) Trend Analysis By Market Taxonomy, 2018 to 2022

    12.2. Market Size Value (US$ Million) Forecast By Market Taxonomy, 2023 to 2033

        12.2.1. By Country

            12.2.1.1. China

            12.2.1.2. Japan

            12.2.1.3. South Korea

        12.2.2. By Type

        12.2.3. By Application

    12.3. Market Attractiveness Analysis

        12.3.1. By Country

        12.3.2. By Type

        12.3.3. By Application

    12.4. Key Takeaways

13. Oceania Market Analysis 2018 to 2022 and Forecast 2023 to 2033, By Country

    13.1. Historical Market Size Value (US$ Million) Trend Analysis By Market Taxonomy, 2018 to 2022

    13.2. Market Size Value (US$ Million) Forecast By Market Taxonomy, 2023 to 2033

        13.2.1. By Country

            13.2.1.1. Australia

            13.2.1.2. New Zealand

        13.2.2. By Type

        13.2.3. By Application

    13.3. Market Attractiveness Analysis

        13.3.1. By Country

        13.3.2. By Type

        13.3.3. By Application

    13.4. Key Takeaways

14. MEA Market Analysis 2018 to 2022 and Forecast 2023 to 2033, By Country

    14.1. Historical Market Size Value (US$ Million) Trend Analysis By Market Taxonomy, 2018 to 2022

    14.2. Market Size Value (US$ Million) Forecast By Market Taxonomy, 2023 to 2033

        14.2.1. By Country

            14.2.1.1. GCC Countries

            14.2.1.2. South Africa

            14.2.1.3. Israel

            14.2.1.4. Rest of MEA

        14.2.2. By Type

        14.2.3. By Application

    14.3. Market Attractiveness Analysis

        14.3.1. By Country

        14.3.2. By Type

        14.3.3. By Application

    14.4. Key Takeaways

15. Key Countries Market Analysis

    15.1. USA

        15.1.1. Pricing Analysis

        15.1.2. Market Share Analysis, 2022

            15.1.2.1. By Type

            15.1.2.2. By Application

    15.2. Canada

        15.2.1. Pricing Analysis

        15.2.2. Market Share Analysis, 2022

            15.2.2.1. By Type

            15.2.2.2. By Application

    15.3. Brazil

        15.3.1. Pricing Analysis

        15.3.2. Market Share Analysis, 2022

            15.3.2.1. By Type

            15.3.2.2. By Application

    15.4. Mexico

        15.4.1. Pricing Analysis

        15.4.2. Market Share Analysis, 2022

            15.4.2.1. By Type

            15.4.2.2. By Application

    15.5. Germany

        15.5.1. Pricing Analysis

        15.5.2. Market Share Analysis, 2022

            15.5.2.1. By Type

            15.5.2.2. By Application

    15.6. United Kingdom

        15.6.1. Pricing Analysis

        15.6.2. Market Share Analysis, 2022

            15.6.2.1. By Type

            15.6.2.2. By Application

    15.7. France

        15.7.1. Pricing Analysis

        15.7.2. Market Share Analysis, 2022

            15.7.2.1. By Type

            15.7.2.2. By Application

    15.8. Spain

        15.8.1. Pricing Analysis

        15.8.2. Market Share Analysis, 2022

            15.8.2.1. By Type

            15.8.2.2. By Application

    15.9. Italy

        15.9.1. Pricing Analysis

        15.9.2. Market Share Analysis, 2022

            15.9.2.1. By Type

            15.9.2.2. By Application

    15.10. India

        15.10.1. Pricing Analysis

        15.10.2. Market Share Analysis, 2022

            15.10.2.1. By Type

            15.10.2.2. By Application

    15.11. Malaysia

        15.11.1. Pricing Analysis

        15.11.2. Market Share Analysis, 2022

            15.11.2.1. By Type

            15.11.2.2. By Application

    15.12. Singapore

        15.12.1. Pricing Analysis

        15.12.2. Market Share Analysis, 2022

            15.12.2.1. By Type

            15.12.2.2. By Application

    15.13. Thailand

        15.13.1. Pricing Analysis

        15.13.2. Market Share Analysis, 2022

            15.13.2.1. By Type

            15.13.2.2. By Application

    15.14. China

        15.14.1. Pricing Analysis

        15.14.2. Market Share Analysis, 2022

            15.14.2.1. By Type

            15.14.2.2. By Application

    15.15. Japan

        15.15.1. Pricing Analysis

        15.15.2. Market Share Analysis, 2022

            15.15.2.1. By Type

            15.15.2.2. By Application

    15.16. South Korea

        15.16.1. Pricing Analysis

        15.16.2. Market Share Analysis, 2022

            15.16.2.1. By Type

            15.16.2.2. By Application

    15.17. Australia

        15.17.1. Pricing Analysis

        15.17.2. Market Share Analysis, 2022

            15.17.2.1. By Type

            15.17.2.2. By Application

    15.18. New Zealand

        15.18.1. Pricing Analysis

        15.18.2. Market Share Analysis, 2022

            15.18.2.1. By Type

            15.18.2.2. By Application

    15.19. GCC Countries

        15.19.1. Pricing Analysis

        15.19.2. Market Share Analysis, 2022

            15.19.2.1. By Type

            15.19.2.2. By Application

    15.20. South Africa

        15.20.1. Pricing Analysis

        15.20.2. Market Share Analysis, 2022

            15.20.2.1. By Type

            15.20.2.2. By Application

    15.21. Israel

        15.21.1. Pricing Analysis

        15.21.2. Market Share Analysis, 2022

            15.21.2.1. By Type

            15.21.2.2. By Application

16. Market Structure Analysis

    16.1. Competition Dashboard

    16.2. Competition Benchmarking

    16.3. Market Share Analysis of Top Players

        16.3.1. By Regional

        16.3.2. By Type

        16.3.3. By Application

17. Competition Analysis

    17.1. Competition Deep Dive

        17.1.1. TomTom NV

            17.1.1.1. Overview

            17.1.1.2. Product Portfolio

            17.1.1.3. Profitability by Market Segments

            17.1.1.4. Sales Footprint

            17.1.1.5. Strategy Overview

                17.1.1.5.1. Marketing Strategy

        17.1.2. HERE Technologies

            17.1.2.1. Overview

            17.1.2.2. Product Portfolio

            17.1.2.3. Profitability by Market Segments

            17.1.2.4. Sales Footprint

            17.1.2.5. Strategy Overview

                17.1.2.5.1. Marketing Strategy

        17.1.3. Apple Inc.

            17.1.3.1. Overview

            17.1.3.2. Product Portfolio

            17.1.3.3. Profitability by Market Segments

            17.1.3.4. Sales Footprint

            17.1.3.5. Strategy Overview

                17.1.3.5.1. Marketing Strategy

        17.1.4. Alibaba Group

            17.1.4.1. Overview

            17.1.4.2. Product Portfolio

            17.1.4.3. Profitability by Market Segments

            17.1.4.4. Sales Footprint

            17.1.4.5. Strategy Overview

                17.1.4.5.1. Marketing Strategy

        17.1.5. Navinfo Co., Ltd

            17.1.5.1. Overview

            17.1.5.2. Product Portfolio

            17.1.5.3. Profitability by Market Segments

            17.1.5.4. Sales Footprint

            17.1.5.5. Strategy Overview

                17.1.5.5.1. Marketing Strategy

        17.1.6. INRIX Inc.

            17.1.6.1. Overview

            17.1.6.2. Product Portfolio

            17.1.6.3. Profitability by Market Segments

            17.1.6.4. Sales Footprint

            17.1.6.5. Strategy Overview

                17.1.6.5.1. Marketing Strategy

        17.1.7. Baidu, Inc.

            17.1.7.1. Overview

            17.1.7.2. Product Portfolio

            17.1.7.3. Profitability by Market Segments

            17.1.7.4. Sales Footprint

            17.1.7.5. Strategy Overview

                17.1.7.5.1. Marketing Strategy

        17.1.8. MapBox Inc.

            17.1.8.1. Overview

            17.1.8.2. Product Portfolio

            17.1.8.3. Profitability by Market Segments

            17.1.8.4. Sales Footprint

            17.1.8.5. Strategy Overview

                17.1.8.5.1. Marketing Strategy

        17.1.9. Environmental Systems Research Institute (ESRI)

            17.1.9.1. Overview

            17.1.9.2. Product Portfolio

            17.1.9.3. Profitability by Market Segments

            17.1.9.4. Sales Footprint

            17.1.9.5. Strategy Overview

                17.1.9.5.1. Marketing Strategy

        17.1.10. Alphabet Inc.

            17.1.10.1. Overview

            17.1.10.2. Product Portfolio

            17.1.10.3. Profitability by Market Segments

            17.1.10.4. Sales Footprint

            17.1.10.5. Strategy Overview

                17.1.10.5.1. Marketing Strategy

18. Assumptions & Acronyms Used

19. Research Methodology

List of Tables

Table 1: Global Market Value (US$ Million) Forecast by Region, 2018 to 2033

Table 2: Global Market Value (US$ Million) Forecast by Type, 2018 to 2033

Table 3: Global Market Value (US$ Million) Forecast by Application, 2018 to 2033

Table 4: North America Market Value (US$ Million) Forecast by Country, 2018 to 2033

Table 5: North America Market Value (US$ Million) Forecast by Type, 2018 to 2033

Table 6: North America Market Value (US$ Million) Forecast by Application, 2018 to 2033

Table 7: Latin America Market Value (US$ Million) Forecast by Country, 2018 to 2033

Table 8: Latin America Market Value (US$ Million) Forecast by Type, 2018 to 2033

Table 9: Latin America Market Value (US$ Million) Forecast by Application, 2018 to 2033

Table 10: Europe Market Value (US$ Million) Forecast by Country, 2018 to 2033

Table 11: Europe Market Value (US$ Million) Forecast by Type, 2018 to 2033

Table 12: Europe Market Value (US$ Million) Forecast by Application, 2018 to 2033

Table 13: South Asia Market Value (US$ Million) Forecast by Country, 2018 to 2033

Table 14: South Asia Market Value (US$ Million) Forecast by Type, 2018 to 2033

Table 15: South Asia Market Value (US$ Million) Forecast by Application, 2018 to 2033

Table 16: East Asia Market Value (US$ Million) Forecast by Country, 2018 to 2033

Table 17: East Asia Market Value (US$ Million) Forecast by Type, 2018 to 2033

Table 18: East Asia Market Value (US$ Million) Forecast by Application, 2018 to 2033

Table 19: Oceania Market Value (US$ Million) Forecast by Country, 2018 to 2033

Table 20: Oceania Market Value (US$ Million) Forecast by Type, 2018 to 2033

Table 21: Oceania Market Value (US$ Million) Forecast by Application, 2018 to 2033

Table 22: MEA Market Value (US$ Million) Forecast by Country, 2018 to 2033

Table 23: MEA Market Value (US$ Million) Forecast by Type, 2018 to 2033

Table 24: MEA Market Value (US$ Million) Forecast by Application, 2018 to 2033

List of Charts

Figure 1: Global Market Value (US$ Million) by Type, 2023 to 2033

Figure 2: Global Market Value (US$ Million) by Application, 2023 to 2033

Figure 3: Global Market Value (US$ Million) by Region, 2023 to 2033

Figure 4: Global Market Value (US$ Million) Analysis by Region, 2018 to 2033

Figure 5: Global Market Value Share (%) and BPS Analysis by Region, 2023 to 2033

Figure 6: Global Market Y-o-Y Growth (%) Projections by Region, 2023 to 2033

Figure 7: Global Market Value (US$ Million) Analysis by Type, 2018 to 2033

Figure 8: Global Market Value Share (%) and BPS Analysis by Type, 2023 to 2033

Figure 9: Global Market Y-o-Y Growth (%) Projections by Type, 2023 to 2033

Figure 10: Global Market Value (US$ Million) Analysis by Application, 2018 to 2033

Figure 11: Global Market Value Share (%) and BPS Analysis by Application, 2023 to 2033

Figure 12: Global Market Y-o-Y Growth (%) Projections by Application, 2023 to 2033

Figure 13: Global Market Attractiveness by Type, 2023 to 2033

Figure 14: Global Market Attractiveness by Application, 2023 to 2033

Figure 15: Global Market Attractiveness by Region, 2023 to 2033

Figure 16: North America Market Value (US$ Million) by Type, 2023 to 2033

Figure 17: North America Market Value (US$ Million) by Application, 2023 to 2033

Figure 18: North America Market Value (US$ Million) by Country, 2023 to 2033

Figure 19: North America Market Value (US$ Million) Analysis by Country, 2018 to 2033

Figure 20: North America Market Value Share (%) and BPS Analysis by Country, 2023 to 2033

Figure 21: North America Market Y-o-Y Growth (%) Projections by Country, 2023 to 2033

Figure 22: North America Market Value (US$ Million) Analysis by Type, 2018 to 2033

Figure 23: North America Market Value Share (%) and BPS Analysis by Type, 2023 to 2033

Figure 24: North America Market Y-o-Y Growth (%) Projections by Type, 2023 to 2033

Figure 25: North America Market Value (US$ Million) Analysis by Application, 2018 to 2033

Figure 26: North America Market Value Share (%) and BPS Analysis by Application, 2023 to 2033

Figure 27: North America Market Y-o-Y Growth (%) Projections by Application, 2023 to 2033

Figure 28: North America Market Attractiveness by Type, 2023 to 2033

Figure 29: North America Market Attractiveness by Application, 2023 to 2033

Figure 30: North America Market Attractiveness by Country, 2023 to 2033

Figure 31: Latin America Market Value (US$ Million) by Type, 2023 to 2033

Figure 32: Latin America Market Value (US$ Million) by Application, 2023 to 2033

Figure 33: Latin America Market Value (US$ Million) by Country, 2023 to 2033

Figure 34: Latin America Market Value (US$ Million) Analysis by Country, 2018 to 2033

Figure 35: Latin America Market Value Share (%) and BPS Analysis by Country, 2023 to 2033

Figure 36: Latin America Market Y-o-Y Growth (%) Projections by Country, 2023 to 2033

Figure 37: Latin America Market Value (US$ Million) Analysis by Type, 2018 to 2033

Figure 38: Latin America Market Value Share (%) and BPS Analysis by Type, 2023 to 2033

Figure 39: Latin America Market Y-o-Y Growth (%) Projections by Type, 2023 to 2033

Figure 40: Latin America Market Value (US$ Million) Analysis by Application, 2018 to 2033

Figure 41: Latin America Market Value Share (%) and BPS Analysis by Application, 2023 to 2033

Figure 42: Latin America Market Y-o-Y Growth (%) Projections by Application, 2023 to 2033

Figure 43: Latin America Market Attractiveness by Type, 2023 to 2033

Figure 44: Latin America Market Attractiveness by Application, 2023 to 2033

Figure 45: Latin America Market Attractiveness by Country, 2023 to 2033

Figure 46: Europe Market Value (US$ Million) by Type, 2023 to 2033

Figure 47: Europe Market Value (US$ Million) by Application, 2023 to 2033

Figure 48: Europe Market Value (US$ Million) by Country, 2023 to 2033

Figure 49: Europe Market Value (US$ Million) Analysis by Country, 2018 to 2033

Figure 50: Europe Market Value Share (%) and BPS Analysis by Country, 2023 to 2033

Figure 51: Europe Market Y-o-Y Growth (%) Projections by Country, 2023 to 2033

Figure 52: Europe Market Value (US$ Million) Analysis by Type, 2018 to 2033

Figure 53: Europe Market Value Share (%) and BPS Analysis by Type, 2023 to 2033

Figure 54: Europe Market Y-o-Y Growth (%) Projections by Type, 2023 to 2033

Figure 55: Europe Market Value (US$ Million) Analysis by Application, 2018 to 2033

Figure 56: Europe Market Value Share (%) and BPS Analysis by Application, 2023 to 2033

Figure 57: Europe Market Y-o-Y Growth (%) Projections by Application, 2023 to 2033

Figure 58: Europe Market Attractiveness by Type, 2023 to 2033

Figure 59: Europe Market Attractiveness by Application, 2023 to 2033

Figure 60: Europe Market Attractiveness by Country, 2023 to 2033

Figure 61: South Asia Market Value (US$ Million) by Type, 2023 to 2033

Figure 62: South Asia Market Value (US$ Million) by Application, 2023 to 2033

Figure 63: South Asia Market Value (US$ Million) by Country, 2023 to 2033

Figure 64: South Asia Market Value (US$ Million) Analysis by Country, 2018 to 2033

Figure 65: South Asia Market Value Share (%) and BPS Analysis by Country, 2023 to 2033

Figure 66: South Asia Market Y-o-Y Growth (%) Projections by Country, 2023 to 2033

Figure 67: South Asia Market Value (US$ Million) Analysis by Type, 2018 to 2033

Figure 68: South Asia Market Value Share (%) and BPS Analysis by Type, 2023 to 2033

Figure 69: South Asia Market Y-o-Y Growth (%) Projections by Type, 2023 to 2033

Figure 70: South Asia Market Value (US$ Million) Analysis by Application, 2018 to 2033

Figure 71: South Asia Market Value Share (%) and BPS Analysis by Application, 2023 to 2033

Figure 72: South Asia Market Y-o-Y Growth (%) Projections by Application, 2023 to 2033

Figure 73: South Asia Market Attractiveness by Type, 2023 to 2033

Figure 74: South Asia Market Attractiveness by Application, 2023 to 2033

Figure 75: South Asia Market Attractiveness by Country, 2023 to 2033

Figure 76: East Asia Market Value (US$ Million) by Type, 2023 to 2033

Figure 77: East Asia Market Value (US$ Million) by Application, 2023 to 2033

Figure 78: East Asia Market Value (US$ Million) by Country, 2023 to 2033

Figure 79: East Asia Market Value (US$ Million) Analysis by Country, 2018 to 2033

Figure 80: East Asia Market Value Share (%) and BPS Analysis by Country, 2023 to 2033

Figure 81: East Asia Market Y-o-Y Growth (%) Projections by Country, 2023 to 2033

Figure 82: East Asia Market Value (US$ Million) Analysis by Type, 2018 to 2033

Figure 83: East Asia Market Value Share (%) and BPS Analysis by Type, 2023 to 2033

Figure 84: East Asia Market Y-o-Y Growth (%) Projections by Type, 2023 to 2033

Figure 85: East Asia Market Value (US$ Million) Analysis by Application, 2018 to 2033

Figure 86: East Asia Market Value Share (%) and BPS Analysis by Application, 2023 to 2033

Figure 87: East Asia Market Y-o-Y Growth (%) Projections by Application, 2023 to 2033

Figure 88: East Asia Market Attractiveness by Type, 2023 to 2033

Figure 89: East Asia Market Attractiveness by Application, 2023 to 2033

Figure 90: East Asia Market Attractiveness by Country, 2023 to 2033

Figure 91: Oceania Market Value (US$ Million) by Type, 2023 to 2033

Figure 92: Oceania Market Value (US$ Million) by Application, 2023 to 2033

Figure 93: Oceania Market Value (US$ Million) by Country, 2023 to 2033

Figure 94: Oceania Market Value (US$ Million) Analysis by Country, 2018 to 2033

Figure 95: Oceania Market Value Share (%) and BPS Analysis by Country, 2023 to 2033

Figure 96: Oceania Market Y-o-Y Growth (%) Projections by Country, 2023 to 2033

Figure 97: Oceania Market Value (US$ Million) Analysis by Type, 2018 to 2033

Figure 98: Oceania Market Value Share (%) and BPS Analysis by Type, 2023 to 2033

Figure 99: Oceania Market Y-o-Y Growth (%) Projections by Type, 2023 to 2033

Figure 100: Oceania Market Value (US$ Million) Analysis by Application, 2018 to 2033

Figure 101: Oceania Market Value Share (%) and BPS Analysis by Application, 2023 to 2033

Figure 102: Oceania Market Y-o-Y Growth (%) Projections by Application, 2023 to 2033

Figure 103: Oceania Market Attractiveness by Type, 2023 to 2033

Figure 104: Oceania Market Attractiveness by Application, 2023 to 2033

Figure 105: Oceania Market Attractiveness by Country, 2023 to 2033

Figure 106: MEA Market Value (US$ Million) by Type, 2023 to 2033

Figure 107: MEA Market Value (US$ Million) by Application, 2023 to 2033

Figure 108: MEA Market Value (US$ Million) by Country, 2023 to 2033

Figure 109: MEA Market Value (US$ Million) Analysis by Country, 2018 to 2033

Figure 110: MEA Market Value Share (%) and BPS Analysis by Country, 2023 to 2033

Figure 111: MEA Market Y-o-Y Growth (%) Projections by Country, 2023 to 2033

Figure 112: MEA Market Value (US$ Million) Analysis by Type, 2018 to 2033

Figure 113: MEA Market Value Share (%) and BPS Analysis by Type, 2023 to 2033

Figure 114: MEA Market Y-o-Y Growth (%) Projections by Type, 2023 to 2033

Figure 115: MEA Market Value (US$ Million) Analysis by Application, 2018 to 2033

Figure 116: MEA Market Value Share (%) and BPS Analysis by Application, 2023 to 2033

Figure 117: MEA Market Y-o-Y Growth (%) Projections by Application, 2023 to 2033

Figure 118: MEA Market Attractiveness by Type, 2023 to 2033

Figure 119: MEA Market Attractiveness by Application, 2023 to 2033

Figure 120: MEA Market Attractiveness by Country, 2023 to 2033

Recommendations

Technology

Digital Transformation Industry Analysis in MENA

Published : February 2024

Healthcare

Digital Pathology Market

Published : October 2023

Explore Technology Insights

View Reports