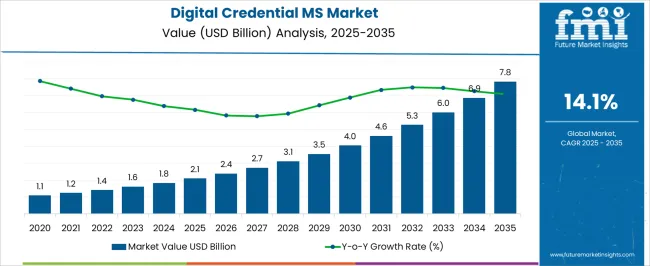
The Digital Credential Management Software Market is estimated to be valued at USD 2.1 billion in 2025 and is projected to reach USD 7.8 billion by 2035, registering a compound annual growth rate (CAGR) of 14.1% over the forecast period.

| Metric | Value |
|---|---|
| Digital Credential Management Software Market Estimated Value in (2025 E) | USD 2.1 billion |
| Digital Credential Management Software Market Forecast Value in (2035 F) | USD 7.8 billion |
| Forecast CAGR (2025 to 2035) | 14.1% |
The digital credential management software market is expanding steadily, fueled by the growing demand for secure digital identities and compliance with evolving data protection standards. Industry announcements and enterprise IT updates have underscored the rising adoption of credential management systems to safeguard sensitive corporate data, prevent unauthorized access, and streamline authentication processes.
Organizations are increasingly prioritizing cybersecurity investments to mitigate risks of data breaches and credential theft, a trend further accelerated by the surge in remote and hybrid working models. Regulatory frameworks across regions mandating stricter identity verification protocols have also boosted deployment.
Technological advancements such as integration of blockchain, multi-factor authentication, and AI-powered monitoring tools have enhanced software capabilities, strengthening trust among users. Looking ahead, the market is poised for sustained growth as enterprises across industries modernize their IT security infrastructure, with on-premises deployments and large company applications expected to anchor market demand due to their operational scale and compliance requirements.

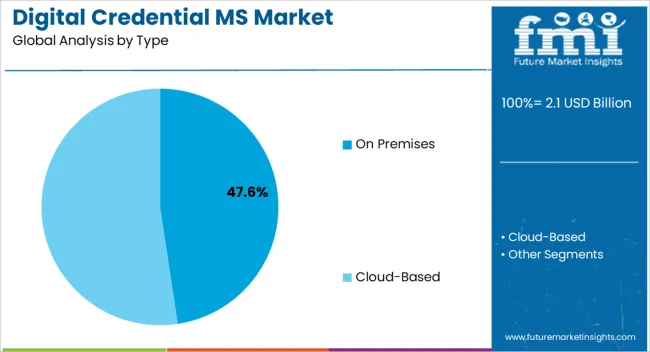
The On Premises segment is projected to contribute 47.60% of the digital credential management software market revenue in 2025, retaining a significant share due to its ability to provide greater control over sensitive data and compliance management. Enterprises with stringent security policies have preferred on-premises solutions to mitigate risks associated with third-party data hosting.
Reports from enterprise IT forums have highlighted that industries such as finance, healthcare, and government rely on on-premises credential management to ensure regulatory adherence and reduce vulnerabilities. Additionally, large organizations with robust IT departments have invested in tailored deployments that integrate seamlessly with legacy systems, further strengthening the appeal of this model.
Concerns over data sovereignty, coupled with the ability to customize security protocols, have reinforced adoption. While cloud-based deployments are gaining traction, the On Premises segment continues to dominate environments where high levels of security assurance and operational control are essential.

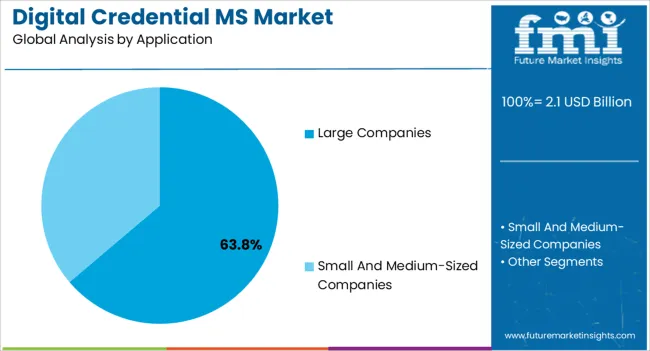
The Large Companies segment is anticipated to hold 63.80% of the digital credential management software market revenue in 2025, establishing itself as the dominant application category. This growth has been driven by the scale and complexity of credential management needs within multinational corporations and large enterprises.
IT security reports and annual disclosures from technology providers have emphasized the heightened risk profile of large companies, making advanced credential management software critical for safeguarding expansive employee, partner, and customer networks. These organizations have adopted credential management solutions to streamline user provisioning, enforce role-based access controls, and ensure compliance with global regulatory standards.
Furthermore, the integration of credential management software into enterprise-wide digital transformation initiatives has enhanced adoption rates. Large companies have also prioritized investments in solutions that support scalability, interoperability, and advanced analytics to monitor credential usage patterns. With rising cyber threats targeting large enterprises, the Large Companies segment is expected to maintain its leadership position in driving demand for digital credential management solutions.
Historically, from 2020 to 2025, the value of the digital credential management software market increased at around 17.5% CAGR. With an absolute dollar opportunity of USD 2.1 billion from 2025 to 2035, the market is projected to reach a valuation of USD 5.3 billion at a CAGR of 14.7%.
The primary drivers of the digital credential management software market are the increasing number of security breaches and identity-related fraud cases, rising compliance management awareness, expanding demand for digital credential management software for IoT, and increased investment in cybersecurity.
Additionally, the cultural transition from traditional digital credential management software to digital credential management software, the proliferation of cloud-based solutions and services, the growing popularity of the hybrid cloud model, and the growing incorporation of technologies like artificial intelligence, machine learning, blockchain, and biometrics into digital credential software would all present lucrative opportunities for digital credential software vendors.
The need for the right skills to reduce cyber risks has significantly increased due to the growing danger of cyber threats. Additionally, organizations are finding it difficult to defend against common cyber threats, which have increased the demand for digital credential management software.
The need for IT security, confidentiality, and product compliance software is also rising because of the organizations' strong requirement for efficient regulatory talent and effective planning for cyber catastrophes. Companies thus anticipate automating the validation process, which will incorporate various means of getting visibility and foretelling compliance in the architecture, with the implementation of cloud and building infrastructure.
By analyzing the dashboards, which become more pertinent and useful with dynamic new technologies, the organizations can also comprehend the security and the process that led to validation.
Digital credential management software is becoming widely used due to the expanding cloud market and the growing need to safeguard and manage numerous accounts that employees can access through the cloud. Digital credential management software had to be bought and set up on-premises in the past since enterprises thought of them as capital expenditures.
The successful deployment of digital credential management software projects came at a high cost. It took months of laborious work, but this trend is now changing as cloud use soars, making it simpler to implement and gain access to cloud-based digital credential management software services. Digital credential management software technologies that may be put on-premises and accessed via the cloud can be chosen by end-users with the help of hybrid deployments of digital credential management solutions.
Digital credential management software service providers have the leverage to expand owing to the attractive pricing options, including a subscription service model and pay-as-you-go. Additionally, cloud-based consumer digital credential management software requires less time and money. This aspect is anticipated to encourage the implementation of consumer digital credential management software across enterprises of all sizes, coupled with the expansion of SMEs.
Enterprises are expanding the use of delivering excellent software by integrating automated dashboards for corporate security monitoring architecture. Additionally, the lack of new technology-based platforms in companies due to dynamic legislative updates and changes in workplace culture is impacting the implementation of compliance management systems. The existence of this type of legacy system makes the system useless while emphasizing the regulatory risk and making it more complicated. The market expansion for digital credential management software is hampered by this process, which presents difficulties for compliance management solutions.
Recruiters and government officials are seeking answers to the skills deficit as the need for skilled cybersecurity workers continues to rise. Additionally, users may log into essential business apps from any location, at any time, and on any device, owing to the rise in distributed cloud-based services. On the other hand, managing user identities has become more difficult due to these widespread cloud-based apps. Customers are fast downloading various applications to take advantage of the services offered by businesses; as a result, they are using numerous applications and thus find it challenging to remember passwords for various accounts.
North America dominates the cyber security market and is regarded as having the most developed infrastructure for the adoption of cyber technologies. Also, it is the region with the greatest number of cybercrime incidents worldwide. The region's administration has designated cyber security as its most pressing economic and national threat. Organizations in North America are using digital credential management software because of the changing demands of the workforce, the introduction of cloud applications, the consolidation of BYOD trends, and the requirement to maintain regulatory compliance.
Numerous businesses are working to explore and develop concepts for improved digital credential management software as business knowledge of digital credential management software grows. Digital credential management software enables American firms to manage their infrastructure, adhere to regulations, manage compliance, analyze risk and fraud, and integrate SIEM. North America is anticipated to be the most profitable region for various types of vendors due to specific budgetary allocation and required identity management policies. The safety of personnel and customer data is the organization's top priority at several large corporations and quickly expanding SMEs in the region.
Due to the growing threat of authentication and authorization breaches, Asia Pacific is anticipated to invest more in security. The region includes developing nations, including Australia, China, Japan, and India. Over 70% of the workforce in these nations is employed by numerous SMEs. The need for large investments prevents SMEs from implementing significant digital credential management software projects on their premises. However, the key drivers of this acceptance are reasons including rising internet usage, compliance regulations, and smartphone adoption.
The United States is expected to account for the largest market share of USD 7.8 billion by the end of 2035. The widespread usage of smart mobile platforms and the country's booming e-commerce industry are key factors driving the market's expansion.
The on-premises deployment of digital credential management software is expected to account for a CAGR of 14.5% by the end of 2035. The automated user provisioning process helps large businesses save money while also improving audibility and compliance across their entire SaaS application portfolio, including Yammer, Google Apps, WebEx, and Box.net.
The cloud segment is expected to increase at the highest pace throughout the forecast. One of the key factors influencing segment growth is the growing acceptance of the cloud model by various organizations due to its low cost and economies of scale. Moreover, IT, sales, and business departments are migrating to the cloud to take advantage of its benefits. With no software or hardware deployment, cloud-based digital credential management tools and services offer several advantages, like streamlined administration and lower expenses.
In 2025, the revenue through large companies held the largest share among the application types. It is expected to account for 14% CAGR during the forecast period. Large businesses are investing in cutting-edge technology solutions to provide their clients with cutting-edge identity protection. Large corporations are likely to be potential users of digital credential management software since they offer solutions across numerous categories and industries. Small and medium-sized businesses are expected to witness the highest CAGR across all categories and industries during the projection period, making them likely candidates to use digital credential management software.

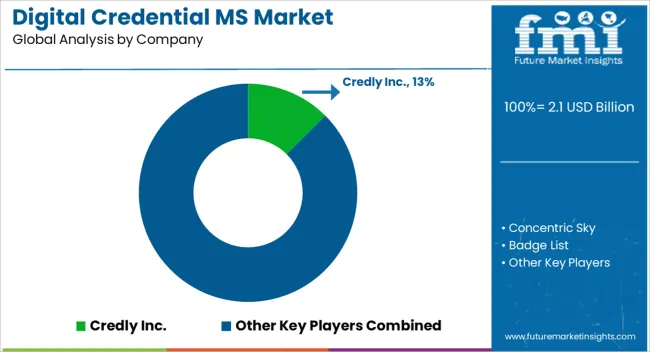
The key strategies participants in the digital credential management industry use are solution launches, acquisitions, and collaborations. Some key digital credential management software companies include Credly Inc., Concentric Sky, Badge List, Badge Craft, Be Badges, Nocti Business Solutions and Portfolium Inc.
Some of the recent developments in the digital credential management software market are :
The global digital credential management software market is estimated to be valued at USD 2.1 billion in 2025.
The market size for the digital credential management software market is projected to reach USD 7.8 billion by 2035.
The digital credential management software market is expected to grow at a 14.1% CAGR between 2025 and 2035.
The key product types in digital credential management software market are on premises and cloud-based.
In terms of application, large companies segment to command 63.8% share in the digital credential management software market in 2025.


Full Research Suite comprises of:
Market outlook & trends analysis
Interviews & case studies
Strategic recommendations
Vendor profiles & capabilities analysis
5-year forecasts
8 regions and 60+ country-level data splits
Market segment data splits
12 months of continuous data updates
DELIVERED AS:
PDF EXCEL ONLINE
Digital Liquid Filling Systems Market Size and Share Forecast Outlook 2025 to 2035
Digital Transformation Industry Analysis in MENA Size and Share Forecast Outlook 2025 to 2035
Digital X-Ray Equipment Market Size and Share Forecast Outlook 2025 to 2035
Digital Marketing Analytics Industry Analysis in Latin America Forecast Outlook 2025 to 2035
Digital Health Market Forecast and Outlook 2025 to 2035
Digital Pen Market Forecast and Outlook 2025 to 2035
Digital X-ray Market Size and Share Forecast Outlook 2025 to 2035
Digital Elevation Model Market Size and Share Forecast Outlook 2025 to 2035
Digital Pump Controller Market Size and Share Forecast Outlook 2025 to 2035
Digital Textile Printing Market Size and Share Forecast Outlook 2025 to 2035
Digital Printing Paper Market Size and Share Forecast Outlook 2025 to 2035
Digital Battlefield Market Size and Share Forecast Outlook 2025 to 2035
Digital Lending Platform Market Size and Share Forecast Outlook 2025 to 2035
Digital Shipyard Market Size and Share Forecast Outlook 2025 to 2035
Digital Freight Matching Market Size and Share Forecast Outlook 2025 to 2035
Digital Textile Printer Market Size and Share Forecast Outlook 2025 to 2035
Digital Thermo Anemometer Market Size and Share Forecast Outlook 2025 to 2035
Digital Twins Technologies Market Size and Share Forecast Outlook 2025 to 2035
Digital Servo Motors and Drives Market Size and Share Forecast Outlook 2025 to 2035
Digital Signature Market Size and Share Forecast Outlook 2025 to 2035

Thank you!
You will receive an email from our Business Development Manager. Please be sure to check your SPAM/JUNK folder too.
Chat With
MaRIA